 Open Access Article
Er3+/Yb3+ co-doped nanocrystals modified with 6-aminocaproic acid for temperature sensing in biomedicine†
Bing Wu a,
Lijuan Zhao*a,
Ying Wangb,
Haotian Donga and
Hua Yu*a
aKey Laboratory of Weak-Light Nonlinear Photonics, Ministry of Education, School of Physics, Nankai University, Tianjin 300071, China. E-mail: zhaolj@nankai.edu.cn; yuhua@nankai.edu.cn
bTEDA Institute of Biological Sciences and Biotechnology, Nankai University, 23 Hongda Street, TEDA, Tianjin 300457, China
First published on 19th December 2019
Abstract
We report β-PbF2:Er3+/Yb3+ nanocrystals (NCs) modified with 6-aminocaproic acid (6AA) via wet chemical etching of glass ceramics (GCs). NCs body-doped with trivalent rare-earth (RE3+) ions were released from the GCs by etching of the glass matrix and modified with bifunctional 6AA ligands to enhance their water solubility. They have good stability in water with an average diameter of 56 nm and display efficient green (521, 550 nm) and red (660 nm) emission under the excitation of a 940 nm laser. High absolute sensitivity (SA) and relative sensitivity (SR) (0.0027 K−1 and 1.18% K−1, respectively) and high resolution (0.25 K) were achieved for temperature sensing in the biological temperature range, using the fluorescence intensity ratio (FIR) technique. All of the experimental results indicate that the Er3+/Yb3+ co-doped NCs modified with 6AA may potentially be useful as fluorescent biological temperature sensors.
Introduction
Temperature is a key parameter in many fields, including medicine, aeronautics, electronics, and catalysis.1,2 Conventional contact temperature measurements are based on the principle of either the thermal expansion of materials or the Seebeck effect, for example liquid-filled glass thermometers and thermocouples.3,4 Therefore, they cannot be applied in sub-micron scale or harsh environments, such as high-voltage power plants, microcircuits, and intracellular liquids.5–7 Compared with contact thermometers, optical temperature measurement has the unique advantages of non-contact measurement and large-scale imaging,8 which are based on particular parameters of luminescence such as the peak position, line width, fluorescence intensity, fluorescence lifetime, and FIR.9 In particular, FIR from the transitions of thermally coupled levels (TCLs) of rare earth ions can avoid the effects of excitation power fluctuation and spectral loss, leading to a much higher accuracy.Rare earth doped up-conversion temperature sensing materials based on the FIR from transitions of TCLs have aroused wide interest in the biomedical field owing to their deep penetration depth, being less prone to photobleaching, and exhibiting less spontaneous autofluorescence interference as well as minimal photo damage to living organisms.10–12 Viruses are small, non-cellular organisms that must be parasitized and replicated in living cells. They are highly infectious and extremely harmful, particularly lentiviruses such as human immunodeficiency virus, and the medical community has not yet found an efficient and reasonable treatment strategy.13 Recently, researchers have found that lentiviral nucleocapsids play a crucial role in the lentiviral replication cycle and are considered ideal targets for antiviral therapy.14 Detecting the temperature changes that accompany nucleocapsid binding and exploring the effects of temperature changes on the activity of proteases and reverse transcriptases, helps to deepen the understanding of lentiviral replication and develop more efficient and rational lentiviral treatment strategies. Nano temperature sensors are therefore urgently needed to monitor the temperature changes involved in this process.
For NCs to be used for temperature sensing in biomedicine several main requirements must be met: (i) high UCL efficiency to improve the signal-to-noise ratio; (ii) high stability; (iii) good dispersibility in aqueous solutions; (iv) suitable surface properties, that is, the presence of functional groups such as carboxyl (–COOH), amino (–NH2), or maleimide (MA) groups on the surface to improve the biocompatibility of NCs and allow further conjugation with biological molecules.12 However, the preparation and application of NC temperature sensors still present numerous challenges. Rare earth doped up-conversion luminescent materials are generally synthesized in liquid conditions by interstitial doping, and the rare earth ions are exposed on the surface of the matrix. When the doping concentration is high, it is easy to cause surface fluorescence quenching, resulting in lower luminescence efficiency.15 In addition, to control the size and morphology of NCs, hydrophobic materials such as oleic acid or oleylamine are often added as capping ligands, so they must be converted into hydrophilic analogues so that they can be applied in biological fields.16 However, the surface modification process is sensitive to the pH and the amount of ligand as well as other factors, and the capping thickness is not easy to control and can lead to agglomeration.17,18
Recently, amphiphilic amino acid biomolecules have received significant attention in the synthesis of water-dispersible NCs in aqueous media as their hydrophilic surface properties make the sample suitable for biotechnology applications.19 In addition, by using the melting–annealing method, the rare earth ions can be doped into crystallites with low phonon energy by cation substitution, which suppresses the probability of non-radiative relaxation and makes the luminescence efficiency very high.
In this study, we use a conventional melting–annealing method to synthesize GCs, and extract NCs from the GCs by wet chemical etching. While etching, 6AA was modified in the outer layer of nanocrystalline to prevent agglomeration, improve the biocompatibility of NCs and effectively inhibit the energy transfer between RE3+ ions and biological tissues. To avoid the interference of spontaneous fluorescence in biological tissues and the thermal damage to living organisms caused by 980 nm lasers, we used a 940 nm laser as the excitation source to study the temperature sensing behavior of the NCs in the liquid environment. Importantly, the Er3+/Yb3+ co-doped NCs modified with 6AA have great potential for biomedical application as temperature sensors.
Experimental
Synthesis of Er3+/Yb3+ co-doped PbF2 NCs modified with 6AA
The Er3+/Yb3+ co-doped PbF2 NCs modified with 6AA were prepared using a conventional melting–annealing method with subsequent wet chemical etching. First, the precursor glasses were prepared with the following starting composition ratios (in mol%): 45.5SiO2–40PbF2–10CdF2–0.5Er2O3–4Yb2O3 via the melting–annealing method. The GCs were then obtained from the prepared precursor glasses by thermal treatment for 8 h at 440 °C and then gradually cooled to room temperature. Subsequently, glacial acetic acid and NH4F in deionized water were mixed to give the etching agent. GC powder was then mixed thoroughly with the as-prepared etching agent and surface-modification agent 6AA with vigorous stirring. Finally, the obtained NCs were collected via centrifugation and washed twice with deionized water and ethanol, and dried in an oven at 80 °C for 3 h.Characterization
The X-ray diffraction (XRD) patterns of samples were measured using a powder diffractometer (D/Max-2500) using CuKα radiation. High-resolution transmission electron microscopy (HRTEM, 2100F, JEOL, Japan) was used to measure the morphology and size of the samples. Fourier transform infrared (FT-IR) spectra (4000–400 cm−1) were recorded for KBr pellets (Thermo Fisher Scientific, USA) containing a powder sample with a NICOLET IS50 FT-IR spectrometer. Raman spectra were measured using a RENISHAW InVia Raman microscope with an excitation laser wavelength of 785 nm. Transmission spectra were recorded using a Hitachi U-4100 UV-visible-NIR spectrophotometer. X-ray photoelectron spectroscopy (XPS) data were collected in an ion-pumped chamber of a photoelectron spectrometer (Kratos Axis-Ultra) equipped with an Al Kα (1486.6 eV) focused X-ray source. Zeta potential was measured with a Brookhaven Instruments ZetaPALS. Steady state UCL spectra were measured using an Edinburgh Instruments FLS920 spectrometer equipped with a 940 nm laser as an excitation source.Results and discussion
Morphology and structure
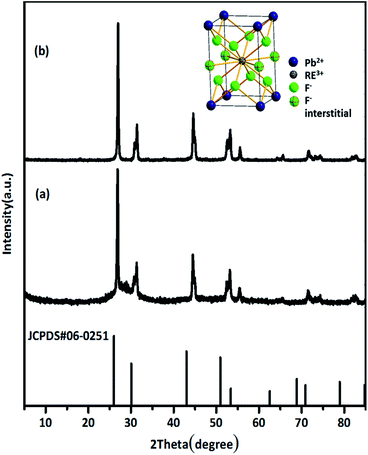
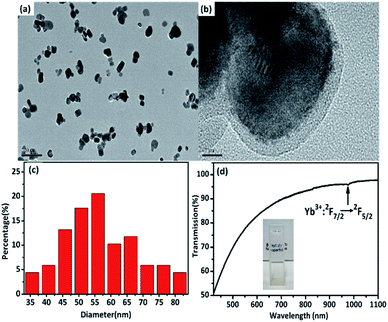
The GCs had high luminescence efficiency due to the rare earth ions preferentially precipitating from the glass precursor and being selectively incorporated into the fluoride microcrystals, which have low phonon energies.20 The structures of β-PbF2:Er3+/Yb3+ GCs and NCs were characterized by XRD. β-PbF2 has a typical cubic fluorite crystal structure. According to the previous work of the research group,21–23 rare earth ions replace Pb2+ by cation substitution and are compensated by F− interstitial charge. And at the thermal treatment temperature of 440 °C for 8 h, the glass can be completely crystallized and the crystallinity was the highest, the phase structure of rare earth doped PbF2 NCs was a tetragonal phase structure, as shown in the inset of Fig. 1. The XRD patterns of the GCs and the NCs released from the GCs were compared with the standard diffraction peaks of β-PbF2, as shown in Fig. 1(a) and (b). The XRD peak position of the RE3+ ion-doped GCs moved to a greater angle, indicating shrinkage of the β-PbF2 lattice and the incorporation of RE3+ ions into the β-PbF2 crystallite.24 While, the XRD patterns of the GCs and NCs released from GCs were similar, indicating that the NCs structure remained unchanged during etching.HRTEM images were used to characterize the morphology of Er3+/Yb3+ co-doped PbF2 NCs, shown in Fig. 2(a) and (b). It can be seen that the dispersion of NCs is good and the average diameter of the NCs is 56 nm. Moreover, it can be clearly seen that the surface of the NCs is modified by a layer of 6AA of approximately 10 nm in thickness. The obtained NCs were capped by the –COOH heads of the bifunctional 6AA molecules with the free –NH2 groups at the opposite end of the molecules being available for further dispersion in polar solvent.25 As is shown in Fig. 2(d), 6AA modified β-PbF2:Er3+/Yb3+ nanocrystalline solutions are largely transparent to visible light and the absorption peak corresponding to the Yb3+:2F7/2 → 2F5/2 transition located at 978 nm can be clearly identified. After adding 6AA, the stability of the solution clearly improved, and the zeta potential increased from +17.7 mV to +32.18 mV, which shows that the NCs have uniform particle size and good dispersion in aqueous solution. Meanwhile, the 6AA coated in the outer layer of NCs has no absorption in this wavelength range, as is shown in Fig. S1.† Therefore, it can effectively inhibit the energy transfer between RE3+ ions and biological tissues. The results show that the NCs maintained the phase structure of the GCs and that their surfaces were modified with the bifunctional 6AA ligand, making them potential candidates for biological application.
Etching and surface modification mechanism
A proposed etching and surface modification mechanism is shown in Fig. 3. A schematic diagram of the structure of the GCs, based on our previous work, is shown in Fig. 3(a).26 The central structure of the figure is a rare earth fluoride nanocrystal and the outermost layer is a silicon oxide layer, and the two are connected by an intermediate transition layer O–Pb–O bond. When etching occurs, HF generated by the hydrolysis of NH4F first etches SiO2 and CdO in the outer layer of the GCs, and then etches the transition layer. The exposed O in the O–Pb–O bond undergoes protonation to become O–Pb–OH. When the etch rate is slow, the contact time of O–Pb–OH with the –COOH group of 6AA is increased, which facilitates the cross-linking reaction of divalent metal ions and removes one water molecule.27 Thereafter, –COO– and Pb2+ are connected by electrostatic adsorption, preventing O–Pb–OOC– from continuing to react with the etchant.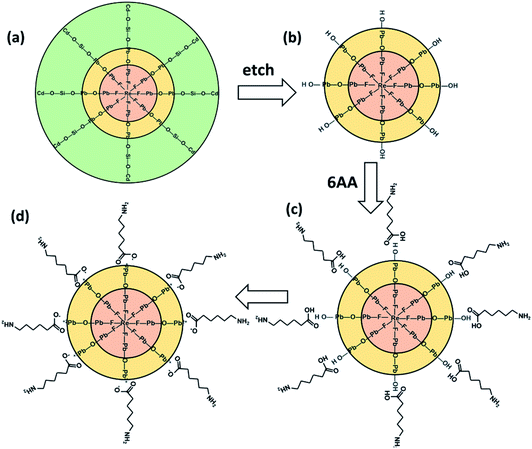 | ||
| Fig. 3 The schematic diagram of (a) the GCs; (b) the NCs after etching; (c) the NCs react with 6AA; (d) the NCs modified with 6AA. | ||
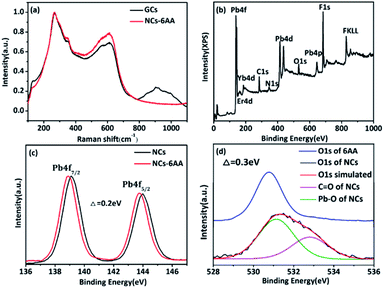
XPS and Raman spectroscopy were used to verify the etching and surface modification model. The Raman spectrum is shown in Fig. 4(a), the low frequency region of 200–400 cm−1 is attributed to the vibration of the fluoride,28 the peak at 256 cm−1 belonging to the Pb–F bond vibration, and the vibration at 500–700 cm−1 is attributed to the vibration of the Re–F bond.29 The vibration at 800–1200 cm−1 arises as a result of the vibration of the Si–O–Si bond.30 After etching, the Raman vibration peak of Pb–F at 256 cm−1 was still detected, indicating that rare earth doped lead fluoride NCs were preserved. While the vibration peak of the Si–O–Si bond at 800–1200 cm−1 was no longer detected, indicating that the silicon oxide of the glass ceramic was completely etched. The XPS spectrum in Fig. 4(b) shows the presence of Pb, F, Er, Yb, C, O, and N. And the high-resolution O 1s, C 1s, and N 1s XPS spectra are shown in Fig. S2.† The peaks at 531.1 eV and 532.1 eV correspond to the characteristic peaks of C![[double bond, length as m-dash]](https://www.rsc.org/images/entities/char_e001.gif) O and Pb–O, respectively.31,32 The peaks at 284.56 eV, 285.99 eV, and 288.18 eV correspond to the C–C, C–N, and C–C
O and Pb–O, respectively.31,32 The peaks at 284.56 eV, 285.99 eV, and 288.18 eV correspond to the C–C, C–N, and C–C![[double bond, length as m-dash]](https://www.rsc.org/images/entities/char_e001.gif) O,25,33 respectively. While the peaks at 399.96 eV and 400.78 eV correspond to the characteristic peaks of N–H and N–C, respectively.34 The XPS spectra indicate that 6AA was present on the surface of the nanocrystal. Fig. 4(c) and (d) shows the high-resolution Pb4f XPS spectra of the NCs before and after modification with 6AA and high-resolution O 1s XPS spectra of pure 6AA. The results show that after being capped with 6AA, the binding energy of Pb 4f moved to lower energy, while the binding energy of C
O,25,33 respectively. While the peaks at 399.96 eV and 400.78 eV correspond to the characteristic peaks of N–H and N–C, respectively.34 The XPS spectra indicate that 6AA was present on the surface of the nanocrystal. Fig. 4(c) and (d) shows the high-resolution Pb4f XPS spectra of the NCs before and after modification with 6AA and high-resolution O 1s XPS spectra of pure 6AA. The results show that after being capped with 6AA, the binding energy of Pb 4f moved to lower energy, while the binding energy of C![[double bond, length as m-dash]](https://www.rsc.org/images/entities/char_e001.gif) O in O 1s moved towards higher energy, indicating that the capping with 6AA proceeds through the electron between Pb2+ and –COO–,32 which supports the proposed etching and surface modification model. The etching and surface modification mechanism is also applicable to other amphiphilic amino acid functional ligands.
O in O 1s moved towards higher energy, indicating that the capping with 6AA proceeds through the electron between Pb2+ and –COO–,32 which supports the proposed etching and surface modification model. The etching and surface modification mechanism is also applicable to other amphiphilic amino acid functional ligands.
Up-conversion luminescence and temperature sensing behavior
Yb3+ is often used as a sensitizer excited using a 980 nm laser because of its simple energy level structure, large absorption cross section of 980 nm laser light, and high energy transfer efficiency to Er3+, Tm3+, Nd3+, and Ho3+.35,36 However, the water molecules in the living body strongly absorb 980 nm laser light. The absorption coefficient of water at 980 nm is ∼0.485 cm−1.37 According to the Beer–Lambert law, when 980 nm light propagates 1 cm in water, up to 61% of the light energy is absorbed by the water. Studies have shown that at a laser power density of ∼7.6 W cm−2, the temperature of the water rises by ∼18 °C after 15 min of irradiation.38 This thermal effect can induce cell and tissue damage and affect the accuracy of temperature measurement.39 To prevent thermal damage to the organism by the 980 nm laser, a 940 nm laser was used as the excitation source.Fig. 5 shows the up-conversion luminescence spectrum of β-PbF2:Er3+/Yb3+ NCs in aqueous solution under 940 nm laser excitation. Using the melting–annealing method, rare earth ions can be doped into crystallites with low phonon energy by body-doping and the luminescence efficiency is higher. The spectrum shows two characteristic emission bands for green light at 521 and 540 nm and red light at 660 nm, resulting from the 2H11/2 → 4S3/2, 4I15/2, and 4F9/2 → 4I15/2 energy level transitions of Er3+, respectively.
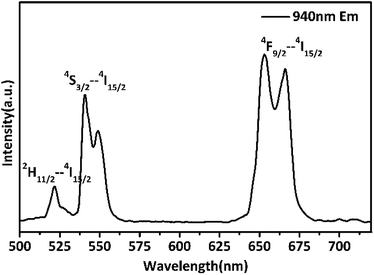 | ||
| Fig. 5 The up-conversion luminescence spectrum of 6AA capped β-PbF2:Er3+/Yb3+ NCs in aqueous solution under 940 nm laser excitation. | ||
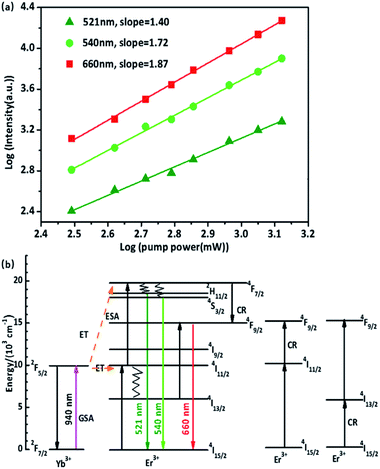
Up-conversion luminescence is a multiphoton absorption process. The relationship between the up-conversion luminescence intensity and pump power is: Iem ∝ (Ppump)n, where Iem is the up-conversion luminescence intensity, Ppump is the excitation optical pump power, and n is the number of pump photons populated to the upper level.40 Taking the logarithm of both sides, the relationship between lg![[thin space (1/6-em)]](https://www.rsc.org/images/entities/char_2009.gif) Iem and lg
Iem and lg![[thin space (1/6-em)]](https://www.rsc.org/images/entities/char_2009.gif) Ppump is obtained, which gives the P–I curve, and the slope of the curve is the value of n. The P–I curve of the nanocrystal solution is shown in Fig. 6(a), and the slopes at 521, 540, and 660 nm were approximately 1.40, 1.72, and 1.87, respectively. The results show that red and green up-conversion emission are both two-photon up-conversion processes under 940 nm excitation.
Ppump is obtained, which gives the P–I curve, and the slope of the curve is the value of n. The P–I curve of the nanocrystal solution is shown in Fig. 6(a), and the slopes at 521, 540, and 660 nm were approximately 1.40, 1.72, and 1.87, respectively. The results show that red and green up-conversion emission are both two-photon up-conversion processes under 940 nm excitation.
A possible up-conversion mechanism for the investigated system is proposed and illustrated in Fig. 6(b) based on the results mentioned above. Under 940 nm excitation, the electrons of the Yb3+ ion are excited from the 2F7/2 level to the 2F5/2 level through ground-state absorption (GSA). Then, the excited Yb3+ ions donate as-absorbed energy to adjacent Er3+ ions and the Er3+ ions are excited from the 4I15/2 level to the 4I11/2 level. A second 940 nm photon transferred by the adjacent Yb3+ ions can excite Er3+ ions from the 4F11/2 to 4F7/2 level by the two photons process, and finally through nonradiative relaxations to 2H11/2, 4S3/2, emitting 521 nm and 540 nm photons, respectively. This is the up-conversion luminescence mechanism of green emission. There are four possible mechanisms for the red emission: (i) from 2H11/2/4S3/2 through nonradiative relaxations to 4F9/2, the energy level difference between the two energy levels is 3200 cm−1, which is approximately 14 phonons energy of β-PbF2. It is generally thought that this is non-radiative relaxation, however, after coating with 6AA, the phonon energy of the surface groups is ∼3350 cm−1, as shown in Fig. S1,† which matches the difference between 2H11/2/4S3/2 and 4F9/2, therefore a 660 nm photon is emitted. (ii) The electrons of the Yb3+ are excited from the 2F7/2 level to the 2F5/2 level through ground-state absorption (GSA), and the Yb3+ ion transfers energy to the Er3+ ion, causing Er3+ to be excited from the 4I15/2 level to the 4I11/2 level. Since the 4I13/2 energy level has a long lifetime and the energy level difference matches the phonon energy of the 6AA surface group, some of the photons relax to 4I13/2. The electrons in the 4I13/2 level are excited to the 4F9/2 level by absorbing the energy transferred by the Yb3+ ion or the GSA, and then return to the ground state 4I15/2, emitting a 660 nm photon. (iii) and (iv) The electrons in the 4F7/2 energy level relax to the 4F9/2 level by cross-relaxation with the adjacent Er3+ ions. Subsequently, radiative transfer from the 4F9/2 to 4I15/2 levels results in red emission.
The up-conversion emission spectrum of the sample in the wavelength range 500–720 nm at different temperatures under 940 nm irradiation is presented in Fig. 7, the pump power of the 940 nm laser was set at 120 mW mm−2. 2H11/2 and 4S3/2 are the thermal coupling levels. of Er3+, and the number of particles at this level obeys the Boltzmann particle distribution. The intensity of the emitted fluorescence is proportional to the number of particles in the energy level, therefore the FIR emitted by the thermal coupling level can be given as follows:29
 | (1) |
 | (2) |
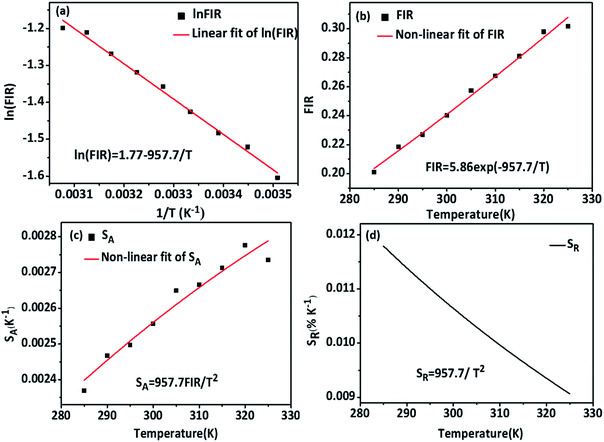
![[thin space (1/6-em)]](https://www.rsc.org/images/entities/char_2009.gif) B = 1.77, respectively. The change in fluorescence intensity ratio with temperature can be fitted by eqn (2), and the fitting results are shown in Fig. 8(a) and (b).
B = 1.77, respectively. The change in fluorescence intensity ratio with temperature can be fitted by eqn (2), and the fitting results are shown in Fig. 8(a) and (b).
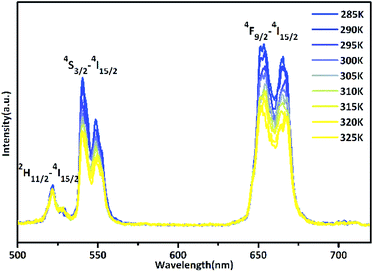 | ||
| Fig. 7 Temperature dependent spectrum of Er3+ green and red emissions of 6AA capped β-PbF2:Er3+/Yb3+ nanocrystalline solution. | ||
Sensitivity and resolution are important parameters for the application of the system as an optical temperature sensor. Sensitivity is used to characterize the fluorescence intensity ratio as a function of temperature. Absolute sensitivity SA and relative sensitivity SR are defined as:48,49
 | (3) |
 | (4) |
Based on the above formulas, the absolute sensitivity SA and relative sensitivity SR of β-PbF2:Er3+/Yb3+ nanocrystals are shown in Fig. 8(c) and (d), and the maximum values were 0.0027 K−1 (325 K) and 1.18% K−1 (285 K), respectively. The temperature resolution (δT) is used to characterize the smallest temperature change that can be detected and depends on the system performance (given by the relative sensitivity) and experimental setup. δT is calculated using the following equation:49,50
 | (5) |
 | (6) |
 is the average of the FIR, obtained by five times measurement of one sample at each temperature, and herein n = 5. Corresponding to the relative sensitivity of each temperature, we calculate the resolution at each temperature and the averaged resolution is about 0.25 K. Compared to the other optical thermometers based on fluorescence intensity ratio of green emission from the transitions of TCLs (2H11/2/4S3/2) of Er3+ is listed in Table 1. The high sensitivity and resolution indicate that β-PbF2:Er3+/Yb3+ nanocrystals have potential for use as a nano-fluorescence temperature sensor.
| Material | Temperature range (K) | λex (nm) | SRmax (% K−1) | SAmax (10−3 K−1) | δT (K) | Ref. |
|---|---|---|---|---|---|---|
| GdVO4:Er3+/Yb3+ | 297–343 | 980 | 0.94 | 10.1 | 0.4 | 41 |
| β-NaLuF4:Yb3+, Tm3+, Er3+ | 300–600 | 980 | 7.7 | 42 | ||
| NaZnPO4:Er3+/Yb3+ GCs | 303–753 | 980 | 1.329 | 5.7 | 43 | |
| Fluoride glass:Er3+/Yb3+ | 335–375 | 975 | 1.1 | 0.87 | 0.8 | 44 |
| Silica glass:Er3+/Yb3+ | 296–723 | 978 | 1.09 | 3.3 | 0.2 | 45 |
| Ca5(PO4)3F:Er3+/Yb3+ GCs | 298–798 | 980 | 1.35 | 5.19 | 46 | |
| NaYF4:Er3+/Yb3+ | 299–336 | 920 | 1.0 | 47 | ||
| Borophosphate:Er3+/Yb3+ | 298–798 | 980 | 1.66 | 4.5 | 48 | |
| β-PbF2:Er3+/Yb3+ NCs | 285–325 | 940 | 1.18 | 2.7 | 0.25 | This work |
Conclusions
β-PbF2:Er3+/Yb3+ NCs modified with 6AA were prepared by etching the glass matrix of GCs and modified with bifunctional 6AA ligands. The NCs were largely transparent and stable in aqueous solution. Under the excitation of a 940 nm laser the NCs displayed efficient green and red emission without requiring 980 nm laser excitation, which has a heating effect on living organisms. The fluorescence intensity ratio of green emission from the transitions of TCLs (2H11/2/4S3/2) of Er3+ were used for biological temperature sensing based on the FIR technique and we obtained high sensitivity and resolution in the biological temperature range. The described results indicate that the β-PbF2:Er3+/Yb3+ NCs modified with 6AA are promising candidates for use as accurate optical temperature sensors in the biomedical field.Conflicts of interest
There are no conflicts to declare.Acknowledgements
This work was supported by the National Natural Science Foundation of China (No. 11574164 and No. 31870158), 111 Project (No. B07013) and National Science Fund for Talent Training in the Basic Sciences (No. J1103208).Notes and references
- X. D. Wang, O. S. Wolfbeis and R. J. Meier, Chem. Soc. Rev., 2013, 42, 7834–7869 RSC.
- X. Wang, Q. Liu, Y. Bu, C. S. Liu, T. Liu and X. Yan, RSC Adv., 2015, 5, 86219–86236 RSC.
- L. Michalski, K. Eckersdorf, J. Kucharski and J. McGhee, Temperature Measurement, Wiley, United States, 2nd edn, 2002 Search PubMed.
- N. W. Ashcroft and D. N. Mermin, Phys. Today, 1977, 30, 61–65 CrossRef.
- R. Bogue and J. Newman, Sens. Rev., 2007, 27, 86–90 CrossRef.
- L. Guo, W. Dong and S. Zhang, RSC Adv., 2014, 4, 41956–41967 RSC.
- N. Armaroli and V. Balzani, Energy Environ. Sci., 2011, 4, 3193–3222 RSC.
- C. Gunawan, M. Lim, C. P. Marquis and R. Amal, J. Mater. Chem. B, 2014, 2, 2060–2083 RSC.
- D. Jaque and F. Vetrone, Nanoscale, 2012, 4, 4301–4326 RSC.
- H. S. Mader, P. Kele, S. M. Saleh and O. S. Wolfbeis, Curr. Opin. Chem. Biol., 2010, 14, 582–596 CrossRef CAS PubMed.
- D. E. Achatz, R. Ali and O. S. Wolfbeis, Top. Curr. Chem., 2011, 300, 29 CrossRef CAS PubMed.
- J. Zhou, Z. Liu and F. Y. Li, Chem. Soc. Rev., 2012, 41, 1323–1349 RSC.
- M. Nag, K. D. Paris and J. E. Fogle, Viruses, 2018, 10, 227 CrossRef PubMed.
- M. Mori, L. Kovalenko, S. Lyonnais, D. Antaki, B. E. Torbett, M. Botta, G. Mirambeau and Y. Mély, Curr. Top. Microbiol. Immunol., 2015, 389, 53 CAS.
- H. Qiu, L. Sun, S. Tan, Y. Sun, S. Hao, Y. Yu, W. Lu, S. Ge and C. Yang, J. Nanosci. Nanotechnol., 2011, 11, 7700 CrossRef CAS PubMed.
- H. P. Zhou, C. H. Xu, W. Sun and C. H. Yan, Adv. Funct. Mater., 2010, 19, 3892–3900 CrossRef.
- A. Hlaváček, A. Sedlmeier, P. Skládal and H. H. Gorris, ACS Appl. Mater. Interfaces, 2014, 6, 6930 CrossRef PubMed.
- H. Chang, J. Xie, B. Zhao, B. Liu, S. Xu, R. Na, X. Xie, H. Ling and H. Wei, Nanomaterials, 2015, 5, 1–25 CrossRef PubMed.
- F. C. Meldrum and C. L. Helmut, Chem. Rev., 2008, 108, 4332–4432 CrossRef CAS PubMed.
- Y. Wang and J. Ohwaki, Appl. Phys. Lett., 1998, 63, 3268–3270 CrossRef.
- N. Hu, H. Yu, M. Zhang, P. Zhang, Y. Z. Wang and L. J. Zhao, Phys. Chem. Chem. Phys., 2011, 13, 1499–1505 RSC.
- J. Ge, L. J. Zhao, H. Guo, Z. J. Lan and H. Yu, Phys. Chem. Chem. Phys., 2013, 15, 17281–17286 RSC.
- H. Yu, K. D. Zhou, K. Chen, J. Song, C. X. Hou and L. J. Zhao, J. Non-Cryst. Solids, 2008, 354, 3649–3652 CrossRef CAS.
- V. K. Tikhomirov, D. Furniss, A. B. Seddon, I. M. Reaney, M. Beggiora, M. Ferrari, M. Montagna and R. Rolli, Appl. Phys. Lett., 2002, 81, 1937–1939 CrossRef CAS.
- T. D. Nguyen, D. Mrabet and C. T. Dinh, CrystEngComm, 2011, 13, 1450–1460 RSC.
- M. Liu, L. J. Zhao, Y. Liu, Z. J. Lan, L. F. Chang, Y. M. Li and H. Yu, J. Mater. Sci. Technol., 2014, 30, 1213–1216 CrossRef CAS.
- T. Sugama, L. E. Kukacka and N. Carciello, J. Mater. Sci., 1984, 19, 4045–4056 CrossRef CAS.
- P. McMillan and B. Piriou, J. Non-Cryst. Solids, 1983, 55, 221–242 CrossRef CAS.
- W. R. Wilmarth, G. M. Begun, S. E. Nave and J. R. Peterson, J. Chem. Phys., 1998, 89, 711 CrossRef.
- S. A. Brawer and W. B. White, J. Chem. Phys., 1975, 63, 2421 CrossRef CAS.
- S. W. Han, S. W. Joo, T. H. Ha, Y. Kim and K. Kim, J. Chem. Phys., 2000, 104(50), 11987–11995 CrossRef CAS.
- X. Zhao, Y. Wang, Y. Li, W. Xue, J. Li, H. Wu, Y. Zhang, B. Li, W. Liu, Z. Gao and H. Huang, J. Chem. Eng. Data, 2019, 64(6), 2728–2735 CrossRef CAS.
- L. Zhang, F. Song, Y. Wu, L. Cheng, J. Qian, S. Wang, Q. Chen and Y. Li, J. Chem. Eng. Data, 2019, 64, 176–188 CrossRef CAS.
- C. Jin, X. Zhang, J. Xin, G. Liu and Z. Kong, Ind. Eng. Chem. Res., 2018, 57, 7872–7880 CrossRef CAS.
- F. Wang and X. G. Liu, Chem. Soc. Rev., 2009, 38, 976–989 RSC.
- S. Wen, J. Zhou, K. Zheng, A. Bednarkiewicz, X. Liu and D. Jin, Nat. Commun., 2018, 9(1), 2415 CrossRef PubMed.
- M. J. Weber, Phys. Rev. B: Condens. Matter Mater. Phys., 1971, 4, 3153–3159 CrossRef.
- Q. Shao, Z. Yang, G. Zhang, Y. Hu and J. Jiang, ACS Omega, 2018, 3, 188–197 CrossRef CAS PubMed.
- Z. Qiuqiang, Q. Jun, L. Huijuan, S. Gabriel, W. Dan, H. Sailing, Z. Zhiguo and A. E. Stefan, ACS Nano, 2011, 5, 3744–3757 CrossRef PubMed.
- M. Pollnau, D. R. Gamelin, S. R. Lüthi, H. U. Güdel and M. P. Hehlen, Phys. Rev. B: Condens. Matter Mater. Phys., 2000, 61, 3337–3346 CrossRef CAS.
- O. Savchuk, J. J. Carvajal, C. Cascales, M. Aguilo and F. Diaz, ACS Appl. Mater. Interfaces, 2016, 8, 7266–7273 CrossRef CAS PubMed.
- H. Lu, H. Hao, G. Shi, Y. Gao, R. Wang, Y. Song, Y. Wang and X. Zhang, RSC Adv., 2016, 6, 55307 RSC.
- Y. Chen, G. H. Chen, X. Y. Liu and T. Yang, J. Lumin., 2018, 195, 314–320 CrossRef CAS.
- E. Saïdi, B. Samson, L. Aigouy, S. Volz, P. Löw, C. Bergaud and M. Mortier, Nanotechnology, 2009, 20, 115703 CrossRef PubMed.
- C. Li, B. Dong, S. Li and C. Song, Chem. Phys. Lett., 2007, 443, 426–449 CrossRef CAS.
- X. Liu, Y. Chen, F. Shang, G. Chen and J. Xu, J. Mater. Sci.: Mater. Electron., 2019, 30, 5718–5725 CrossRef CAS.
- F. Vetrone, R. Naccache, A. Zamarrón, A. Juarranz de la Fuente, F. Sanz-Rodríguez, L. Martinez Maestro, E. Martín Rodriguez, D. Jaque, J. García Solé and J. A. Capobianco, ACS Nano, 2010, 4, 3254–3258 CrossRef CAS PubMed.
- S. A. Wade, S. F. Collins and G. W. Baxter, J. Appl. Phys., 2003, 94, 4743–4756 CrossRef CAS.
- S. Uchiyama, T. Tsuji, K. Ikado, A. Yoshida, K. Kawamoto, T. Hayashi and N. Inada, Analyst, 2015, 140, 4498–4506 RSC.
- C. D. S. Brites, A. Millán and L. D. Carlos, Handb. Phys. Chem. Rare Earths, 2016, 49, 339–427 Search PubMed.
Footnote |
| † Electronic supplementary information (ESI) available. See DOI: 10.1039/c9ra08447a |
| This journal is © The Royal Society of Chemistry 2019 |

