 Open Access Article
Enhancement of NH3-SCR performance of LDH-based MMnAl (M = Cu, Ni, Co) oxide catalyst: influence of dopant M†
Yali Du‡
a,
Lili Liu‡b,
Yalin Fengb,
Baoshuan Yang b and
Xu Wu
 *b
*b
aCollege of Chemistry and Chemical Engineering, Jinzhong University, Jinzhong, 030619, PR China. E-mail: dyl0037@163.com
bCollege of Chemistry and Chemical Engineering, Taiyuan University of Technology, Taiyuan 030024, PR China. E-mail: wuxu@tyut.edu.cn; Tel: +86-351-6018528
First published on 2nd December 2019
Abstract
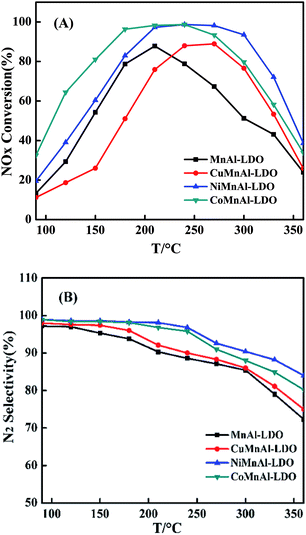
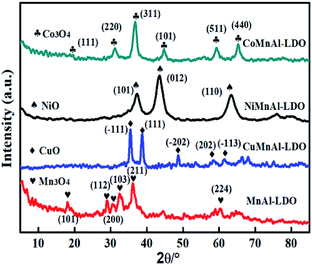
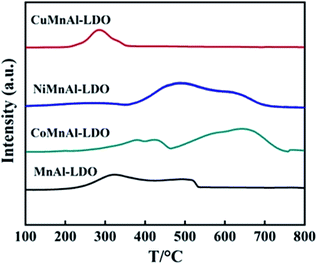
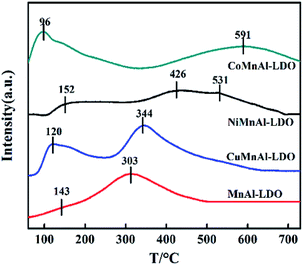
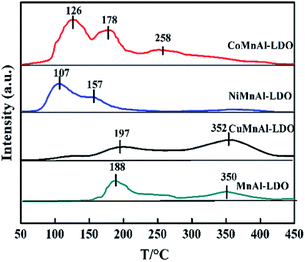
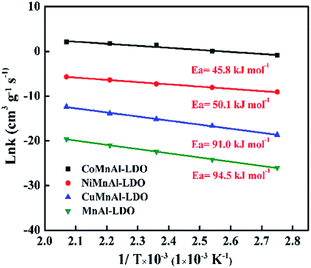
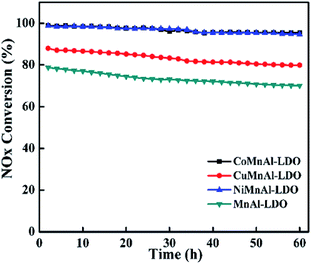
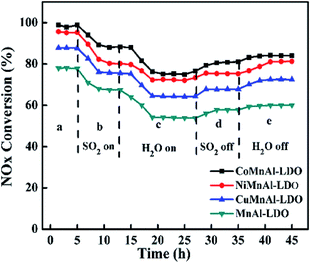
Transition metal (Cu, Ni, Co) doped MnAl mixed oxide catalysts were prepared through a novel method involving the calcination of hydrotalcite precursors for the selective catalytic reduction of NOx with NH3 (NH3-SCR). The effects of transition metal modification were confirmed by means of XRD, BET, TEM, XPS, NH3-TPD, and H2-TPR measurements. Experimental results evidenced that CoMnAl-LDO presented the highest NOx removal efficiency of over 80% and a relatively high N2 selectivity of over 88% in a broad working temperature range (150–300 °C) among all the samples studied. Moreover, the CoMnAl-LDO sample possessed better stability and excellent resistance to H2O and SO2. The reasons for such results could be associated with the good dispersion of Co3O4 and MnOx, which could consequently provide optimum redox behavior, plentiful acid sites, and strong NOx adsorption ability. Furthermore, dynamics calculations verified the meaningful reduction in apparent activation energy (Ea) for the CoMnAl-LDO sample, which is in agreement with the DeNOx activity.
1. Introduction
Nitric oxide (NOx), which is mainly generated from stationary and automotive sources, has definitely given rise to many problems for the environment and has resulted in health concerns for humans.1–3 With gradually tightening regulations on NOx emission limits, post-treatment of nitrogen oxides has become one of the most important research challenges the world faces today in the environmental domain. Currently, selective catalytic reduction (SCR) has been put into wide commercial utilization to abate NOx.4–6 Most practical catalysts in the SCR system are vanadium-based catalysts that must be installed upstream of dedusting and desulfurization to satisfy their optimal operating temperature of 300–400 °C or the catalysts could be poisoned by high concentrations of dust particles and sulfur-containing ammonium salts.7–9 In this situation, it is necessary to develop low-temperature and environmentally friendly catalysts which can efficiently work in the downstream and avoid those problems mentioned above.Mn-based DeNOx catalysts have been extensively explored in the low-temperature NH3-SCR field due to their unique redox properties, as they are sensitive to H2O and SO2.10,11 To overcome these issues, transition metals have been introduced to Mn-based catalysts to modulate their redox ability and acid sites.12–14 For example, Qiu successfully designed MnxCo3−xO4 nanoparticles through nanocasting, which presented superior catalytic performance to bulk MnCo2O4 synthesized through the co-precipitation method.15
In recent years, calcined layered double hydroxides (LDHs) have shown potential use as catalysts for several reasons, such as the possibility of tuning the composition in wide scope, their high surface areas and homogenous distribution of introduced cations.16–18 In addition, Al was proved to be of great necessity to enhance the self-stability of the LDH materials. From LDH precursors, Yan et al.19 prepared Cu0.5Mg1.5Mn0.5Al0.5Ox, which presented superior catalytic performance in a wide temperature range compared to Mn/γ-Al2O3 prepared by conventional methods. This method might enable good dispersion of the active metal species to provide strong internal interactions for the Cu0.5Mg1.5Mn0.5Al0.5Ox catalyst.
Based on the abovementioned points, using LDHs own innate advantages to accomplish the effective doping of transition metal into MnAl oxides could facilitate DeNOx performances. Herein, Cu-, Ni- or Co-doped MnAl mixed metal oxide catalysts were investigated for NH3-SCR at low temperatures, taking into account the characterization results of XRD (X-ray diffraction), BET (Brunauer–Emmett–Teller), XPS (X-ray photoelectron spectroscopy), NH3-TPD (NH3-temperature programmed desorption), H2-TPR (H2-temperature programmed reduction), NO + O2-TPD (NO + O2-temperature programmed desorption), etc. The addition of Co into MnAl oxide is proposed to dramatically increase its catalytic ability and behaviour, as CoMnAl-LDO presented preferable DeNOx activity (over 80% NO conversion) and N2 selectivity in a broad working temperature window (150–300 °C). In addition, the CoMnAl-LDO sample possessed better stability and excellent resistance to H2O and SO2 at 240 °C.
2. Experimental section
2.1 Preparation of MMnAl-LDO (M = Cu, Ni, Co)
The MMnAl-LDH (M = Cu, Ni, and Co) materials were prepared by co-precipitation method. 50% Mn(NO3)2, Al(NO3)3·9H2O and Cu(NO3)2·3H2O (or Ni(NO3)2·6H2O, Co(NO3)2·6H2O) were dissolved in deionized water, in which the molar ratios of M2+ to Mn2+ and M2+ to M3+ were 3![[thin space (1/6-em)]](https://www.rsc.org/images/entities/char_2009.gif) :
:![[thin space (1/6-em)]](https://www.rsc.org/images/entities/char_2009.gif) 1 and 4
1 and 4![[thin space (1/6-em)]](https://www.rsc.org/images/entities/char_2009.gif) :
:![[thin space (1/6-em)]](https://www.rsc.org/images/entities/char_2009.gif) 1 (M2+/Mn2+ = 3 and M2+/M3+ = 4
1 (M2+/Mn2+ = 3 and M2+/M3+ = 4![[thin space (1/6-em)]](https://www.rsc.org/images/entities/char_2009.gif) :
:![[thin space (1/6-em)]](https://www.rsc.org/images/entities/char_2009.gif) 1), respectively. Then, the above aqueous solution was added into 1 mol l−1 NaOH solution with vigorous stirring. In order to avoid oxidation of M2+, N2 was injected during the whole aging process. The pH of the solution was kept at 9–10. The resulting slurry was transferred into a reaction vessel for about 6 h at 60 °C. Finally, MMnAl-LDH (M = Cu, Ni, and Co) materials were obtained by drying at 60 °C overnight in an oven. After being calcined at 500 °C for 5 h at a rate of 2 °C min−1 in air, diverse mixed metal oxides were prepared which were labelled CuMnAl-LDO, NiMnAl-LDO and CoMnAl-LDO. Meanwhile, the MnAl-LDH and corresponding MnAl-LDO were prepared by a similar method.
1), respectively. Then, the above aqueous solution was added into 1 mol l−1 NaOH solution with vigorous stirring. In order to avoid oxidation of M2+, N2 was injected during the whole aging process. The pH of the solution was kept at 9–10. The resulting slurry was transferred into a reaction vessel for about 6 h at 60 °C. Finally, MMnAl-LDH (M = Cu, Ni, and Co) materials were obtained by drying at 60 °C overnight in an oven. After being calcined at 500 °C for 5 h at a rate of 2 °C min−1 in air, diverse mixed metal oxides were prepared which were labelled CuMnAl-LDO, NiMnAl-LDO and CoMnAl-LDO. Meanwhile, the MnAl-LDH and corresponding MnAl-LDO were prepared by a similar method.
2.2 Catalyst characterization
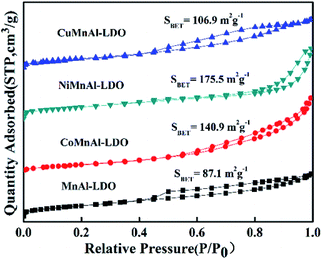
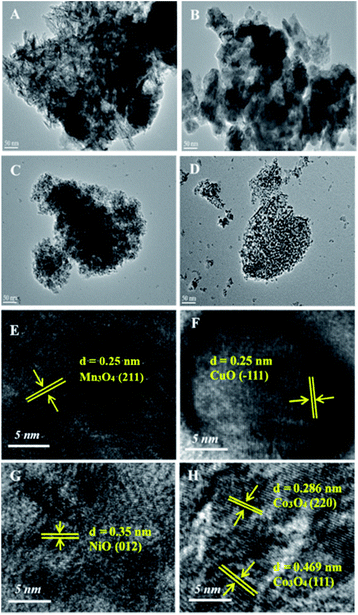
The X-ray diffraction (XRD) patterns for pristine hydrotalcites and corresponding mixed metal oxides were tested with a Rigaku D/max-2500 diffractometer with a Cu/Kα radiation source. The operating range for 2θ was from 5 to 85° and the scanning rate was 8° min−1. FT-IR experiments were carried out on an FTS 3000 MX FT-IR (Bruker Vertex70) spectrophotometer. The morphologies of the obtained hydrotalcites were measured by an SU8010 SEM apparatus with an accelerating voltage of 200 kV. TEM was carried out on a JEM 2100F transmission electron microscope. The TGA was performed on a Q50 TGA analyzer equipped with a quadrupole mass spectrometer (QMS). The range of testing temperature was from room temperature to 900 °C in flowing Ar (80 mL min−1) at the heating rate of 10 °C min−1. The surface areas for hydrotalcite-derived mixed oxides were obtained via the BET method. The operating instrument was a Micromeritics ASAP-2020 which needs −196 °C liquid nitrogen during operation. In addition, the t-plot approach was used to analyze the total pore volume and the pore size distributions were analyzed by BJH (Barrett–Joyner–Halenda) method. H2-TPR was performed in a TP-5080 instrument. A U-shaped quartz reactor is filled with 80 mg catalyst (40–60 mesh). Before operation, the samples were activated at 300 °C for 1 h under Ar flow. Next, the temperature of the catalyst was decreased to room temperature. Then the catalyst was heated to 800 °C with a ramping rate of 10 °C min−1 in 5% H2/Ar (30 mL min−1) and data were collected during the process. For NH3-TPD, the amount of catalyst and the initial activation process were the same as H2-TPR. Next, unlike the H2-TPR, the catalyst was exposed to NH3 at 50 °C for 1 h, followed by removing unstably adsorbed species by blowing He for 30 min. Then, the desorption process of NH3 was performed with the temperature of the reactor rising to 750 °C at a rate of 10 °C min−1. NO + O2-TPD experiments were operated on a fixed bed reactor self-assembled in the laboratory. First, the catalyst was pre-treated at 300 °C under N2 flow for 1 h. Then, adsorption of 5 vol% O2 and 500 ppm NO was implemented at 50 °C for 1 h, followed by physical removal of adsorbed NOx with N2 for 0.5 h. Finally, the temperature of samples was raised from 50 to 400 °C with an ascending rate of 10 °C min−1 under N2 flow. A Thermo Fisher IS10 FTIR was used to record the concentrations of NOx for the inlet and outlet gases. XPS analysis was carried out on an ESCALab 250 electron spectrometer (Thermo Scientific Corporation) in which the Al Kα radiation source (1486.6 eV) was adopted at 15 kW accelerating power. In order to compensate for the charge effect of catalysts, the C 1s peak of 284.6 eV was used to calibrate all binding energies (BE) of catalysts. The in situ DRIFT spectra were carried out on a Nicolet 6700 instrument produced by the Simefei company and equipped with a liquid nitrogen-cooled MCT detector with 4 cm−1 resolution. Before each measurement, the sample was pre-treated under N2 atmosphere for 30 min (300 °C) and then cooled to 50 °C while the background was recorded. Subsequently, 500 ppm NO + 5% vol. O2 was introduced into the cell and the DRIFT spectra were recorded. The final spectra were obtained after NO + O2 co-adsorption for 30 min and purging with N2 for another 10 min.2.3 Catalytic activity test
The activity testing was performed in fixed-bed reactor. A quartz reactor was filled with 0.3–0.4 g catalysts (40–60 mesh). A model flue gas (500 ppm NH3, 500 ppm NO, 5 vol% O2, 0 or 100 ppm SO2, 0 or 10 vol% H2O, and N2 as equilibrium gas) was used in all experiments. During the process, the flow rate was 187 cm3 min−1 and the gas hourly space velocity (GHSV) was 45![[thin space (1/6-em)]](https://www.rsc.org/images/entities/char_2009.gif) 000 h−1. A Thermo Fisher IS10 FTIR was used to record the concentrations of NOx for the inlet and outlet gases every 10 min in the temperature range of 90–360 °C.
000 h−1. A Thermo Fisher IS10 FTIR was used to record the concentrations of NOx for the inlet and outlet gases every 10 min in the temperature range of 90–360 °C.
The NOx conversion and N2 selectivity were separately calculated basing on the following formulas:
where the inlet concentrations of NO, NO2 and NH3 were labelled [NO]in, [NO2]in and [NH3]in, respectively, and the outlet concentrations of NO, NO2 and N2O were labelled [NO]out, [NO2]out and [N2O]out, respectively.
2.4 Kinetic test
The feed-gas mixture is the same as in the above activity test. In order to eliminate the diffusion effect, experiments were performed with different particle sizes and different flow rates. For the NH3-SCR model reaction, the apparent activation energies (Ea) for these catalysts were acquired from the following formula:where the reaction rate constant (cm3 g−1 s−1), the pre-exponential factor (cm3 g−1 s−1), the standard gas constant (J mol−1 K−1), and the reaction temperature (K) were respectively labelled as k, A, R, and T.
The reaction rate constant (k) as a function of NO conversion (%) can be calculated through the formula below:
3. Results and discussion
3.1 The structure characterization of catalysts
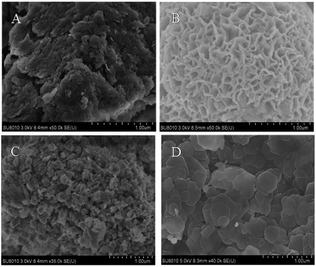
For unaltered MnAl-LDH, the agglomeration body was especially apparent, although there existed sheets on the surface of catalyst. After introducing the transition metal, the agglomeration was effectively improved. Surprisingly, the CoMnAl-LDH presented very thin and regular hexagonal platelets which were in favour of the gas–solid heterogeneous catalytic reactions.21 For NiMnAl-LDH, the nanoplatelets were the same as CoMnAl-LDH, but the stacking was a little disordered. CuMnAl-LDH had similar “flower-like” shapes, consisting of very thick nanoplatelets.
3.2 SCR performance of the MMnAl mixed oxide catalysts
3.3 Structure–property correlation
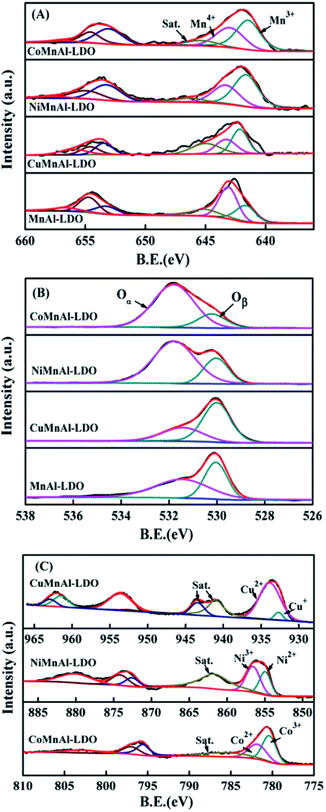 | ||
| Fig. 8 XPS results of (A) Mn 2p, (B) O 1s, and (C) Cu 2p, Ni 2p, and Co 2p for MnAl-LDO, CuMnAl-LDO, NiMnAl-LDO and CoMnAl-LDO. | ||
| Catalysts | Mn 2p | O 1s | Cu 2p | Ni 2p | Co 2p |
|---|---|---|---|---|---|
| Mn4+/Mn3+ | Oα/Oβ | Cu2+/Cu+ | Ni3+/Ni2+ | Co3+/Co2+ | |
| MnAl-LDO | 1.66 | 1.10 | — | — | — |
| CuMnAl-LDO | 0.62 | 0.68 | 12.04 | — | — |
| NiMnAl-LDO | 0.67 | 2.77 | — | 1.38 | — |
| CoMnAl-LDO | 0.75 | 3.70 | — | — | 1.47 |
Fig. 8(B) shows the XPS spectra of O 1s, which can be fitted into two characteristic peaks at 530.1 eV and 531.7 eV respectively belonging to lattice oxygen and chemisorbed oxygen, hereafter termed Oβ and Oα. From Table 1, it can be clearly observed that the Oα/Oβ ratio on the surface of the CoMnAl-LDO catalyst was higher than those of the other catalysts. The Oα, with higher mobility, is more conductive to oxidation reactions,36 which can enhance the DeNOx activity of CoMnAl-LDO catalyst to some extent. Further XPS data processing revealed that Co3+/Co2+, Ni3+/Ni2+ and Cu2+/Cu+ exist in the separate systems of CoMnAl-LDO, NiMnAl-LDO, CuMnAl-LDO. In general, more Co3+, Ni3+ and Cu2+ species were preferable for redox ability, while the existence of redox circles like Co3+ + Mn3+ ↔ Co2+ + Mn4+, Ni3+ + Mn3+ ↔ Ni2+ + Mn4+ and Cu2+ + Mn3+ ↔ Cu+ + Mn4+ also played a major role in improving the catalytic activity.37,38
| Catalyst | Reduction temperature (°C) | H2 consumption (mmol g−1) | NOx desorption (%) | Total NOx desorption (a.u.) | |||
|---|---|---|---|---|---|---|---|
| T1 | T2 | 100–150 °C | 150–200 °C | >200 °C | |||
| CoMnAl-LDO | 395 | 646 | 10.1 | 38.9 | 31.7 | 29.4 | 2.5 |
| NiMnAl-LDO | 489 | — | 11.3 | 59.5 | 40.5 | — | 1.1 |
| CuMnAl-LDO | 284 | — | 2.6 | — | 42.9 | 57.1 | 1.3 |
| MnAl-LDO | 324 | 502 | 6.4 | — | 56.3 | 43.7 | 1 |
3.4 Kinetic analysis
3.5 Stability test and H2O/SO2 resistance test
4. Conclusions
In this study, a series of transition metal (Cu, Ni, Co) modified MnAl catalysts were obtained via calcining the corresponding LDH precursors and evaluated for the NH3-SCR reaction. The obtained information suggested that the catalytic activities of the catalysts were strongly dependent on the identity of their transition metal, for which the NH3-SCR reactivity order was CoMnAl-LDO > NiMnAl-LDO > CuMnAl-LDO. The fine catalytic performance in the broadest working temperature window over the CoMnAl-LDO catalyst should be attributed to its good dispersion of active species over the CoMnAl-LDO surface, which could contribute to its optimum redox behavior, plentiful acid sites and NOx adsorption sites. These findings might open the future potential for LDHs and provide a new mentality for heterogeneous catalysis.Conflicts of interest
There are no conflicts of interest to declare.Acknowledgements
The project was supported by National Natural Science Foundation of the China (No. 51978436), Scientific and Technological Innovation Programs of Higher Education Institutions in Shanxi (2019L0885) and the Doctoral Startup and Research Fund of Jinzhong University.Notes and references
- Z. Y. Fan, Z. Y. Wang, J. W. Shi, C. Gao, G. Gao, B. R. Wang, Y. Wang, X. Chen, C. He and C. M. Niu, J. Catal., 2019, 370, 30–37 CrossRef CAS.
- C. Fang, D. S. Zhang, L. Y. Shi, R. H. Gao, H. R. Li, L. P. Ye and J. P. Zhang, Catal. Sci. Technol., 2013, 3, 803–811 RSC.
- U. Bentrup, A. Brückner, M. Richter and R. Fricke, Appl. Catal., B, 2001, 32, 229–241 CrossRef CAS.
- J. Muñiz, G. Marbán and A. B. Fuertes, Appl. Catal., B, 2000, 27, 27–36 CrossRef.
- Z. Y. Fan, J. W. Shi, C. Gao, G. Gao, B. R. Wang, Y. Wang, C. He and C. M. Niu, Chem. Eng. J., 2018, 348, 820–830 CrossRef CAS.
- B. Thirupathi and P. G. Smirniotis, J. Catal., 2012, 28, 874–883 Search PubMed.
- S. Djerad, M. Crocoll, S. Kureti, L. Tifouti and W. Weisweiler, Catal. Today, 2006, 113, 208–214 CrossRef CAS.
- B. H. Hou, Y. L. Du, X. Z. Liu, C. Ci, X. Wu and X. M. Xie, RSC Adv., 2019, 9, 24377–24385 RSC.
- J. P. Dunn, P. R. Koppula, H. G. Stenger and I. E. Wachs, Appl. Catal., B, 1998, 19, 103–117 CrossRef CAS.
- S. Andreoli, F. A. Deorsola, C. Galletti and R. Pirone, Chem. Eng. J., 2015, 278, 174–182 CrossRef CAS.
- X. L. Tang, J. M. Hao, W. G. Xu and J. H. Li, Catal. Commun., 2007, 8, 329–334 CrossRef CAS.
- F. Y. Gao, X. L. Tang, H. H. Yi, J. Y. Li, S. Z. Zhao, J. G. Wang, C. Chu and C. L. Li, Chem. Eng. J., 2017, 317, 20–31 CrossRef CAS.
- Z. H. Chen, Q. Yang, H. Li, X. H. Li, L. F. Wang and S. C. Tsang, J. Catal., 2010, 276, 56–65 CrossRef CAS.
- D. Fang, J. L. Xie, D. Mei, Y. M. Zhang, F. He, X. Q. Liu and Y. M. Li, RSC Adv., 2014, 4, 25540–25551 RSC.
- M. Y. Qiu, S. H. Zhan, H. B. Yu, D. D. Zhu and S. Q. Wang, Nanoscale, 2015, 7, 2568–2577 RSC.
- H. Meng, J. N. Liu, Y. L. Du, B. H. Hou, X. Wu and X. M. Xie, Catal. Commun., 2019, 119, 101–105 CrossRef CAS.
- Y. K. Shao, J. H. Li, H. Z. Chang, Y. Peng and Y. X. Deng, Catal. Sci. Technol., 2015, 5, 3536–3544 RSC.
- L. Chmielarz, P. Kuśtrowski, A. Rafalska-Łasocha, D. Majda and R. Dziembaj, Appl. Catal., B, 2002, 35, 195–210 CrossRef CAS.
- Q. H. Yan, S. N. Chen, C. Zhang, D. O'Hare and Q. Wang, J. Colloid Interface Sci., 2018, 526, 63–74 CrossRef CAS PubMed.
- X. Wu, Y. L. Feng, X. Z. Liu, L. L. Liu, Y. L. Du and Z. Li, Appl. Surf. Sci., 2019, 495, 143513 CrossRef CAS.
- Q. H. Yan, Y. Nie, R. Y. Yang, Y. H. Cui, D. O'Hare and Q. Wang, Appl. Catal., A, 2017, 538, 37–50 CrossRef CAS.
- C. Gennequin, T. Barakat, H. L. Tidahy, R. Cousin, J. F. Lamonier, A. Aboukaïs and S. Siffert, Catal. Today, 2010, 157, 191–197 CrossRef CAS.
- J. M. Gatica and H. Vidal, J. Hazard. Mater., 2010, 181, 9–18 CrossRef CAS PubMed.
- C. J. Wang and D. O'Hare, J. Mater. Chem., 2012, 22, 23064–23070 RSC.
- S. Kannan and V. Rives, J. Solid State Chem., 2004, 177, 319–331 CrossRef CAS.
- C. X. Yang, L. B. Liao, G. C. Lv, L. M. Wu, L. F. Mei and Z. H. Li, J. Colloid Interface Sci., 2016, 479, 115–120 CrossRef CAS PubMed.
- D. Zhao, C. Wang, F. Yu, Y. L. Shi, P. Cao, J. M. Dan, K. Chen, Y. Lv, X. H. Guo and B. Dai, Nanomaterials, 2018, 8, 620 CrossRef PubMed.
- X. J. Li, Y. L. Du, X. M. Guo, R. N. Wang, B. H. Hou and X. Wu, Catal. Lett., 2018, 149, 456–464 CrossRef.
- X. Wu, Y. L. Feng, Y. L. Du, X. Z. Liu, C. L. Zou and Z. Li, Appl. Surf. Sci., 2019, 495, 14353 Search PubMed.
- S. P. Mo, S. D. Li, W. H. Li, J. Q. Li, J. Y. Chen and Y. F. Chen, J. Mater. Chem. A, 2016, 4, 8113–8122 RSC.
- Q. M. Jia, S. Y. Shan, L. H. Jiang, Y. M. Wang and D. Li, J. Appl. Polym. Sci., 2012, 125, 3560–3566 CrossRef CAS.
- F. D. Liu and H. He, J. Phys. Chem. C, 2010, 114, 16929–16936 CrossRef CAS.
- S. N. Chen, Q. H. Yan, C. Zhang and Q. Wang, Catal. Today, 2019, 327, 81–89 CrossRef CAS.
- Y. Nie, Q. H. Yan, S. Chen, D. O'Hare and Q. Wang, Catal. Commun., 2017, 97, 47–50 CrossRef CAS.
- B. Meng, Z. B. Zhao, X. Z. Wang, J. J. Liang and J. S. Qiu, Appl. Catal., B, 2013, 129, 491–500 CrossRef CAS.
- X. Wu, Y. L. Feng, Y. L. Du, X. Z. Liu, C. L. Zou and Z. Li, Appl. Surf. Sci., 2019, 467, 802–810 CrossRef.
- F. Y. Gao, X. L. Tang, H. H. Yi, S. Z. Zhao, J. G. Wang, Y. R. Shi and X. M. Meng, Appl. Surf. Sci., 2018, 443, 103–113 CrossRef CAS.
- H. Meng, J. N. Liu, Y. L. Du, B. H. Hou, X. Wu and X. M. Xie, Catal. Commun., 2019, 119, 101–105 CrossRef CAS.
- C. Z. Sun, J. Zhu, Y. Y. Lv, L. Qi, B. Liu, F. Gao, K. Q. Sun, L. Dong and Y. Chen, Appl. Catal., B, 2011, 103, 206–220 CrossRef CAS.
- J. F. Lamonier, A. B. Boutoundou, C. Gennequin, M. J. Pérez-Zurita and S. Siffert, Catal. Lett., 2007, 118, 165–172 CrossRef CAS.
- S. X. Cai, D. S. Zhang, L. Y. Shi, J. Xu, L. Zhang, L. Huang, H. R. Li and J. P. Zhang, Nanoscale, 2014, 6, 7346–7353 RSC.
- X. Wu, H. Meng, Y. L. Du, J. N. Liu, B. H. Hou and X. M. Xie, ACS Appl. Mater. Interfaces, 2019, 11, 32917–32927 CrossRef CAS PubMed.
- K. I. Hadjiivanov, Catal. Rev., 2000, 42, 71–144 CrossRef CAS.
- F. D. Liu, H. He, Y. Ding and C. B. Zhang, Appl. Catal., B, 2009, 93, 194–204 CrossRef CAS.
- L. J. Yan, Y. Y. Liu, H. Hu, H. R. Li, L. Y. Shi and D. S. Zhang, ChemCatChem, 2016, 8, 2267–2278 CrossRef CAS.
- S. C. Xiong, Y. Liao, X. Xiao, H. Dang and S. J. Yang, J. Phys. Chem. C, 2015, 119, 4180–4187 CrossRef CAS.
- G. S. Qi and R. T. Yang, J. Catal., 2003, 217, 434–441 CrossRef CAS.
- G. S. Qi, R. T. Yang and R. Chang, Appl. Catal., B, 2004, 51, 93–106 CrossRef CAS.
- R. H. Gao, D. S. Zhang, P. Maitarad, L. Y. Shi, T. Rungrotmongkol, H. R. Li, J. P. Zhang and W. G. Cao, J. Phys. Chem. C, 2013, 117, 10502–10511 CrossRef CAS.
- X. N. Lu, C. Y. Song, S. H. Jia, Z. S. Tong, X. L. Tang and Y. X. Teng, Chem. Eng. J., 2015, 260, 776–784 CrossRef CAS.
Footnotes |
| † Electronic supplementary information (ESI) available. See DOI: 10.1039/c9ra08391j |
| ‡ These authors contributed equally to this work. |
| This journal is © The Royal Society of Chemistry 2019 |


