 Open Access Article
Environmentally benign, facile and selective recovery of gold from aqueous media: synergic role of carbon dots as green reductant and sensor towards Au3+ ions†
Kaviyarasan Raji a,
Ramanan Vadivel
 b,
Senthil Kumar Thiyagarajan
 a and
Perumal Ramamurthy
 *a
*a
aNational Centre for Ultrafast Processes, University of Madras, Taramani Campus, Chennai – 600113, Tamil Nadu, India. E-mail: prm60@hotmail.com
bForensic Sciences Department, Government of Tamil Nadu, Chennai – 600004, Tamil Nadu, India
First published on 2nd December 2019
Abstract
Photoluminescent carbon dots (PL CDs) have drawn tremendous attention from researchers owing to their admirable properties and wide range of applications. Herein, highly PL nitrogen and sulfur doped carbon dots (N,S-CDs) were synthesized through a facile, green and rapid one-step microwave assisted method using goat hooves, a bio-waste and a green precursor. The structural and photophysical properties of as obtained N,S-CDs were thoroughly investigated. From the investigation, it is revealed that the N,S-CDs possess a spherical morphology with an average particle size of about 2 nm, highly amorphous nature, high functionality, negative zeta potential (−32 mV), good water-solubility, excitation dependant PL, high PL quantum yield (23.8%), nanosecond lifetime (τavg = 3.38 ns) and excellent storage stability for 180 days without any agglomeration. In addition, the N,S-CDs exhibit high PL stability under diverse pH conditions, wide ionic strength and resistance towards photobleaching, which are very important properties for practical applications. The N,S-CDs selectively sense Au3+ ions and also reduce the Au3+ ions to metallic gold. Hence, the N,S-CDs were successfully applied as a potential candidate for sensing of Au3+ and simultaneous extraction of metallic gold in aqueous media without any further reducing agents. It is a significant green way for the recovery of gold in aqueous media.
Introduction
Gold is a very expensive and rare metal. This precious metal plays important roles in jewellery, modern electronics, medicine, chemical catalysis and in national economy because of its high usage and wide applications.1–5 So the demand for gold is rapidly increasing day by day. In nature, gold exists in various oxidation states such as 0, +1, and +3. Although, metallic gold is not significantly toxic to humans, gold ions are potentially toxic to the human body. For instance, Au3+ ions can bind strongly to DNA and several enzymes, resulting in serious damage to the peripheral nervous system, liver, kidneys and other health issues such as blood dyscrasias, cutaneous reactions, nephrotoxicity, bone marrow depression, etc.6,7 Moreover, due to their biocompatibility, gold in nano form having tremendous attention and potential applications in photodynamic therapy, photothermal therapy, drug delivery, bio-sensing, etc.8–12 Extraction of gold from mine tailing, sewage sludge, industrial and electrical waste, obsolete electronic equipment and leaching residue are becoming important routes for sustainable gold supply. This valuable material is extracted from ores with a low abundance of gold as compared with the waste materials.13 The waste electrical and electronic equipment (WEEE) has been recognized as an attractive source of gold, because the gold content of WEEE is estimated to be 80 times higher than that found in global primary gold mining deposits.5 Therefore, the development of highly efficient easy and eco-friendly methods to extract gold from these waste streams has attracted great attention for the researchers. Recently, many methods were used to recover gold from ores and WEEE.5,13–18 However, highly selective sensing and extraction of Au3+ is always a significant challenge because other metal ions such as ferric, aluminium, magnesium, nickel, copper and zinc ions etc. are coexist with gold ion in the waste streams. For these reasons, selective sensing and extraction of gold are deserve a great attention. The existing recovery methods are complex, time-consuming, entails the use of toxic chemicals, generate wastewater, and highly expensive. Therefore, a new, efficient, cost-effective, facile, rapid, eco-friendly and selective sensing cum extraction method is immediately warranted. In this work, we demonstrate a simple room temperature selective sensing of Au3+ ions and extraction of metallic gold in aqueous media using N,S-CDs as a carbon nanoreactor. PL CDs draws a great attention since its discovery, owing to their low cytotoxicity, good biocompatibility, excellent PL QY, low cost, environmental friendliness, free solubility in water and/or organic solvents, and simple synthetic routes with diverse optical and physical properties. Owing to their excellent properties, they can be employed for variety of potential applications for example in bioimaging, sensing, targeted drug delivery, photoelectric device, and catalysis.19–21 The PL CDs are usually less than 10 nm in size, which consist of carbogenic core and functional groups on their surface. These functional groups play an important role on photophysical & photochemical properties and solubility of CDs.22–24 The heteroatom doping approach is used to tune the optical and electronic properties of the CDs. Typically, doping elements can be classified into metal atoms and heteroatoms (non-metal). The major obstacle to metal-atom doping is its resulting toxicity. On the other hand, the non-metal based heteroatom doping of CDs which attracted much attention in recent years due to their less toxic nature.25–27 The N and S co-doped CDs were first synthesized via a one-step hydrothermal treatment on the mixture of citric acid and L-cysteine.28 The properties of N and S co-doped CDs have been actively investigated by many researchers.29,30 The PL CDs are generally synthesized by either top-down or bottom-up approach.31–34 Green synthesis of the CDs from biomass is a highly attractive research topic due to their easy accessibility, eco-friendly and renewable nature. Some of the reported green precursors are grass, peanut shells, algal blooms, and vegetable and food wastes.35–39In this work, we have used goat hooves as a precursor for synthesis of highly PL N,S-CDs by a one-step microwave assisted method without any other external doping agent. At the same time the microwave-assisted method is a complete green method. Also the goat hooves are a natural and nontoxic biowaste, which is mainly composed of hard α-keratin. The optical and structural properties of synthesized N,S-CDs are systematically investigated in this work. The obtained N,S-CDs have stable PL properties with high PL QY and excellent solubility. Only three reports are available in the literature for the selective detection of Au3+ ions in aqueous media using CDs.40–42 However, to the best of our knowledge, no report exists on selective sensing of Au3+ ions cum extraction of aqueous Au3+ ions as metallic gold (Au0) in aqueous medium using N,S-CDs as a sole material.
Materials and methods
Materials
The goat hooves were collected from local goat meat market (Tamil Nadu, India) for synthesis of N,S-CDs. Phosphoric acid (85%) was purchased from Qualigens to carbonize the precursor. Quinine sulfate (98%) was purchased from Fluka to calculate the PL QY of N,S-CDs. Gold(III) chloride hydrate was purchased from Sigma Aldrich. Potassium chloride, sodium hydroxide and sulfuric acid were purchased from Qualigens to check the PL stability of the N,S-CDs. The cellulose ester dialysis membrane (Spectra/Por, Float-A-Lyzer G2, MWCO 500-1000D) was purchased from Spectrum Labs to purify the obtained N,S-CDs. All solutions were prepared using Millipore water from Aquelix 5 water purification system.Instruments
Characterization
The HRTEM (Tecnai G2 20 Twin) was used to analyze the particle size, morphology, Energy Dispersive X-Ray Analysis (EDX) and the selected area electron diffraction (SAED) pattern of N,S-CDs and gold nanoparticles (AuNPs). The Raman spectrum of the N,S-CDs was recorded using a Raman 11i system from Nanophoton Corp., Japan under excitation at 532 nm. The surface functional groups and elemental composition of N,S-CDs were analyzed by using an ESCA-14 (Omicron Nanotechnology) X-ray photoelectron spectrometer and Bruker Vertex 70 FT-IR spectrometer. The X-ray diffraction (XRD) patterns of N,S-CDs were determined using an XPERT PRO, PANalytical instrument. The zeta potential of N,S-CDs measurements was done using nanopartica 100-SZ made by HORIBA Scientific.Photophysical investigation
The photophysical properties of the N,S-CDs were investigated using the following techniques. UV-Vis absorption spectra were recorded using a Cary 100 Bio UV-Visible double beam spectrophotometer. All PL measurements (PL, contour, excitation) were carried out using a Flouromax-4P spectrofluorometer (HORIBA Jobin Yvon Inc.). The PL lifetime decay were measured by time-correlated single-photon counting (TCSPC) spectrometer with a photomultiplier tube as a detector and a 375 nm light emitting diode (LED) as the excitation source. The relative PL QY of N,S-CDs was calculated by slope method using Quinine sulphate (0.1 M H2SO4 as solvent; QY = 0.54 at 366 nm) was chosen as standard.PL stability of N,S-CDs
The PL stability of obtained N,S-CDs was investigated with respect to various ionic strengths and different pH values. Moreover, the photostability and storage stability of aqueous N,S-CDs were investigated. The PL spectra were recorded under an excitation at 380 nm using a spectrophotometer.Selective detection of Au3+ ions
Aqueous solutions of various biologically and environmentally important metal ions such as Na+, K+, Ca2+, Mn2+, Fe2+, Fe3+, Co2+, Cu2+, Zn2+, Ag+, Hg2+, Pb2+, and Au3+ were separately prepared to the concentration of 5 mM and used as metal ion sources. The PL spectra of N,S-CDs in the absence and presence of these metal ions were examined under an excitation at 400 nm. The PL of N,S-CDs was significantly quenched in the presence of Au3+, while the other metal ions displayed no considerable or noticeable quenching on the PL intensities of N,S-CDs.PL sensing of Au3+ ions and extraction of Au3+ ions as metallic gold
The PL quenching studies were executed at room temperature in an aqueous solution of N,S-CDs by a standard addition method. Various concentrations of Au3+ ranging from 0 to 180 μM were added to an aqueous solution of N,S-CDs, and the quenching response of Au3+ on the PL intensity of N,S-CDs was examined. The PL spectra were recorded under an excitation at 400 nm using a spectrophotometer. The Au3+ added solution were placed for about 7 h at a room temperature and then a yellowish, shining, flying, glittering gold sparkles were formed. After 24 h the flying glittering gold sparkles were settling down and extracted.Synthesis of N and S doped carbon dots from goat hooves (N,S-CDs)
Goat hooves were severed into small pieces and were washed several times in tap water followed by distilled water. It was used as the precursor to synthesis the N and S doped PL CDs. 1 g of these clean pieces and 40% of aqueous phosphoric acid (20 mL) were added into a 250 mL beaker. The beaker was then kept in a domestic microwave oven (SAMSUNG, Model: MW73BD) at 600 W for 4 min and 28 s, and then the beaker was allowed to cool to room temperature naturally. A concentrated dark brown solution was obtained, which ascertains the formation of N,S-CDs. The obtained solution was dried and re-dissolved in 20 mL of ethanol. NaOH solution was then added dropwise in cold condition to remove the unreacted phosphoric acid as trisodium phosphate (Na3PO4). It was then filtered through a Whatman 40 grade filter paper and centrifuged at 18![[thin space (1/6-em)]](https://www.rsc.org/images/entities/char_2009.gif) 000 rpm for 30 min to remove large particles. The resulting clear supernatant solution was then transferred into a pre-treated, cellulose ester dialysis membrane of 10 mL capacity. Dialysis was carried out for 48 hours against Millipore water to remove any small, partial carbonization molecules and dissolved Na3PO4. The outer buffer was changed for every 4 h. Then the dialysate was collected and dried under vacuum using a rotary evaporator (Equitron Roteva, India) to obtain powder N,S-CDs. Desired amount of obtained N,S-CDs were re-dissolved in water and used for further studies. The obtained N,S-CDs solutions were stored at 4 °C for further photophysical examination and characterization. The obtained N,S-CDs have fine solubility in water and other polar solvents.
000 rpm for 30 min to remove large particles. The resulting clear supernatant solution was then transferred into a pre-treated, cellulose ester dialysis membrane of 10 mL capacity. Dialysis was carried out for 48 hours against Millipore water to remove any small, partial carbonization molecules and dissolved Na3PO4. The outer buffer was changed for every 4 h. Then the dialysate was collected and dried under vacuum using a rotary evaporator (Equitron Roteva, India) to obtain powder N,S-CDs. Desired amount of obtained N,S-CDs were re-dissolved in water and used for further studies. The obtained N,S-CDs solutions were stored at 4 °C for further photophysical examination and characterization. The obtained N,S-CDs have fine solubility in water and other polar solvents.
Results and discussion
Structural investigation of N,S-CDs
The N,S-CDs were synthesized using goat hooves as a carbon source under microwave irradiation (MWI) method is illustrated in Scheme 1. The morphological features of the prepared N,S-CDs were examined by TEM image analysis (Fig. 1a). From the TEM image analysis and the corresponding size distribution histogram, it is very evident that the prepared N,S-CDs possess spherical morphology and monodispersed in nature. From the Gaussian fitting of the histogram we get to know the statistical mean diameter of N,S-CDs is 1.71 ± 0.04 nm (Fig. 1b) on analysing 100 particles.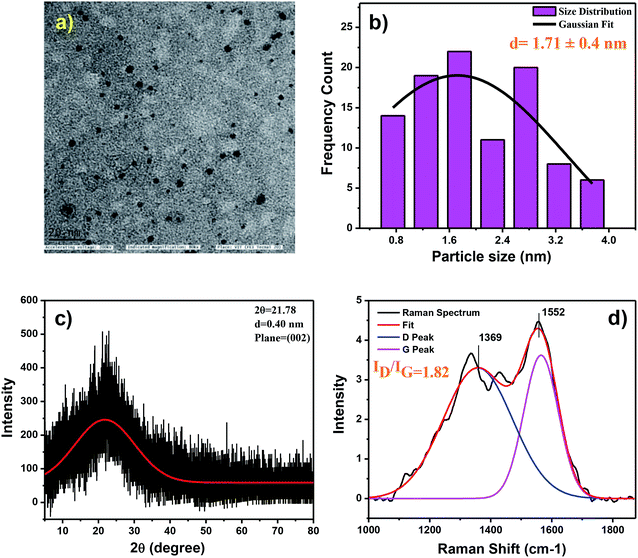 | ||
| Fig. 1 (a) TEM image (scale bar: 20 nm), (b) corresponding particle size distribution histogram, (c) XRD pattern and (d) Raman spectrum of obtained N,S-CDs. | ||
The X-ray diffraction pattern of N,S-CDs (Fig. 1c) showed a single broad peak centred at 2θ = 21.78° depicted the lattice spacing at (002), which in turn corresponds to the defects in the sp3 sites of the carbon based material. The Raman spectroscopy is a great tool for estimating the crystallinity and amorphicity of the material. The Raman analysis of N,S-CDs shows two peaks at 1338 cm−1 and 1549 cm−1 (Fig. 1d) corresponding to the D (A1g symmetry) and G (E2g symmetry) bands of N,S-CDs respectively. The ID/IG ratio of CDs is 1.82 confirms the N,S-CDs are highly amorphous in nature.43 The ID/IG band intensity ratio not only quantifies for the sp3 hybridized carbon atoms but is useful for the comparison of defects and disorder density. The obtained XRD and Raman results clarified that the N,S-CDs are amorphous in nature.
The elemental analysis of N,S-CDs was performed through X-ray photoelectron spectroscopy (XPS). The survey spectrum of the N,S-CDs shows four distinct peaks with the binding energies of 164.0, 284.5, 401.0, and 531.0 eV correspond to S 2p, C 1s, N 1s, and O 1s respectively (Fig. 2a). The high resolution, deconvoluted C 1s spectra (Fig. 2b) exhibited peaks at 284.4, 285.5, 286.7, and 288.7 eV corresponding to C–C/C![[double bond, length as m-dash]](https://www.rsc.org/images/entities/char_e001.gif) C, C–N/C–S, C–O and C
C, C–N/C–S, C–O and C![[double bond, length as m-dash]](https://www.rsc.org/images/entities/char_e001.gif) O bonds respectively. The high resolution N 1s spectra (Fig. 2c) exhibited peaks at 399 and 400.7 eV corresponding to C–N and N–H bonds respectively. Similarly, high resolution O 1s spectra exhibited peaks at 531.6 and 533.2 eV representing C
O bonds respectively. The high resolution N 1s spectra (Fig. 2c) exhibited peaks at 399 and 400.7 eV corresponding to C–N and N–H bonds respectively. Similarly, high resolution O 1s spectra exhibited peaks at 531.6 and 533.2 eV representing C![[double bond, length as m-dash]](https://www.rsc.org/images/entities/char_e001.gif) O and C–O bonds respectively (Fig. 2d). Finally, the high resolution S 2p spectra with the peak at 164.2 eV attributed to the presence of C–S bond (Fig. 2e). From the XPS analysis, the elemental compositions of N,S-CDs were calculated: C (80%), N (5.6%), O (13%), and S (1%). The structural characterization of N,S-CDs was further extended towards FTIR spectral analysis with which we can find out the diverse functionalities present in the N,S-CDs. The FTIR spectrum of the precursor is compared with that of the N,S-CDs which is shown in Fig. 2f.
O and C–O bonds respectively (Fig. 2d). Finally, the high resolution S 2p spectra with the peak at 164.2 eV attributed to the presence of C–S bond (Fig. 2e). From the XPS analysis, the elemental compositions of N,S-CDs were calculated: C (80%), N (5.6%), O (13%), and S (1%). The structural characterization of N,S-CDs was further extended towards FTIR spectral analysis with which we can find out the diverse functionalities present in the N,S-CDs. The FTIR spectrum of the precursor is compared with that of the N,S-CDs which is shown in Fig. 2f.
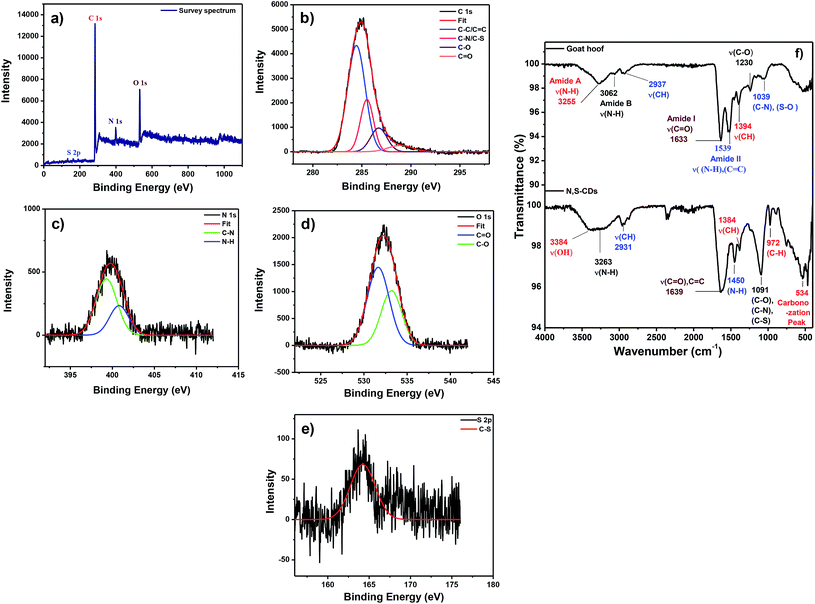 | ||
| Fig. 2 (a) XPS survey spectrum and high-resolution spectra of (b) C 1s, (c) N 1s, (d) O 1s and (e) S 2p peaks of as obtained N,S-CDs. (f) FT-IR spectrum of goat hoof and N,S-CDs. | ||
The IR spectrum of the goat hooves which we took is in well agreement with the previous study conducted by G. N. Nagaraju et al.44 Amide A exhibited absorption peak at 3255 cm−1 and Amide B stretching is observed at 3062 cm−1. The small absorption peak at 2937 cm−1 is attributed to the stretching vibration of the CH3 and CH2 groups. The absorption peaks at 1633 cm−1 and 1539 cm−1 correspond to the stretching vibration of C![[double bond, length as m-dash]](https://www.rsc.org/images/entities/char_e001.gif) O (Amide I) and N–H/C
O (Amide I) and N–H/C![[double bond, length as m-dash]](https://www.rsc.org/images/entities/char_e001.gif) C (Amide II) bonds. Asymmetric CH3 bending modes of the methyl group of the protein and methylene deformation was observed at 1394 cm−1. A shoulder peak at 1039 cm−1 attributed to stretching vibration of C–N and S–O. On comparing it with the FTIR spectrum of the N,S-CDs the following results are obtained. A broad peak ranging from 3600–3119 cm−1 is characteristic to hydroxyl and amine functionalities. A small peak at 2931 cm−1 is due to the stretching vibration of the CH3 and CH2 groups. The similar peak was found in our precursor too. The strong absorption peak at 1639 cm−1 attributed to the stretching vibration of C
C (Amide II) bonds. Asymmetric CH3 bending modes of the methyl group of the protein and methylene deformation was observed at 1394 cm−1. A shoulder peak at 1039 cm−1 attributed to stretching vibration of C–N and S–O. On comparing it with the FTIR spectrum of the N,S-CDs the following results are obtained. A broad peak ranging from 3600–3119 cm−1 is characteristic to hydroxyl and amine functionalities. A small peak at 2931 cm−1 is due to the stretching vibration of the CH3 and CH2 groups. The similar peak was found in our precursor too. The strong absorption peak at 1639 cm−1 attributed to the stretching vibration of C![[double bond, length as m-dash]](https://www.rsc.org/images/entities/char_e001.gif) O, C
O, C![[double bond, length as m-dash]](https://www.rsc.org/images/entities/char_e001.gif) C groups. The small peaks at 1450 cm−1 corresponding to stretching vibration of N–H bonds. The stretching vibration at 1091 cm−1 is assigned to the C–N, C–O and C–S bonds. The weak peaks at 1384 and 972 cm−1 attributed to the stretching and out-of-plane bending vibrations of C–H moieties respectively. The carbonization peak appeared at 534 cm−1. The N,S-CDs possess negative zeta potential value −32 mV indicates N,S-CDs having carboxyl moieties on the surface (Fig. S1 in the ESI†). The XPS, FTIR, and zeta potential results confirm that the N,S-CDs are highly functionalized with carboxyl, hydroxyl, amine and thiol groups. These polar surface moieties are responsible for the excellent water solubility and high PL QY of the N,S-CDs.
C groups. The small peaks at 1450 cm−1 corresponding to stretching vibration of N–H bonds. The stretching vibration at 1091 cm−1 is assigned to the C–N, C–O and C–S bonds. The weak peaks at 1384 and 972 cm−1 attributed to the stretching and out-of-plane bending vibrations of C–H moieties respectively. The carbonization peak appeared at 534 cm−1. The N,S-CDs possess negative zeta potential value −32 mV indicates N,S-CDs having carboxyl moieties on the surface (Fig. S1 in the ESI†). The XPS, FTIR, and zeta potential results confirm that the N,S-CDs are highly functionalized with carboxyl, hydroxyl, amine and thiol groups. These polar surface moieties are responsible for the excellent water solubility and high PL QY of the N,S-CDs.
Photophysical investigation of N,S-CDs
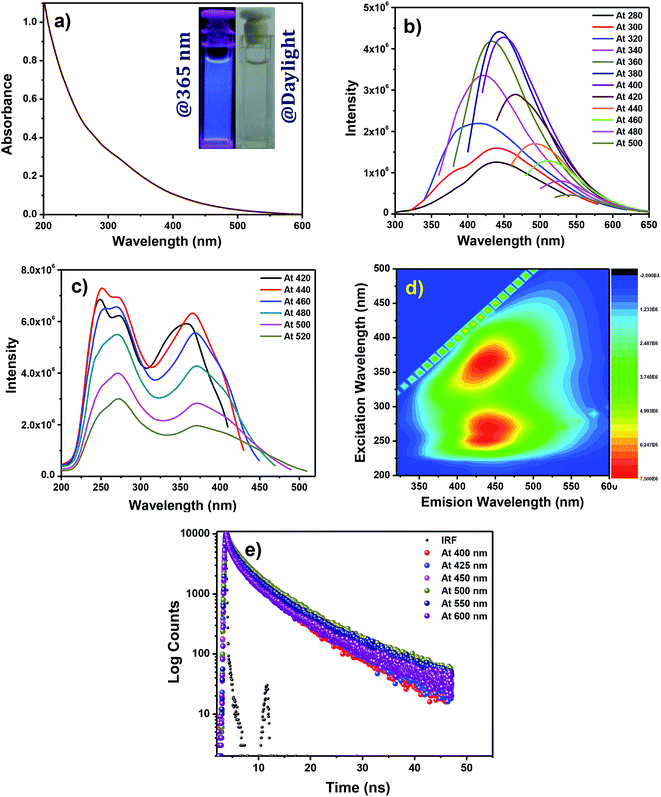
Fig. 3a represents the UV-Vis absorption spectrum of the N,S-CDs. The UV-Vis absorption spectrum extends up to visible range sans noticeable structure. On exposure to 365 nm UV irradiation, the aqueous solution of the N,S-CDs produced a blue emission (inset of Fig. 3a). Like majority of luminescent carbon nanoparticles, our N,S-CDs too exhibited excitation dependent emission behaviour as shown in the Fig. 3b.This behaviour may be attributed to the diverse surface properties and size of the N,S-CDs. The PL maximum of N,S-CDs was perceived at 444 nm when excited at 380 nm. On normalizing the PL spectra of N,S-CDs recorded at different excitation wavelengths, we can clearly monitor a bathochromic shift of PL maximum (Fig. S2 in the ESI†). The PL dependant excitation spectra of N,S-CDs were recorded at various emission wavelengths (Fig. 3c). In the PL dependant excitation spectrum, two excitation maxima were observed at 252 and 365 nm corresponding to the π–π* transition of aromatic (C![[double bond, length as m-dash]](https://www.rsc.org/images/entities/char_e001.gif) C) in the carbon core, and n–π* transition of heteroatomic surface functionalities. The PL quantum yield of N,S-CDs was calculated by slope method using quinine sulphate (QS) as reference. QS was dissolved in 0.1 M H2SO4 (refractive index, η = 1.33). An excellent quantum yield of 23.8% was observed for N,S-CDs (Fig. S3 and Table S1 in the ESI†). The 2-D PL contour pattern of the CDs (Fig. 3d) exhibits two distinct contours. The emission centres of N,S-CDs appear at 441 nm (λex = 270 nm) and 440 nm (λex = 370 nm). There is no significant difference between the positions of emission centres i.e. the emission maxima remain unshifted with respect to the excitation centre.45 The PL lifetime of the N,S-CDs are tracked by TCSPC method. The N,S-CDs are excited at 375 nm and the PL decay is monitored at various PL wavelengths (Fig. 3e). The decay profiles of the prepared N,S-CDs at various emission wavelengths are best fitted triexponentially and the corresponding parameters derived from the nonlinear least squares fitting are tabulated (the detailed results of fitting are presented in Table S2 in the ESI†). For example, the lifetimes of the N,S-CDs at the PL wavelength of 450 nm are τ1 = 0.69, τ2 = 3.55, and τ3 = 9.25 ns. The calculated average lifetime is τavg = 3.38 ns. The above mentioned results and properties of N,S-CDs indicates that the obtained N,S-CDs can be used for diverse applications such as sensing, catalysis, bioscience and energy technology.
C) in the carbon core, and n–π* transition of heteroatomic surface functionalities. The PL quantum yield of N,S-CDs was calculated by slope method using quinine sulphate (QS) as reference. QS was dissolved in 0.1 M H2SO4 (refractive index, η = 1.33). An excellent quantum yield of 23.8% was observed for N,S-CDs (Fig. S3 and Table S1 in the ESI†). The 2-D PL contour pattern of the CDs (Fig. 3d) exhibits two distinct contours. The emission centres of N,S-CDs appear at 441 nm (λex = 270 nm) and 440 nm (λex = 370 nm). There is no significant difference between the positions of emission centres i.e. the emission maxima remain unshifted with respect to the excitation centre.45 The PL lifetime of the N,S-CDs are tracked by TCSPC method. The N,S-CDs are excited at 375 nm and the PL decay is monitored at various PL wavelengths (Fig. 3e). The decay profiles of the prepared N,S-CDs at various emission wavelengths are best fitted triexponentially and the corresponding parameters derived from the nonlinear least squares fitting are tabulated (the detailed results of fitting are presented in Table S2 in the ESI†). For example, the lifetimes of the N,S-CDs at the PL wavelength of 450 nm are τ1 = 0.69, τ2 = 3.55, and τ3 = 9.25 ns. The calculated average lifetime is τavg = 3.38 ns. The above mentioned results and properties of N,S-CDs indicates that the obtained N,S-CDs can be used for diverse applications such as sensing, catalysis, bioscience and energy technology.
PL stability of obtained N,S-CDs
PL stability of CDs is very important for practical applications. For that the PL stability of the N,S-CDs examined under diverse environmental conditions, such as increasing ionic strength, changing pH values, continuous UV irradiation, and long-term storage of the N,S-CDs aqueous solutions (Fig. 4a–d). There was no notable change in PL intensity or peak characteristics of N,S-CDs at different ionic strengths (from 0 to 2 M of KCl). The effect of pH on the PL intensity of the N,S-CDs was examined over the wide pH range (pH = 1 to 13). From the results, it is observed that the PL shows a maximum at pH 3 to pH 5. Unlike most of the previously reported CDs whose luminescence is quenched at both acidic and basic extremes, the luminescence of our N,S-CDs is not affected to a large extent in acidic pH (from pH 9 to pH 1), which extends its materialistic applications to where other CDs cannot be employed. The PL of N,S-CDs start quenching at pH 11 and attains its lowest extreme at pH 13. In addition, the PL stability of N,S-CDs was investigated under continuous illumination of UV light at 365 nm for 70 min and there was no significant effect observed on PL of N,S-CDs. The N,S-CDs solution shows a long-term homogeneous phase without any noticeable precipitation and accumulation at room temperature. In addition, the PL intensity has no remarkable change during long-term storage for 180 days. The above mentioned results portrays the excellent stability of PL of N,S-CDs and hence it can be a potential candidate for a wide range of applications.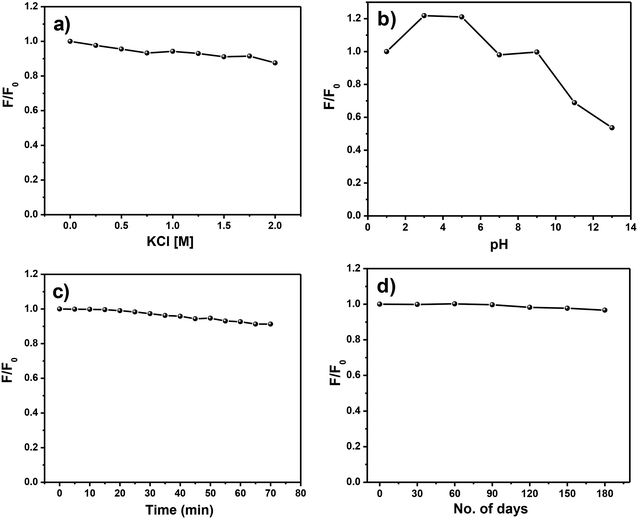 | ||
| Fig. 4 PL stability of N,S-CDs with (a) different ionic strengths, (b) various pH, (c) under UV irradiation. (d) Long-term PL stability of N,S-CDs. | ||
Applications of N,S-CDs
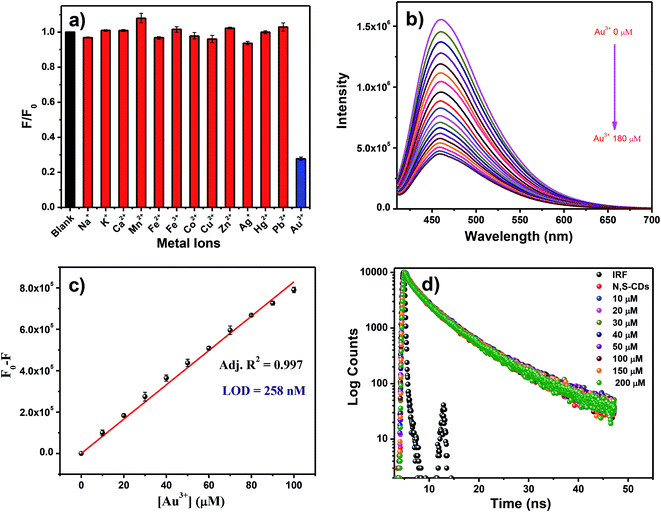
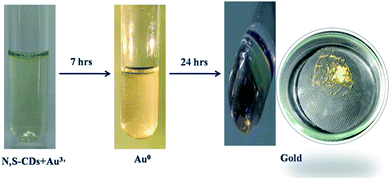
The N,S-CDs showed multifarious properties, like optical property, good resilience for pH, excellent solubility and resistance towards photobleaching. Hence, the N,S-CDs pave way for its applications in bio-imaging, optical sensing, biological labelling and catalysis. In our study, we have investigated the ion sensing property of the N,S-CDs in aqueous media. The role played by the metal ions on the PL of the N,S-CDs was monitored by recording the PL intensity of N,S-CDs in the presence and absence of various metal ions such as Na+, K+, Ca2+, Mn2+, Fe2+, Fe3+, Co2+, Cu2+, Zn2+, Ag2+, Hg2+, Pb2+, and Au3+ at the concentration of 200 μM. Apart from Au3+, no other metal ion showed significant effect on the PL intensity of N,S-CDs. This can be depicted in Fig. 5a. From this observation, we can conclude that the PL intensity of the N,S-CDs have specific response to Au3+. Hence, we have demonstrated the specific sensing of Au3+ by employing the N,S-CDs as the PL sensors. Further investigation on the potential of the N,S-CDs for the quantitative determination of Au3+ was carried out. In order to gauge the sensitivity of the prepared N,S-CDs as chemosensor, different concentration of Au3+ ranging from 0 to 180 μM were added to the aqueous solution of N,S-CDs and their PL intensity were measured. As shown in Fig. 5b, we can affirmatively confirm that on increasing the concentration of Au3+, the PL intensity of the N,S-CDs quenched. An acceptable linear correlation was exhibited over the concentration range 0–100 μM (Fig. 5c). The limit of detection (LOD) of N,S-CDs (according to the IUPAC standard, which was taken as (3 × standard deviation)/slope) for the detection of Au3+ was found to be 258 nM, which is compared with existing PL probes (Table S3 in the ESI†). Due to the presence of a plenty of surface functional groups such as amine, hydroxyl, carboxyl and thiol groups the N,S-CDs may exhibit specific affinity towards Au3+ ions. Since, the N,S-CDs are negatively charged (zeta potential = −32 mV), there is a great chance for electrostatic interaction between the N,S-CDs and Au3+ ions. The interaction between N,S-CDs and Au3+ ions may lead to the coordination-induced aggregation, which may be the reason for the observed PL quenching.41,46–49 The PL lifetime measurement is the most confirmatory method to find the nature of the quenching processes. So in this case, we have done PL lifetime quenching analysis in the presence and absence of different concentrations of Au3+ ions to confirm the nature of quenching. The PL lifetime of N,S-CDs are not quenched by the Au3+ ions as shown in the Fig. 5d. Hence, the PL lifetime analysis results confirms the ground state interaction between N,S-CDs and Au3+ ions.So that, the ground state complex formation may be the causal agent for the observed quenching phenomenon. The N,S-CDs-Au3+ solution, on standing for about 7 h produces yellowish shining flying glittering gold sparkles (Fig. 6). It indicates that the N,S-CDs are behaved as a reducing agent towards Au3+ ions.
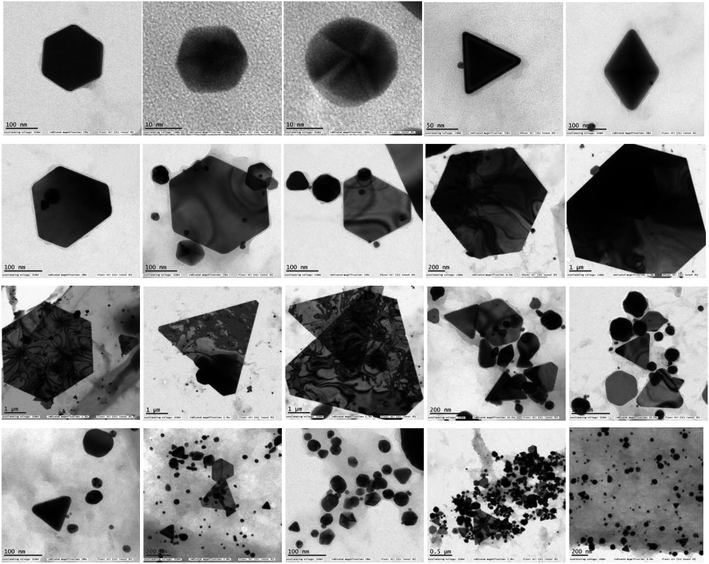
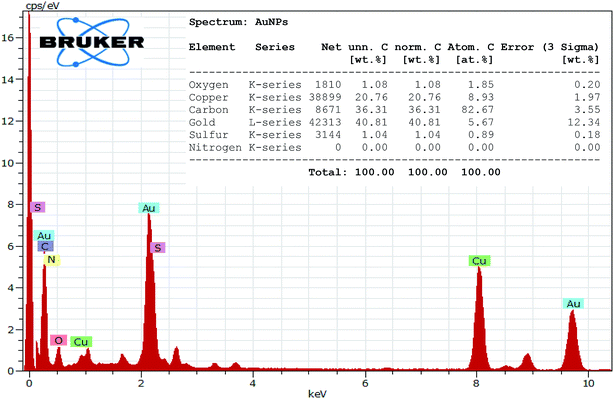
A portion of the solution in which the glittering flying gold particles were observed is filtered and drop casted on a carbon coated TEM grid and viewed through the TEM instrument. The TEM image analysis revealed the presence of Au NPs in diverse shapes such as triangular, truncated triangle, hexagonal, spherical and diamond like geometries (Fig. 7). Hence, it is inferred that the N,S-CDs are reducing the Au3+ ions initially to Au NPs. The Au NPs are then starts to agglomerate and growing in size to form the tiny gold particles. The chemical composition of Au NPs was examined by EDX technique (Fig. 8). The EDX spectrum of Au NPs shows the characteristic peaks of gold at 2.1 and 9.7 keV. Besides, the carbon and copper signals also appeared in the EDX spectrum due to the carbon-coated copper TEM grid utilized for the analysis. The crystallinity of Au NPs was revealed by the SAED pattern (Fig. S4 in the ESI†). After 24 h, the glittering tiny gold particles are settling down as it grown sufficiently larger to overcome the Brownian motion which was then separated from the solution (Fig. 6).
Conclusions
We have successfully synthesized highly luminescent N,S-CDs from goat hooves by a green and rapid one step microwave-assisted method. The synthetic method is an outright green one since the precursor is a bio-waste which is abundant, green, inexpensive and eco-friendly starting material. In addition, this method is suitable for synthesis of highly luminescent N,S-CDs in large-scale. The N,S-CDs are characterized well and their optical properties are discussed in detail. We have selectively sensed the Au3+ ions fluorimetrically by exploiting the selective response of N,S-CDs to Au3+ ions. We also utilized the reducing nature of the N,S-CDs to extract the Au3+ ions to metallic gold. It is noteworthy that the reduction is carried out at room temperature and in aqueous solution. We didn't use any other conventional reducing agent other than the N,S-CDs. We also found that the transformation from Au3+ ions to metallic gold is effected through the formation of Au NPs. We hope this strategy can open up a wide range of new potential applications of N,S-CDs in sensing cum extraction of Au3+ ions.Conflicts of interest
There are no conflicts to declare.Acknowledgements
The authors would like to express their gratitude to MRC, MNITJ India for XPS analysis. The authors are also grateful to Prof. S. Balakumar, Director, National Centre for Nanoscience and Nanotechnology (NCNSNT), University of Madras for Raman facilities. Authors also acknowledge DST PURSE programme for the zeta potential analysis facility.References
- M. Kato and Y. Okinaka, Gold Bull., 2004, 37, 37–44 CrossRef CAS
.
- S. J. Berners-Price and A. Filipovska, Metallomics, 2011, 3, 863–873 RSC
.
- G. Hutchings, Nat. Chem., 2009, 1, 584 CrossRef CAS PubMed
.
- M. D. Hughes, Y.-J. Xu, P. Jenkins, P. McMorn, P. Landon, D. I. Enache, A. F. Carley, G. A. Attard, G. J. Hutchings and F. King, Nature, 2005, 437, 1132–1135 CrossRef CAS PubMed
.
- E. D. Doidge, I. Carson, P. A. Tasker, R. J. Ellis, C. A. Morrison and J. B. Love, Angew. Chem., Int. Ed., 2016, 55, 12436–12439 CrossRef CAS PubMed
.
- W. D. Block and E. L. Knapp, J. Pharmacol. Exp. Ther., 1945, 83, 275–278 CAS
.
- J. Bloom, P. Thiem, L. Halper, L. Saunders and D. Morgan, J. Rheumatol., 1988, 15, 409–417 CAS
.
- M.-C. Daniel and D. Astruc, Chem. Rev., 2004, 104, 293–346 CrossRef CAS PubMed
.
- P. R. Sajanlal, T. S. Sreeprasad, A. K. Samal and T. Pradeep, Nano Rev., 2011, 2, 5883 CrossRef PubMed
.
- M. Sengani, A. M. Grumezescu and V. D. Rajeswari, OpenNano, 2017, 2, 37–46 CrossRef
.
- N. Elahi, M. Kamali and M. H. Baghersad, Talanta, 2018, 184, 537–556 CrossRef CAS PubMed
.
- Y.-C. Yeh, B. Creran and V. M. Rotello, Nanoscale, 2012, 4, 1871–1880 RSC
.
- C. Yue, H. Sun, W. J. Liu, B. Guan, X. Deng, X. Zhang and P. Yang, Angew. Chem., Int. Ed., 2017, 56, 9331–9335 CrossRef CAS PubMed
.
- S. Faraz, D. Hossna, B. Rezgar and Z. Piroz, Int. J. Min. Sci. Technol., 2014, 24, 537–542 CrossRef CAS
.
- Y. Yang, S. Liu, B. Xu, Q. Li, T. Jiang and P. Lv, in Rare Metal Technology 2015, Springer, 2015, pp. 55–62 Search PubMed
.
- A. Sheel and D. Pant, Bioresour. Technol., 2018, 247, 1189–1192 CrossRef CAS PubMed
.
- S. Ilyas and J. c. Lee, ChemBioEng Rev., 2014, 1, 148–169 CrossRef CAS
.
- S. Katsuta, Y. Watanabe, Y. Araki and Y. Kudo, ACS Sustainable Chem. Eng., 2015, 4, 564–571 CrossRef
.
- Y. Du and S. Guo, Nanoscale, 2016, 8, 2532–2543 RSC
.
- P. Zuo, X. Lu, Z. Sun, Y. Guo and H. He, Microchim. Acta, 2016, 183, 519–542 CrossRef CAS
.
- R. Wang, K.-Q. Lu, Z.-R. Tang and Y.-J. Xu, J. Mater. Chem. A, 2017, 5, 3717–3734 RSC
.
- S. N. Baker and G. A. Baker, Angew. Chem., Int. Ed., 2010, 49, 6726–6744 CrossRef CAS PubMed
.
- H. Xu, Q. Li, L. Wang, Y. He, J. Shi, B. Tang and C. Fan, Chem. Soc. Rev., 2014, 43, 2650–2661 RSC
.
- L. Wang, S.-J. Zhu, H.-Y. Wang, S.-N. Qu, Y.-L. Zhang, J.-H. Zhang, Q.-D. Chen, H.-L. Xu, W. Han and B. Yang, ACS Nano, 2014, 8, 2541–2547 CrossRef CAS PubMed
.
- H. Ding, J.-S. Wei and H.-M. Xiong, Nanoscale, 2014, 6, 13817–13823 RSC
.
- Y. Park, J. Yoo, B. Lim, W. Kwon and S.-W. Rhee, J. Mater. Chem. A, 2016, 4, 11582–11603 RSC
.
- Q. Xu, Y. Liu, C. Gao, J. Wei, H. Zhou, Y. Chen, C. Dong, T. S. Sreeprasad, N. Li and Z. Xia, J. Mater. Chem. C, 2015, 3, 9885–9893 RSC
.
- D. Sun, R. Ban, P.-H. Zhang, G.-H. Wu, J.-R. Zhang and J.-J. Zhu, Carbon, 2013, 64, 424–434 CrossRef CAS
.
- Q. Hu, M. C. Paau, Y. Zhang, X. Gong, L. Zhang, D. Lu, Y. Liu, Q. Liu, J. Yao and M. M. Choi, RSC Adv., 2014, 4, 18065–18073 RSC
.
- Y. Zhang and J. He, Phys. Chem. Chem. Phys., 2015, 17, 20154–20159 RSC
.
- J. Wang and J. Qiu, J. Mater. Sci., 2016, 51, 4728–4738 CrossRef CAS
.
- X. Li, M. Rui, J. Song, Z. Shen and H. Zeng, Adv. Funct. Mater., 2015, 25, 4929–4947 CrossRef CAS
.
- X. T. Zheng, A. Ananthanarayanan, K. Q. Luo and P. Chen, Small, 2015, 11, 1620–1636 CrossRef CAS PubMed
.
- S. Zhu, Y. Song, X. Zhao, J. Shao, J. Zhang and B. Yang, Nano Res., 2015, 8, 355–381 CrossRef CAS
.
- S. Liu, J. Tian, L. Wang, Y. Zhang, X. Qin, Y. Luo, A. M. Asiri, A. O. Al-Youbi and X. Sun, Adv. Mater., 2012, 24, 2037–2041 CrossRef CAS PubMed
.
- M. Xue, Z. Zhan, M. Zou, L. Zhang and S. Zhao, New J. Chem., 2016, 40, 1698–1703 RSC
.
- V. Ramanan, S. K. Thiyagarajan, K. Raji, R. Suresh, R. Sekar and P. Ramamurthy, ACS Sustainable Chem. Eng., 2016, 4, 4724–4731 CrossRef CAS
.
- V. Sharma, P. Tiwari and S. M. Mobin, J. Mater. Chem. B, 2017, 5, 8904–8924 RSC
.
- R. Das, R. Bandyopadhyay and P. Pramanik, Mater. Today Chem., 2018, 8, 96–109 CrossRef CAS
.
- J. Liao, Z. Cheng and L. Zhou, ACS Sustainable Chem. Eng., 2016, 4, 3053–3061 CrossRef CAS
.
- V. Ramanan, B. Siddaiah, K. Raji and P. Ramamurthy, ACS Sustainable Chem. Eng., 2018, 6, 1627–1638 CrossRef CAS
.
- K. Raji, R. Vadivel and P. Ramamurthy, New J. Chem., 2019, 43, 11710–11719 RSC
.
- A. C. Ferrari and J. Robertson, Phys. Rev. B: Condens. Matter Mater. Phys., 2000, 61, 14095 CrossRef CAS
.
- G. N. Nagaraju, Morphological studies and FT-IR analysis of skin and its appendages of wild animals, Karnataka Veterinary, Animal and Fisheries Sciences University, Bidar, 2012 Search PubMed
.
- S. K. Thiyagarajan, S. Raghupathy, D. Palanivel, K. Raji and P. Ramamurthy, Phys. Chem. Chem. Phys., 2016, 18, 12065–12073 RSC
.
- H. Gonçalves, P. A. Jorge, J. Fernandes and J. C. E. da Silva, Sens. Actuators, B, 2010, 145, 702–707 CrossRef
.
- W. Wang, T. Kim, Z. Yan, G. Zhu, I. Cole, N.-T. Nguyen and Q. Li, J. Colloid Interface Sci., 2015, 437, 28–34 CrossRef CAS PubMed
.
- T. Yang, F. Cai, X. Zhang and Y. Huang, RSC Adv., 2015, 5, 107340–107347 RSC
.
- N. Goswami, A. Giri, M. Bootharaju, P. L. Xavier, T. Pradeep and S. K. Pal, Anal. Chem., 2011, 83, 9676–9680 CrossRef CAS PubMed
.
Footnote |
| † Electronic supplementary information (ESI) available. See DOI: 10.1039/c9ra08050c |
| This journal is © The Royal Society of Chemistry 2019 |


