 Open Access Article
Effect of different-sizes of hydroxyapatite on the water resistance of magnesium oxychloride cement for bone repair
Xiali Guan†
 ab,
Gang Zhou†ab,
Yangyang Cuiab,
Jingjng Feiab and
Yubo Fan*abc
aSchool of Biological Science and Medical Engineering, Key Laboratory for Biomechanics and Mechanobiology of Ministry of Education, Beihang University, Beijing 100083, China. E-mail: yubofan@buaa.edu.cn; Fax: +86-10-82339428; Tel: +86-10-82339428
bBeijing Advanced Innovation Centre for Biomedical Engineering, Beihang University, Beijing, 102402, China
cShenzhen Research Institute, Beihang University, Shenzhen, 518057, China
First published on 26th November 2019
Abstract
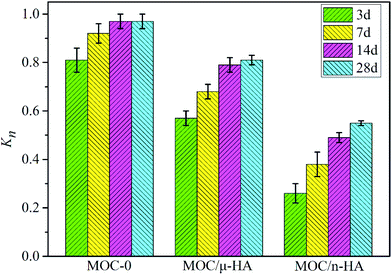
Magnesium oxychloride cement (MOC) has recently attracted significant attention due to its excellent mechanical properties and biological behavior. However, the applications of MOC have been limited by its poor water resistance. To solve this problem, micro-sized hydroxyapatite (μ-HA) and nano-sized hydroxyapatite (n-HA) were used to improve the water resistance of MOC. The microstructure, mechanical strength and tissue responses of three types of MOC were investigated. The results demonstrated that the lost strength of MOC-0, MOC/μ-HA and MOC/n-HA were 0.92 ± 0.04, 0.81 ± 0.02 and 0.55 ± 0.01 after immersing in SBF for 28 days. The contact angles of MOC-0, MOC/μ-HA and MOC/n-HA were 42.5 ± 4.76°, 50.3 ± 5.63° and 70.4 ± 6.59°, respectively. Compared to MOC-0 and MOC/μ-HA, the filling role of the n-HA in the cement was more favorable for the formation of 5 Mg(OH)2·MgCl2·8H2O (phase 5) and a dense microstructure. In addition, the histological evaluation displayed that MOC/n-HA enhanced the efficiency of new bone formation. It also showed good biocompatibility and biodegradability in vivo. And MOC/n-HA had better osteogenic performance. Therefore, MOC/n-HA could be used as a potential bone void filler for irregular bone defects in clinical applications.
1. Introduction
Bone defects are a global concern due to their high treatment costs1 and high incidence2 in the clinic. They2 are mainly caused by trauma, tumors, or infection (osteomyelitis). Foreign-body implants3 are the mainstay of reconstruction of large-segmental defects by providing a replacement for missing bone. These implants are particularly useful for areas requiring mechanical strength and structural support. As a result, enormous efforts have been put into developing bone cements of low cost and reliable methods for treatment of bone defects. Even though various types of bone cements have been applied in the clinic, the drawbacks of bone cements have also limited clinical development and widespread application. For example, the hardening process of polymethyl methacrylate (PMMA)4 is highly exothermic, which causes necrosis of the surrounding tissue. Calcium phosphate cements (CPCs)5 suffer from low mechanical strength and a low degradation rate. And magnesium phosphate cements (MPCs)6 release NH3 into the physiological environment and cause biocompatibility issues. Therefore, magnesium oxychloride cement (MOC)7 has recently drawn great attention due to its excellent mechanical properties and biological behavior.Magnesium oxychloride cement (MOC)7 was a type of non-hydraulic cement, which was formed by mixing powdered magnesium oxide (MgO) with a concentrated solution of magnesium chloride (MgCl2).8 During the last several decades, MOCs had extensively used for the fire protection,7 grinding wheels,8,9 and industrial flooring.10 Currently, Tan et al.9 displayed that MOC had properties that were relevant to biomedical applications. There mainly contained rapid hardening, high mechanical strength, good plasticity11 and good biocompatibility. Furthermore, there also were rheological properties of MOC that enabled the material to flow into irregular cavities. And some reports12–14 described that a large amount of Mg2+ and Cl− of MOC were eluted after immersion in water. These ions played an important role in life processes. Mg2+ participates in various metabolic activities and the reconstruction of bone. Cl− (ref. 14) maintains the dynamic balance of the human body. Thus, these excellent properties of MOC make it an excellent candidate as a potential bone substitute material. However, under MOC is immersed in water and moist environment for a long time, a large number of 5Mg(OH)2·MgCl2·8H2O (phase 5) and 3Mg(OH)2·MgCl2·8H2O (phase 3) are decompose into brucite (Mg(OH)2). MOCs become a highly porous structure due to the formation of Mg(OH)2.15 Besides, the porous structure significantly speeded up the water penetration rate, accelerating the deterioration of MOC16 and forming a vicious circle.17 Wei et al.12 indicated that the residual compressive strength of MOC paste cured for 3 days was reduced by about 90% after immersing in water for 28 days. Therefore, the applications of MOC had been limited by its poor water resistance. For this problem, there were a few methods had been used to improve the water resistance of MOC. He et al.18 observed that fly ash could improve the water resistance of MOC due to formation of amorphous gel formed by the reaction between fly ash and MOC. It showed that the strength loss rate of without fly ash was as much as 90% after 28 days of water immersion. After incorporating fly ash, the strength loss rate was at about 74%; Weng et al.19 demonstrated that the incorporation of 4% ferrous sulfate could increase the softening coefficient to 0.81. It showed that the FeSO4 could benefit the water resistance of MOC. Deng et al.20 studied on the effect mechanism for soluble phosphates on the water resistance of MOC. It could be found that the compressive strength of MOC paste hardened in air for 28 days decreased only by 15.5% after 3 months of water immersion after the addition of 0.5% H3PO4 and 5% K3PO4. As a result, adding water-soluble phosphate was an efficient method to improve the water resistance of MOC.
Hydroxyapatite (HA)21 is a kind of typical calcium-deficient apatite in the natural bone. It does not stimulate human tissues and is biocompatible. It has been used widely in the field of biomedical materials.22 However, μ-HA and n-HA have different effects on the properties of composites. Ignjatovic N L23 studies showed that n-HA were associated with a higher resorption rate than μ-HA. Our group previous study24 showed that HA dramatically induced transcriptional expression of the early osteoblast-related genes including cbfa1, ALP and COL1A1, as reflected by increased mRNA levels. Furthermore, n-HA (20–30 nm) preferred to induce osteoblast of rBMSC compared with μ-HA (200–250 nm). Thus, the size of HA played a very important role in the fate of stem cell. However, few researches had been done to study the effects of micro-/nano-sized of HA on water resistance of MOC. Therefore, μ-HA and n-HA are used as a second phase strengthen material to improve the water resistance of MOC.
In this work, the MOC was fabricated with MgO–MgCl2–H2O and micro/nano-sized HA particles. And its macro-mechanical performances like compressive strength, setting time, strength loss rate and contact angle were all investigated and analyzed, which indicated that the proposed MOC exhibits significant improvement of water resistance and show great potential in the treatment of bone defects in the future.
2. Materials and methods
2.1 Ethics statement
All experiments involving the use of animals were in compliance with Provisions and General Recommendation of Chinese Experimental Animals Administration Legislation, and were approved by Beijing Municipal Science & Technology Commission [Permit Number: SCXK (Beijing) 2006-0008 and SYXK (Beijing) 2006-0025].2.2 Materials
MgO9 produced from Mg(OH)2 after 700 °C calcination was crushed to powders with the fineness of 2610 cm2 g−1. MgCl2·6H2O was analytically pure (Tianjin Kermel Chemical Reagent, Tianjin, China). Based on a chemical precipitation method, the n-HA25 powders were prepared. The μ-HA powders were prepared using porcine trabecular bone after being degreased, deproteined, calcined and ball milling.26 And deionized water was employed as the solvent throughout the experiments.2.3 Methods
In this paper, the MOC-HA composites were named MOC-0, MOC/μ-HA, and MOC/n-HA. The MgCl2·6H2O/MgO molar ratio was 13![[thin space (1/6-em)]](https://www.rsc.org/images/entities/char_2009.gif) :
:![[thin space (1/6-em)]](https://www.rsc.org/images/entities/char_2009.gif) 1.15 The content of μ-HA and n-HA was 20 wt%. And the water-to-solid mass ratio was 0.30.15 Firstly, HA and MgO were blended to obtain powder M. Then MgCl2·6H2O was mixed with water and stirred evenly. Finally, the M was added with stirring and poured into a 10 mm × 10 mm × 10 mm mold. Specimens were cured under the condition with a relative humidity of 60 ± 5% and a temperature of 25 ± 2 °C. The setting time of MOC pastes was determined before the specimens solidified. And there was determined with a Gillmore Needle (Jinan Jianke test instrument, Jinan, China) under ISO standard 9597-1989E. The light and thick needle and the heavy and thin needle are used to measure the initial setting time and the final setting time, respectively.27 Besides, compressive strength of MOCs was measured with a Universal Testing Machine (Instron Corp., Canton, US) at 1, 3, 7, 14, and 28 days. The compressive strength is defined as the maximum stress that a material can withstand before failure in compression. Block specimens with a length of 10 mm, a width of 10 mm and a height of 10 mm are loaded with a constant crosshead speed of 0.5 mm min−1.28
1.15 The content of μ-HA and n-HA was 20 wt%. And the water-to-solid mass ratio was 0.30.15 Firstly, HA and MgO were blended to obtain powder M. Then MgCl2·6H2O was mixed with water and stirred evenly. Finally, the M was added with stirring and poured into a 10 mm × 10 mm × 10 mm mold. Specimens were cured under the condition with a relative humidity of 60 ± 5% and a temperature of 25 ± 2 °C. The setting time of MOC pastes was determined before the specimens solidified. And there was determined with a Gillmore Needle (Jinan Jianke test instrument, Jinan, China) under ISO standard 9597-1989E. The light and thick needle and the heavy and thin needle are used to measure the initial setting time and the final setting time, respectively.27 Besides, compressive strength of MOCs was measured with a Universal Testing Machine (Instron Corp., Canton, US) at 1, 3, 7, 14, and 28 days. The compressive strength is defined as the maximum stress that a material can withstand before failure in compression. Block specimens with a length of 10 mm, a width of 10 mm and a height of 10 mm are loaded with a constant crosshead speed of 0.5 mm min−1.28
The strength loss rate and the hydrophilic property of MOCs was determined using block samples. And the size of block samples was 10 mm × 10 mm × 10 mm. Firstly, the strength of test samples was R0 after 3 days in air. Then, the sample was immersed in simulate body fluid (SBF),29 which was prepared to have an ion concentration nearly equal to that of human blood plasma. And the soaking samples were held in a constant temperature water bath oscillator at 37 °C. The oscillation rate was 100 rpm. Besides, the SBF was changed every 3 days. Finally, the samples were removed from the SBF and rinsed with ethanol and dried after 3, 7, 14 and 28 days. The compressive strength, Rw, of soaking sample was measured. And the strength loss rate, Kn, was calculated according to the type (1). The hydrophilic property was evaluated by measuring the contact angle. Briefly, block samples of MOC were placed on the testing plate and kept smooth. 0.05 mL of distilled water was dropped slowly onto the surface of samples. The images of water drop on the composite materials were recorded by a camera software in the testing system after the droplet was stable. After that, the water contact angle was measured with the measuring tool in the testing system. Three different points of each sample were measured, and the average value was calculated.
 | (1) |
Six mixed specimens were prepared for the setting time, compressive strength and strength loss rate tests. And three different points of each sample were measured for the contact angle. In all cases, the average value was calculated.
2.4 Characterization
The chemical analysis of the complex was carried out by a Fourier transform infrared (FT-IR, PerkinElmer, USA) in the range from 4000 cm−1 to 400 cm−1 at 2 cm−1 resolution averaging 100 scan. The samples were characterized by X-ray diffraction (XRD) to identify the mineralogical compositions of the cement pastes. XRD measurements were performed, the samples were measured in the 2θ range from 10° to 80° (scan speed of 0.02° per second). The powder samples were prepared by crushing the block specimens and passing the powder through a sieve with a screen aperture of 75 mm. The microstructure of the gold-coated surface on MOC pastes at 3 days of air curing was characterized by a Hitachi model S-3500N scanning electron microscope (SEM, FEI250, USA). And the fractured surface on MOC pastes at 28 days soaking in SBF were characterized. The setting times of MOC pastes were determined with a Gilmore needle (Jinan Jianke test instrument, Jinan, China) according standard ASTMC266-89. The compressive strength was measured by a Universal testing machine (Instron Corp., Canton, USA) with a crosshead speed of 0.5 mm min−1. The water contact angles of samples were measured by VCA Optima surface analysis system (AST products, Billerica, MA).2.5 In vivo experiments
Five healthy female adult Sprague-Dawley (SD) rats, about six months, with average body weight 250 g, were chosen as models for studying the bone regeneration potential of MOC. General anesthesia was induced with an intraperitoneal injection of 10% chloral hydrate (3 mL kg−1).To eliminate errors of different animals, the μ-MOC and n-MOC were implanted in the same SD rats. The shinbone was exposed via a skin incision. A bone defect zone (1 mm diameter, 4 mm length) was created, and then the composite samples were randomly implanted into the defect, at last the musculature and skin incision were closed with nylon suture. Gentamicin (10 mg kg−1) was administered for 3 days after operation to prevent infection. SD rats were sacrificed at 12 weeks post-surgery. The tissue samples were fixed in 4% buffered paraformaldehyde, followed by decalcified and dehydrated through gradient ethanol, cleaned in xylene, and embedded with paraffin wax. Finally, the samples were cut into thin sections (5 μm in thickness) along the sagittal plane,30 and stained with masson (Sigma-Aldrich, Missouri, USA) for histological observation and histomorphological analysis. A cover glass was placed on the section surface after it was rinsed with H2O and dried. The thin sections on the cover glass were attached to a slide glass. Finally, the sections were observed under a light microscope (SMZ800&Ti-U, Nikon, Japan) for signs of degradation of implanted material and bone formation.
3. Results and discussion
3.1 FT-IR analysis
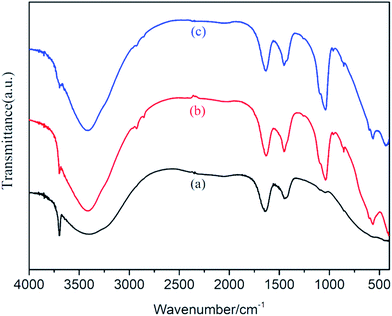
Fig. 1(a) demonstrated that the FTIR spectrum of MOC-0. The weak absorption peak at 1641 cm−1 was assigned to the bending band of O–H groups in crystal water. The high-frequency region (from 4000 to 2500 cm−1) consisted of two peaks at 3426 and 3700 cm−1, originating from the O–H9 stretching bands of water molecules and Mg(OH)2. The FT-IR patterns of MOC/μ-HA was shown in Fig. 1(b). The intensity for the O–H of Mg(OH)2 was decreased and the O–H of H2O was increased. Besides, the stretching vibration of the O–H band extended from 3675 cm−1 to 3683 cm−1. It suggested that the phase 5 gel in the MOC/μ-HA had accelerated polymerized and decomposition of phase 5 was decreased. It was reported17,18,20,31 that a large number of phase 5 were decomposed into Mg(OH)2, leading to MOC paste became a highly porous structure. And the formation of Mg(OH)2 caused the loss of strength and macroscopic cracking. As a result, the decrease of Mg(OH)2 enhanced the water resistance of MOC. Besides, the FTIR spectra illustrated the PO43− bands at 478, 561, 601, and 1032 cm−1 associated with HA. The PO43− mode was found that the bands at 561, and 601 cm−1 were assigned to different vibrations of PO43−. A band at 1032 cm−1 was assigned to a n3 (antisymmetric stretching) and that at 478 cm−1 to a n4 (out-of-plane bending) vibration.32 As Fig. 1(c), the PO43−-peaks and the O–H stretching vibration peaks were also observed in MOC/n-HA. There were no obvious changes about the peaks of MOC/n-HA compared with MOC/μ-HA. It indicated that MOC/n-HA and MOC/μ-HA were not difference in chemical groups. Thus, the incorporation of μ-HA and n-HA caused an obvious shift in the spectrum. MOC/μ-HA and MOC/n-HA existed the peaks of PO43− compared with MOC-0. It indicated that HA had been successfully incorporated into the MOC. For three types of MOC, the intensity for the O–H of Mg(OH)2 from MOC/n-HA was lowest and the O–H of H2O in phase 5 was highest. Therefore, the incorporation of n-HA might better improve the water resistance.3.2 XRD analysis
Fig. 2A displayed that the XRD pattern of three types of MOC curing 3 days in air. The XRD pattern of MOC-0 was shown in Fig. 2A(a). The result revealed that MOC essentially composed of crystalline phase 5 (PDF-07-0420), Mg(OH)2 (PDF-07-0239) and some amount of residual MgO (PDF-45-0946). Tan et al.33 demonstrated that high concentrations of MgO (MgO/MgCl2 molar ratio greater than 5) in MOC favored formation of phase 5. It was clearly seen that phase 5 was the main diffraction peaks in the XRD pattern. And the formation of phase 3 was not detected. Besides, there exhibited four major peaks for MgO phase at 2θ of 42.96°, 62.31°, 74.74° and 78.62°. Among them, the two MgO peaks in the MOC at 2θ of 42.96°, 62.31° were referred to residual MgO phase in cement pastes. Its hydration ratio was very slowly in air. Besides, the peak lines also contained the hydrolysis product Mg(OH)2. Wang et al.17 showed that the main product of phase 5 in MOC was unstable. Phase 5 was decomposed into Mg(OH)2, causing the poor water resistance of MOC. The XRD patterns of MOC/μ-HA and MOC/n-HA were presented in Fig. 2A(b) and (c), respectively. The characteristic patterns of HA (PDF-09-0432) at 2θ values of 25.94°, 32.03°, 39.87°, and 46.93° were observed in these XRD curves. There were ascribed to crystal planes (002), (300), (310), and (222) of crystalline n-HA, respectively. Thus, the main peak lines of MOC/μ-HA and MOC/n-HA were phase 5, Mg(OH)2, MgO and HA after incorporation of different sized of HA. Fig. 2A indicated that the primary characteristic peaks of MOC-0 consisted with the peak after incorporation into different sized of HA. However, there were some changed about the intensity of crystal in the MOC/μ-HA and MOC/n-HA compared with MOC-0. As Fig. 2A(b) and (c), the hydration product phase 5 of MOC/μ-HA and MOC/n-HA was decrease, and Mg(OH)2 was increased. Besides, the intensity of phase 5 from MOC/n-HA was higher than MOC/μ-HA. And the intensity of Mg(OH)2 in MOC/n-HA was lower than MOC/μ-HA. Therefore, μ/HA and n-HA had influence on the mineralogical composition of MOC cement pastes. It might cause the decrease in the early compressive strength of MOC/μ-HA and MOC/n-HA.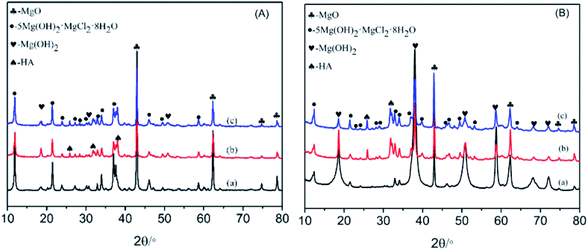 | ||
| Fig. 2 XRD patterns of hydration of MOC samples: (A) in air at 3 days (B) soaking in SBF at 28 days. (a) MOC-0; (b) MOC/μ-HA; (c) MOC/n-HA. | ||
Fig. 2B displayed that XRD patterns of three types of MOC after immersing in SBF for 28 days. The XRD pattern of MOC-0 was shown in Fig. 2B(a). After immersing in SBF for 28 days, diffraction peaks of phase 5, Mg(OH)2 and some amount of residual MgO were obviously seen. The XRD pattern of MOC/μ-HA was suggested in Fig. 2B(b). The main peak lines of MOC/μ-HA were phase 5, Mg(OH)2, MgO and incorporated HA. And likewise the XRD patterns of MOC/n-HA essentially composed of crystalline phase 5, Mg(OH)2, HA and some amount of residual MgO in Fig. 2B(c). However, there were some changes about the intensity of crystal in the MOC/μ-HA and MOC/n-HA compared with MOC-0 after immersing in SBF. The picture in Fig. 2B, the intensity of phase 5 were enhanced and that of Mg(OH)2 reduced after incorporation of different sized of HA. Besides, the diffraction peaks of phase 5 in MOC/n-HA was the strongest and that of Mg(OH)2 weakest compared to the other two types of MOC. It inferred that μ-HA and n-HA modified the water resistance. And the water resistance of the MOC/n-HA was better than that of MOC/μ-HA. Fig. 2A and B showed that XRD patterns of MOC cement curing 3 days in air and after immersing in SBF for 28 days, respectively. As previously mentioned, the crystal structure was no obvious change after immersing in SBF for 28 days compared with curing 3 days in air. However, the intensity of XRD pattern was changed due to crystallization behavior after immersing in SBF. From the intensity of XRD patterns analysis result, the diffraction peaks of MgO and phase 5 were decreased evidently and that of Mg(OH)2 were obviously increased after immersing in SBF for 28 days. It indicated that phase 5 of MOC was soluble and most of the unreacted MgO hydrated to Mg(OH)2 upon immersion in SBF. It contributed to poor water resistance of MOC cement. When MOC/μ-HA and MOC/n-HA immersed in SBF, the diffraction peaks of MgO and phase 5 were also decreased and Mg(OH)2 were still increased. However, the diffraction peaks intensity of phase 5 of MOC/n-HA still kept at more than 50% and that of Mg(OH)2 less than 40%. Therefore, n-HA inhibited the decomposition of phase 5 and crystal growth of Mg(OH)2 which improved water resistance of MOC.
3.3 SEM observation
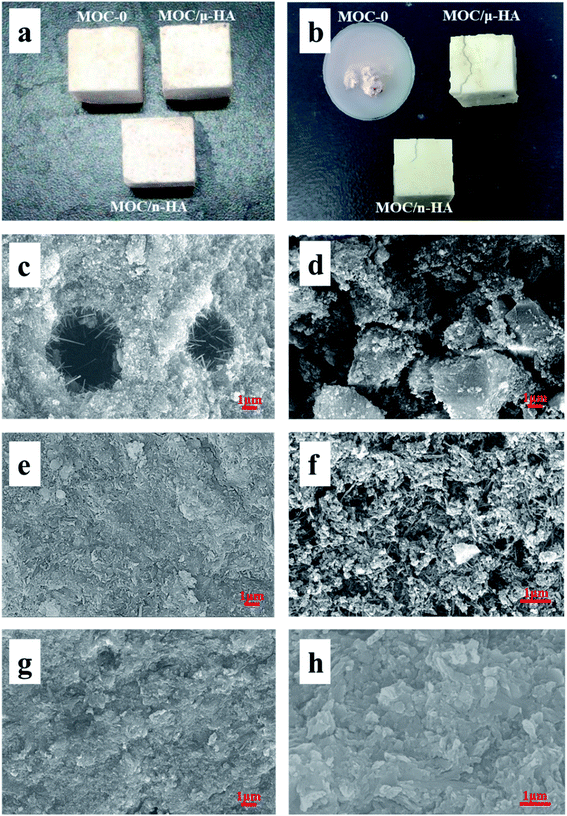
Fig. 3 presented that photographs, surface SEM and FESEM of three types of MOC. The photographs of three types MOC after curing at air for 3 days was demonstrated in Fig. 3(a). Macroscopically, there was no crack on the surface of the three types of MOCs after curing at air for 3 days. Fig. 3(b) displayed that the photographs of three types MOC after immersing in SBF for 28 days. MOC-0 was completely broken after immersing in SBF for 28 days. The surface of MOC/μ-HA was introduced many long cracks. And the surface of MOC/n-HA existed a few short cracks, and its length less than MOC/μ-HA. The result suggested that MOC-0 was easily corroded by liquid entering the structure center. And μ-HA and n-HA modified the water resistance of MOC. This improvement tended to be more obvious with the n-HA group. Fig. 3(c), (e) and (g) demonstrated that SEM of the surface on three types of MOC after curing at air for 3 days, respectively. The picture in Fig. 3(c), there were some large pores (about 10–30 μm) on the surface of the MOC-0. The phase 5 of MOC-0 formed rod-like crystals in pores. Besides, the pores were not interconnected with each other. According to Fig. 3(e), there were some small pores on the surface of MOC/μ-HA and the occasional crack as large as 5 microns. However, the size of pores in MOC/μ-HA was smaller than MOC-0. Fig. 3(g) showed SEM of the surface on MOC/n-HA curing at air for 3 days. There were almost no pores on the surface of the MOC/n-HA. The microstructure of MOC/n-HA was more compact than the others control samples. Therefore, μ-HA and n-HA penetrated partially into pores and capillaries of MOC and arranged directionally. Besides, n-HA had a much greater surface area per unit volume34 compared with the μ-HA, leading to n-HA more chemically reactive.Fig. 3(d), (f) and (h) showed that FESEM of three types of MOC after immersing in SBF for 28 days, respectively. The picture in Fig. 3(d), MOC-0 had been corroded by liquid entering the structure center. Fig. 3(f) displayed that the FESEM of MOC/μ-HA. The micro-structure of MOC/μ-HA was loosed due to a large number of needle-shaped phase 5 decomposed into Mg(OH)2 after immersing in SBF for 28 days. Besides, the formation of Mg(OH)2 caused a large number of pores to be distributed on the MOC/μ-HA. However, the pores and cracks on the MOC/μ-HA were decreased than MOC-0 after immersing in SBF for 28 days. Fig. 3(h) displayed that FESEM of MOC/n-HA. The micro-structure was more compact than MOC/μ-HA. There were no obvious pores and cracks of fracture surface. The result demonstrated that the surface morphology changed significantly before and after immersing in SBF. Besides, n-HA with a greater surface area penetrated more easily into the pores and capillaries of MOC compared with μ-HA. In addition, n-HA with chemically reactive improved surface characteristics of pores, reducing the probability of contact between internal structural materials and external water. Therefore, the water resistance MOC phases were obviously improved by n-HA.
3.4 Setting time
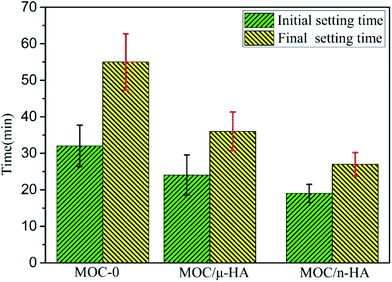
Fig. 4 displayed that setting time data of three types of MOC. Each value represented the average of six specimens. The clinical meaning of initial setting time is that it indicates the time from which the paste may not be deformed without damaging the structure of the solidifying cement. That of final setting time indicates the time from when the cement can be touched without scratching initial setting time. And the initial and final setting times are mainly affected by the water content, a particle size of powder and cement reactivity.35 According to the Fig. 4, the initial setting time of MOC-0 was 32 ± 5.7 min. And the final setting time was 55 ± 7.7 min. After incorporating μ-HA, the initial setting time and final setting time were about 24 ± 5.5 and 36 ± 5.3 min, respectively. When n-HA incorporation, the initial setting time and final setting time were only 19 ± 2.5 and 27 ± 3.2 min, respectively. The different results of setting time might be caused by the interaction of phases, changes in microscopic morphology, and chemical reactions of groups. Deng et al.20 suggested that the forming process of the phases in MOC pastes could be described as: neutralizing–hydrolyzing–crystallizing. The process of the hydrolyzing can be written as:
 | (2) |
When incorporating the μ-HA and n-HA, free OH− in MOC/μ-HA and MOC/n-HA was increased. It speeded up the equilibrium equation (type (2)) moving to the right direction. And promoted the formation of the hydrates. The result demonstrated that the setting time of MOC was decreased with incorporation of μ-HA and n-HA. For a mixture with the same water-to-solid ratio, the finer the powder size, and the shorter the setting times would be.36 Besides, Khairoun et al.37 studied that initial setting time must be more than 10 min for orthopedic applications. And the final setting time must be smaller than 30 min in clinical application. Thus, the setting time of MOC/n-HA was more satisfied clinical requirements than MOC/μ-HA.
3.5 Compressive strength
The compressive strength for three types of MOC after different curing times in air was shown in Fig. 5 (average compressive strength). Each value represented the average of six specimens. It indicated that the early strength of the mixtures increased with the increased of the curing time. Besides, the initial and later strength of MOC/μ-HA and MOC/n-HA were less than MOC-0. This was because the replacement of MgO decreased the quantity of the main hydration product (phase 5). Besides, the mechanical strength of MOC-0, MOC/μ-HA and MOC/n-HA after curing in air for 28 days were 118.3 ± 7.46 MPa, 103.2 ± 3.78 MPa and 110.9 ± 4.86 MPa, respectively. Table 1 displayed that mechanical properties of MOC-0, MOC/μ-HA, MOC/n-HA, and human cortical bone. Comparing with the data of human cortical bone, the compressive strength of three types of MOC was similar from that of compact bone38 (Strength of 80–180 MPa), and was much higher than that of cancellous bone39 (4–12 MPa). Therefore, the three types of MOCs were highly satisfied the strength requirements of the load-bearing parts of the human body. However, the cracked matrix significantly speeded up the water penetration rates due to its poor water resistance of MOC-0. As a result, MOC-0 was clearly not suitable as an implant and a biological material that required a certain degree of water resistance. However, the water resistance of MOC was modified by μ-HA and n-HA as XRD and SEM described. And the improvement of MOC/n-HA was more obvious. Therefore, MOC/n-HA could be used as a biomaterial for the treatment of bone defects.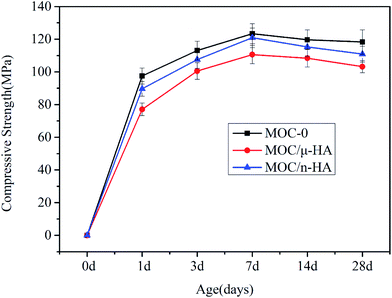 | ||
| Fig. 5 Compressive strength data for three types of MOC cement pastes after different curing times in air. | ||
3.6 Water resistance
| Series | The contact angle (°) |
|---|---|
| MOC-0 | 42.5 ± 4.76 |
| MOC/μ-HA | 50.3 ± 5.63 |
| MOC/n-HA | 70.4 ± 6.59 |
3.7 Histological evaluation
Fig. 8 presented that histological analysis of MOC/μ-HA and MOC/n-HA implanted into the bone defects of SD rat shinbones for 12 weeks. It was not seen inflammatory infiltration, pathological change and mild foreign body reaction of in the surrounding tissues of the composites cement and the recipient. Therefore, MOC/μ-HA and MOC/n-HA were biocompatible. Fig. 8(a) showed histological analysis of MOC/μ-HA on implant into the bone defects. In the MOC/μ-HA group, a few new bones were formed. And mineralized bone tissue tightly adhered to the implant. The HA particles and Mg2+ in MOC/μ-HA were probably responsible for its potential to be transformed into bone. Besides, the defects area had number of unevenly distributed pores (the white area). It suggested that MOC/μ-HA had been unbalanced degradation. Fig. 8(b) showed that histological analysis of MOC/n-HA on implant into the bone defects for 12 weeks. There was obvious osteogenesis between materials and fibrous tissue. Besides, a degradation of MOC/n-HA could be observed at the edge of the material. There was more balanced degradation than MOC/μ-HA. The result presented that MOC/μ-HA and MOC/n-HA had good biocompatibility, bioactive and biodegradability. The formation of new bone was observed on the surface of the injected both cements and progressed from the periphery toward the core of the defects. Though collagen organization with blue color in Masson's staining was significantly higher in the MOC/μ-HA, the degradation of the MOC/μ-HA was too fast to applied in clinic. Besides, MOC/n-HA remained more intact in vivo than MOC/μ-HA when implanted in vivo for 12 weeks. Therefore, MOC/n-HA was more suitable used as a potential bone void filler for irregular bone defect in clinical applications.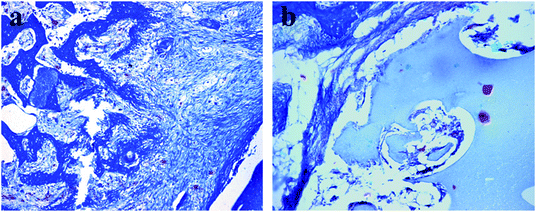 | ||
| Fig. 8 Typical histological images showing the interface between bone and cement. (a) MOC/μ-HA after 12 weeks; (b)MOC/n-HA after 12 weeks. (Original magnification ×200). | ||
4. Conclusions
MOC is sensitive to water, it was incorporated μ-HA and n-HA to improve its water resistance. The results showed that the crystalline phases of MOC showed no significant differences after the incorporation of μ-HA and n-HA. However, they have effect on the microstructure of MOC. Besides, the strength loss coefficient and the contact angle of MOC/μ-HA and MOC/n-HA are increased. μ-HA and n-HA significantly improves the water resistance. However, the n-HA in MOC is more favorable for the inhibition of Mg(OH)2 crystal growth and the formation of dense microstructure. And the water resistance and setting time of MOC/n-HA is better than that of MOC/μ-HA. Moreover, MOC/n-HA had good biocompatibility, bioactive and biodegradability. Therefore, MOC/n-HA could be developed as a bio-materials for treatments of bone defects.Conflicts of interest
There are no conflicts to declare.Acknowledgements
Thanks Michael Anderson (Department of neuroscience, School of medicine, Johns Hopkins University) for English editing. This research was financially supported by the National key research and development program (2016YFC1100704, 2016YFC1102203, 2017YFC0108505), the Fundamental Research Funds for the Central Universities (No. YWF-19-BJ-J-203), NSFC Research Grant (11827803, 11421202, 61227902, 31470901), National Key Technology R&D Program (No. 2014BAI11B15), Beijing Municipal Science and Technology Project (No. Z141107002514073), Beijing Municipal Administration of Hospitals Clinical Medicine Development of Special Funding (No. ZYLX201508), The Capital Health Research and Development of Special Funding (No. 2014-1-2091), the 111 Project of China (No. B13003) and Science, Technology and Innovation Commission of Shenzhen Municipality.References
- O. Ashman and A. M. Phillips, Treatment of non-unions with bone defects: Which option and why?, Injury, 2013, 44(suppl. S1), S43–S45 CrossRef PubMed.
- W. D. Hage, A. J. Aboulafia and D. M. Aboulafia, Incidence, location, and diagnostic evaluation of metastatic bone disease, Orthop. Clin. N. Am., 2000, 31(4), 515–528 CrossRef CAS PubMed.
- A. Saltz and U. Kandalam, Mesenchymal stem cells and alginate microcarriers for craniofacial bone tissue engineering: A review, J. Biomed. Mater. Res. A, 2016, 104(5), 1276–1284 CrossRef CAS PubMed.
- S. Aghyarian, X. Hu, R. Haddas, I. H. Lieberman, V. Kosmopoulos, H. K. W. Kim and D. C. Rodrigues, Biomechanical behavior of novel composite PMMA-CaP bone cements in an anatomically accurate cadaveric vertebroplasty model, J. Orthop. Res., 2017, 35(9), 2067–2074 CrossRef CAS PubMed.
- Y. Sakamoto, H. Ochiai, I. Ohsugi, Y. Inoue, Y. Yoshimura and K. Kishi, Mechanical Strength and In Vitro Antibiotic Release Profile of Antibiotic-Loaded Calcium Phosphate Bone Cement, J. Craniofac. Surg., 2013, 24(4), 1447–1450 CrossRef PubMed.
- Y. Tan, J. Dong and H. Yu, Study on the injectability of a novel glucose modified magnesium potassium phosphate chemically bonded ceramic, Mater. Sci. Eng., C, 2017, 79, 894–900 CrossRef CAS PubMed.
- B. Xu, H. Ma, C. Hu and Z. Li, Influence of cenospheres on properties of magnesium oxychloride cement-based composites, Mater. Struct., 2016, 49(4), 1319–1326 CrossRef CAS.
- L. Wang, K. Feng and X. Chen, Research on water resistance and mechanism of magnesium oxychloride cement foam concrete with compound modifiers, J. Funct. Mater., 2015, 46(12), 12009–12013 Search PubMed.
- Y. Tan, Y. Liu and L. Grover, Effect of phosphoric acid on the properties of magnesium oxychloride cement as a biomaterial, Cement Concr. Res., 2014, 56, 69–74 CrossRef CAS.
- A. K. Misra and R. Mathur, Magnesium oxychloride cement concrete, Bull. Mater. Sci., 2007, 30(3), 239–246 CrossRef CAS.
- J. Li, G. Li and Y. Yu, The influence of compound additive on magnesium oxychloride cement/urban refuse floor tile, Constr. Build. Mater., 2008, 22(4), 521–525 CrossRef.
- L. Wei, Y. Wang, J. Yu, J. Xiao and S. Xu, Feasibility study of strain hardening magnesium oxychloride cement-based composites, Constr. Build. Mater., 2018, 165, 750–760 CrossRef CAS.
- E. Watanabe, K. Kuchta, H. W. Rauwald, T. Kamei and J. Imanishi, Ionized Serum Magnesium Levels in Umbilical Cord Blood of Normal Pregnant Women at Delivery: Relationship to Calcium, Demographics, and Birthweight, Am. J. Perinatol., 1993, 10(5), 392–397 CrossRef PubMed.
- J. B. Matthews, J. A. Smith, K. J. Tally, C. S. Awtrey, H. Nguyen, J. Rich and J. L. Madara, Na-K-2Cl cotransport in intestinal epithelial cells. Influence of chloride efflux and F-actin on regulation of cotransporter activity and bumetanide binding, J. Biol. Chem., 1994, 269(22), 15703–15709 CAS.
- Z. Li and C. K. Chau, Influence of molar ratios on properties of magnesium oxychloride cement, Cement Concr. Res., 2007, 37(6), 866–870 CrossRef CAS.
- D. Deng, The mechanism for soluble phosphates to improve the water resistance of magnesium oxychloride cement, Cem. Concr. Res., 2003, 33(9), 1311–1317 CrossRef CAS.
- L. Wang, Study on the water resistance and mechanism of improving for magnesium oxychloride cement with phosphate and polymer, J. Funct. Mater., 2015, 46(13), 13066–13069 Search PubMed.
- P. He, C. S. Poon and D. C. W. Tsang, Effect of pulverized fuel ash and CO2 curing on the water resistance of magnesium oxychloride cement (MOC), Cement Concr. Res., 2017, 97, 115–122 CrossRef CAS.
- R. Weng, Study on the water resistance of the glass fiber reinforced magnesium oxychloride, J. Compos. Mater., 1998, 15(4), 28–32 Search PubMed.
- D. Deng, The mechanism for soluble phosphates to improve the water resistance of magnesium oxychloride cement, Cement Concr. Res., 2003, 33(9), 1311–1317 CrossRef CAS.
- A. A. White, S. M. Best and I. A. Kinloch, Hydroxyapatite–Carbon Nanotube Composites for Biomedical Applications: A Review, Int. J. Appl. Ceram. Technol., 2007, 4(1), 1–13 CrossRef CAS.
- A. Farzadi, F. Bakhshi, M. Solati-Hashjin, M. Asadi-Eydivand and N. A. A. Osman, Magnesium incorporated hydroxyapatite: synthesis and structural properties characterization, Ceram. Int., 2014, 40(4), 6021–6029 CrossRef CAS.
- N. L. Ignjatovic, Z. R. Ajdukovic, V. P. Savic and D. P. Uskokovic, Size effect of calcium phosphate coated with poly-DL-lactide-co-glycolide on healing processes in bone reconstruction, J. Biomed. Mater. Res., Part B, 2010, 94(1), 108–117 Search PubMed.
- Y. Huang, G. Zhou, L. Zheng, H. Liu, X. Niu and Y. Fan, Micro-/Nano-sized hydroxyapatite directs differentiation of rat bone marrow derived mesenchymal stem cells towards an osteoblast lineage, Nanoscale, 2012, 4(7), 2484–2490 RSC.
- G. Guo, Y. Sun, Z. Wang and H. Guo, Preparation of hydroxyapatite nanoparticles by reverse microemulsion, Ceram. Int., 2005, 31(6), 869–872 CrossRef CAS.
- Q. Huang, H. She, X. Xiao and R. Liu, Preparation and characterization of hydroxyapatite/polycaprolacton-chitosan composites, Acta Mater. Compositae Sin., 2009, 20(12), 2375–2383 Search PubMed.
- F. C. M. Driessens, M. G. Boltong, O. Bermudez and J. A. Planell, Formulation and setting times of some calcium orthophosphate cements: a pilot study, J. Mater. Sci.: Mater. Med., 1991, 4, 503–508 CrossRef.
- K. D. Kuehn, W. Ege and U. Gopp, Acrylic bone cements: mechanical and physical properties, Orthop. Clin. N. Am., 2005, 36(1), 29–39 CrossRef PubMed.
- T. Kokubo and H. Takadama, How useful is SBF in predicting in vivo bone bioactivity?, Biomaterials, 2006, 27(15), 2907–2915 CrossRef CAS PubMed.
- A. Loguidice, A. Houlihan and R. Deans, Multipotent adult progenitor cells on an allograft scaffold facilitate the bone repair process, J. Tissue Eng., 2016, 7, 2041731416656148 Search PubMed.
- J. M. Dong, H. F. Yu and Q. Q. Liu, The Study on Accelerated Life Mechanism of Glass Fiber Reinforced Magnesium Oxychloride Cement, Adv. Mater. Res., 2011, 306–307, 1118–1121 CAS.
- K. R. Seddon, A. Stark and M. J. Torres, ChemInform Abstract: Influence of Chloride, Water, and Organic Solvents on the Physical Properties of Ionic Liquids, ChemInform, 2000, 32(23), 2275–2287 Search PubMed.
- Y. Tan, Y. Liu, Z. Zhao, J. Z. Paxton and L. M. Grover, Synthesis and in vitro degradation of a novel magnesium oxychloride cement, J. Biomed. Mater. Res. A, 2015, 103(1), 194–202 CrossRef PubMed.
- R. Kanaparthy and R. Kanaparthy, The changing face of dentistry: nanotechnology, Int. J. Nanomed., 2011, 6, 2799–2804 CrossRef CAS PubMed.
- E. Ghiasvand, A. A. Ramezanianpour and A. M. Ramezanianpour, Effect of grinding method and particle size distribution on the properties of Portland-pozzolan cement, Constr. Build. Mater., 2014, 53, 547–554 CrossRef.
- O. M. Clarkin, D. Boyd, S. Madigan and M. R. Towler, Comparison of an experimental bone cement with a commercial control, Hydroset?, J. Mater. Sci.: Mater. Med., 2009, 20(7), 1563–1570 CrossRef CAS PubMed.
- I. Khairoun, M. G. Boltong, F. C. M. Driessens and J. A. Planell, Effect of calcium carbonate on the compliance of an apatitic calcium phosphate bone cement, Biomaterials, 1997, 18(23), 1535–1539 CrossRef CAS PubMed.
- K. Rezwan, Q. Z. Chen, J. J. Blaker and A. R. Boccaccini, Biodegradable and bioactive porous polymer/inorganic composite scaffolds for bone tissue engineering, Biomaterials, 2006, 27(18), 3413–3431 CrossRef CAS PubMed.
- B. L. Seal, T. C. Otero and A. Panitch, Polymeric biomaterials for tissue and organ regeneration, Mater. Sci. Eng., R, 2001, 34(4–5), 147–230 CrossRef.
- Z. Xia, T. Huynh, S.-g. Kang and R. Zhou, Free-Energy Simulations Reveal that Both Hydrophobic and Polar Interactions Are Important for Influenza Hemagglutinin Antibody Binding, Biophys. J., 2012, 102(6), 1453–1461 CrossRef CAS PubMed.
- V. V. Vasilevskaya, A. A. Klochkov, A. A. Lazutin, P. G. Khalatur and A. R. Khokhlov, HA (Hydrophobic/Amphiphilic) Copolymer Model? Coil? Globule Transition versus Aggregation, Macromolecules, 2004, 37(14), 5444–5460 CrossRef CAS.
Footnote |
| † The first two authors contributed equally to this work. |
| This journal is © The Royal Society of Chemistry 2019 |

