 Open Access Article
Environmental risk assessment in livestock manure derived biochars
Andong Wangabc,
Dongsheng Zouabc,
Liqing Zhangabc,
Xinyi Zengabc,
Hua Wangabc,
Longcheng Liabc,
Fen Liuabc,
Bo Renabc and
Zhihua Xiao *abc
*abc
aCollege of Bioscience and Biotechnology, Hunan Agricultural University, Changsha, Hunan 410128, P. R. China. E-mail: xiaozhihua@hunau.edu.cn; Fax: +86-731-84673603; Tel: +86-731-84673603
bKey Laboratory for Rural Ecosystem Health in Dongting Lake Area of Hunan Province, Changsha, Hunan 410128, P. R. China
cHunan Engineering Laboratory for Pollution Control and Waste Utilization in Swine Production, Changsha 410128, P. R. China
First published on 6th December 2019
Abstract
Livestock-manure-derived biochar is one of major products obtained from the pyrolysis of livestock manure. This study quantitatively assesses the pollution level and ecological risks associated with heavy metals in livestock manure and the biochar produced by its pyrolysis. The geo-accumulation index (GAI) values of heavy metals in livestock manure were significantly decreased (P < 0.05) and indicated to be at the grade of uncontaminated expected for Zn in pig-manure-derived biochar (PMB, 0.94, 800 °C) via pyrolysis. Therefore, Zn should be paid more attention in PMB. The risk factors (Eri) result shows that heavy metals in biochars were significantly decreased (P < 0.05) with increasing pyrolysis temperature. Potential ecological risk index values revealed that the integrated risks from the heavy metals were significantly decreased (P < 0.05) after pyrolysis. Similarly, the risk assessment code values indicated that the risks from the heavy metals in livestock-manure-derived biochars were significantly decreased (P < 0.05) after pyrolysis. In summary, pyrolysis represents an effective treatment method for livestock manure and can provide an effective method to reduce the risks of environmental pollution.
1. Introduction
The vigorous development of the livestock industry in China has brought enormous economic benefits but also causes severe environmental pollution. The annual production of livestock (including poultry) manure in China has reached 3.264 billion tons, which is 1.6 times the total emission of industrial solid wastes.1 Discharges of manure lead to environmental problems, such as odors rooting in the emission of toxic gases and pollution of waterways because of leaching and runoff of nurtures and heavy metals.2 Meanwhile, feedstock additives were used to prevent disease of animals and promote the growth of animals, resulting in high content of heavy metals in manures.3 Long term application of animal manures sustaining high concentrations of heavy metals can lead to elevating concentrations of soil heavy metals,4 which subsequently harms crop and humans through the food chain.5 Therefore, the appropriate management and treatment of livestock manure are issues of increasing concern.There are numerous treatment methods that can mitigate most of the toxic gas emissions and water pollution due to leaching of nutrients and heavy metals from livestock manure, such as composting, calcination,6,7 gasification,8 and pyrolysis.9 However, some of these techniques suffer from limitations and require further improvement, such as high temperature combustion and gasification, where the high contents of moisture and alkali metals in manure cause ash agglomeration.10 In contrast, pyrolysis operating at lower temperature compared with combustion and gasification, which reduces the risk of ash agglomeration and toxic emissions such as NOx, SO2, and particulate matter.11 And manure can be converted via pyrolysis into available energy and value-added biochar.9 Heavy metals in animal manures can be reapportion into the bio-oil, gas and solid (biochar) phases during pyrolysis, and this reapportion of heavy metals is dependent on experimental conditions.12 Moreover, the chemical speciation of heavy metals has been shown to be altered from active to more stable states during pyrolysis.13
Biochars prepared by livestock manure is the solid carbonaceous residue, which comes from the pyrolysis of livestock manure. The conversion of livestock manure to biochar has a variety of potential economic effectiveness, including agricultural waste reduction, fuel production, and carbon sink.14 Biochar can weaken the leaching of nurtures and heavy metals from soils,15,16 improve soil quality, and increase the pH of acidic soils.17 Furthermore, it can effectively adsorb pollutants from wastewater.18 However, the heavy metals already present in manure are not destroyed during pyrolysis and remain problematic.19 In addition, in terms of pollution adsorption, composite materials are exhibited specific selectivity, non-toxic, robust, and suitable material for high adsorption than biochar.20–22 Therefore, there is still a need to further improve the pyrolysis process of biochar.
Typical evaluation methods, such as bioavailability and ecotoxicity, geo-accumulation index (GAI), potential ecological risk index (PERI), and risk assessment code (RAC) were used to quantitative evaluation of heavy metals, which have been applied to the analysis of soil, groundwater,23 natural rivers, PM2.5 and PM10, mining areas, brick kiln bottom ashes, atmospheric deposition, and road-deposited sediments.24 These techniques have also been utilized to analyze residues from municipal sewage sludge and its liquefaction, compost, and pyrolysis25 in small-scale lab research, and have been rarely used to livestock-manure-derived biochar.26
To obtain more widespread grasp of the pollution level and underlying ecological risks of heavy metals in biochars, it is essential to perform a systematic and quantificational evaluation of heavy metals toxicity associated with this material. Therefore, the main objectives of the present study were (1) to assess the biological availability and ecotoxicity of heavy metals in livestock-manure-derived biochar, (2) to assess the degree of pollution by heavy metals using the GAI, and (3) to assess the underlying ecological risk using the RAC and PERI.
2. Materials and methods
2.1 Sampling collection and preprocessing
This study investigated two species of manure: pig manure (PM) and sheep manure (SM). The PM was obtained from a large pig farm in Changsha, Hunan. Most of pigs, alongside a small number of sows and piglets, are bred on this farm. The SM was collected from a peasant farm enterprise in Hunan. Sheep are representative reared in a decentralized manner, resulting in a low heavy metal concentration in the SM. Two manure samples were dried to constant weight in a dryer at 60 °C. Then, the samples after dried were mill and through a 100-mesh sieve. The obtained samples were stored in a drying apparatus before analysis.2.2 Pyrolysis procedure
Pyrolysis was implemented at a level of laboratory-scale cracking furnace (SK-G08123K, China). Pyrolysis was carried out according to previous research.9 The pyrolysis chamber was made up of a quartz tube (internal diameter = 72 mm, length = 1000 mm) and an electrically heating furnace with a programmable temperature controller. Temperature profiles were acquired using a thermocouple placed in the center of the reactor. The pyrolysis was conducted in the temperature range from 200 °C to 800 °C and pyrolysis samples were assigned codes according to their pyrolysis temperatures.The resulting biochar was ground and through a 100-mesh sieve. The produced samples were stored in a drying apparatus before analysis.
2.3 Sequential extraction
The sequential extraction method was used to investigate the chemical speciation distribution of Cd, Cr, Pb, Cu, Zn, Ni, and Mn in PM, SM, PMB, and SMB. A improved European Community Bureau of Reference (BCR) extraction procedure was employed as reported previously.27 The fractions obtained were as follows: fraction one (F1), acid soluble, fraction associated with carbonate and cation exchange sites; fraction two (F2), reducible, fraction associated with Fe–Mn oxides; fraction three (F3), oxidizable, fraction associated with organic matter and sulfides; fraction four (F4), residual residue. The total heavy metal concentration in PM, SM, livestock-manure-derived biochar, and F4 was determined using the same digestion method (hydrochloric acid, nitric acid, and perchloric acid). Reagent blanks and sample analytical duplicates were applied regularly to ensure the precision of the analysis. Heavy metals from BCR extraction were detected by high-performance Inductively Coupled Plasma Optic Emission Spectrometer (ICP-OES, Optima 8300, USA).2.4 Analytical procedures
 | (1) |
 | (2) |
| Eri = Tri × Cfi | (3) |
 | (4) |
3. Results and discussion
3.1 Bioavailability and ecotoxicity assessment
The bioavailabilities and ecotoxicities of the heavy metals and properties in the PM, SM, PMB, and SMB samples are presented in Tables 1 and 2. For PMB, the CDbio of Cr tended to decline with increasing pyrolysis temperature. However, the CDbio of Cd, Pb, Zn, Cu, Ni, and Mn increased with increasing temperature from 200 °C to 350 °C and then declined from 500 °C to 800 °C. For SMB, the CDbio of Cd, Cr, Pb, Ni, Zn, and Cu tended to decline with increasing pyrolysis temperature. The CDbio of Mn increased with increasing temperature from 200 °C to 350 °C and then declined from 500 °C to 800 °C.| Cd | Cr | Zn | Cu | Pb | Ni | Mn | |
|---|---|---|---|---|---|---|---|
| a Below the detection limits: CDbio = F1 + F2, CNbio = F3 + F4. | |||||||
| CDbio | |||||||
| PM | 0.45 ± 0.01 | 3.94 ± 0.51 | 476.16 ± 12.01 | 227.44 ± 10.01 | 7.92 ± 1.21 | 25.12 ± 0.25 | 342.48 ± 11.1 |
| PM 200 | 0.46 ± 0.02 | 3.69 ± 0.52 | 544.32 ± 11.01 | 292.48 ± 10.06 | 7.64 ± 0.12 | 25.60 ± 0.52 | 453.76 ± 10.5 |
| PM 350 | 0.67 ± 0.01 | 2.91 ± 0.41 | 402.48 ± 9.21 | 64.96 ± 0.56 | 8.24 ± 0.24 | 25.04 ± 0.48 | 343.84 ± 9.02 |
| PM 500 | 0.37 ± 0.03 | 2.28 ± 0.38 | 364.48 ± 5.06 | 17.36 ± 0.09 | 8.08 ± 0.26 | 24.08 ± 0.32 | 356.88 ± 8.21 |
| PM 650 | 0.21 ± 0.05 | 2.06 ± 0.29 | 350.20 ± 8.12 | 17.48 ± 0.08 | 7.20 ± 0.08 | 24.42 ± 0.26 | 311.28 ± 6.21 |
| PM 800 | 0.11 ± 0.01 | 1.39 ± 0.25 | 259.28 ± 10.05 | 12.96 ± 0.05 | 5.48 ± 0.06 | 22.76 ± 0.29 | 257.84 ± 5.31 |
| SM | 0.54 ± 0.06 | 2.94 ± 0.26 | 75.28 ± 0.85 | 1.60 ± 0.02 | 9.52 ± 0.01 | 24.72 ± 0.18 | 558.40 ± 10.1 |
| SM 200 | 0.73 ± 0.02 | 2.46 ± 0.19 | 80.16 ± 0.54 | 0.40 ± 0.01 | 9.30 ± 0.02 | 24.48 ± 0.19 | 552.40 ± 12.3 |
| SM 350 | 0.39 ± 0.01 | 2.52 ± 0.16 | 60.88 ± 0.48 | —a | 6.96 ± 0.05 | 23.28 ± 0.15 | 581.88 ± 11.2 |
| SM 500 | 0.06 ± 0.12 | 2.05 ± 0.23 | 46.88 ± 0.39 | —a | 6.00 ± 0.01 | 23.00 ± 0.23 | 632.64 ± 9.2 |
| SM 650 | 0.05 ± 0.04 | 1.64 ± 0.12 | 34.82 ± 0.26 | —a | 6.02 ± 0.01 | 22.80 ± 0.16 | 496.56 ± 7.12 |
| SM 800 | —a | 0.97 ± 0.13 | 24.02 ± 0.54 | —a | 2.66 ± 0.02 | 20.02 ± 0.17 | 302.48 ± 6.12 |
![[thin space (1/6-em)]](https://www.rsc.org/images/entities/char_2009.gif) |
|||||||
| CNbio | |||||||
| PM | 0.11 ± 0.01 | 9.53 ± 0.26 | 196.88 ± 1.2 | 350.00 ± 1.3 | 7.60 ± 0.05 | 25.24 ± 0.06 | 134.96 ± 0.12 |
| PM 200 | 0.15 ± 0.01 | 11.25 ± 0.32 | 207.20 ± 1.1 | 347.46 ± 1.2 | 9.36 ± 0.05 | 30.48 ± 0.07 | 78.48 ± 0.11 |
| PM 350 | 0.31 ± 0.02 | 20.77 ± 0.31 | 784.64 ± 1.0 | 944.48 ± 0.9 | 18.62 ± 0.07 | 63.52 ± 0.05 | 497.84 ± 1.0 |
| PM 500 | 0.75 ± 0.02 | 25.32 ± 0.28 | 976.56 ± 0.8 | 1160.66 ± 1.0 | 22.88 ± 0.08 | 77.28 ± 0.05 | 603.96 ± 0.9 |
| PM 650 | 0.89 ± 0.03 | 26.30 ± 0.19 | 1079.76 ± 1.2 | 1190.64 ± 0.8 | 24.72 ± 0.06 | 80.10 ± 0.05 | 671.68 ± 0.8 |
| PM 800 | 0.96 ± 0.01 | 28.13 ± 0.19 | 1179.60 ± 2.1 | 1250.80 ± 1.2 | 27.24 ± 0.06 | 85.48 ± 0.09 | 770.04 ± 0.86 |
| SM | 0.71 ± 0.03 | 10.38 ± 0.21 | 25.68 ± 0.09 | 15.84 ± 0.08 | 14.72 ± 0.09 | 26.56 ± 0.04 | 69.60 ± 0.75 |
| SM 200 | 0.65 ± 0.02 | 12.38 ± 0.18 | 32.32 ± 0.21 | 19.46 ± 0.07 | 16.72 ± 0.06 | 32.88 ± 0.05 | 143.44 ± 0.26 |
| SM 350 | 1.65 ± 0.11 | 20.14 ± 0.23 | 110.16 ± 1.0 | 29.56 ± 0.09 | 32.88 ± 0.05 | 62.88 ± 0.04 | 476.00 ± 1.1 |
| SM 500 | 2.15 ± 0.02 | 23.93 ± 0.17 | 144.20 ± 2.1 | 33.88 ± 0.06 | 39.48 ± 0.06 | 75.80 ± 0.07 | 583.52 ± 0.96 |
| SM 650 | 2.38 ± 0.11 | 27.47 ± 0.15 | 178.46 ± 1.3 | 37.60 ± 0.05 | 44.50 ± 0.04 | 87.56 ± 0.06 | 839.32 ± 0.86 |
| SM 800 | 2.48 ± 0.15 | 29.36 ± 0.16 | 198.44 ± 0.2 | 59.44 ± 0.06 | 50.47 ± 0.06 | 95.14 ± 0.08 | 1096.08 ± 1.1 |
| BV | 0.08 | 64 | 90 | 25 | 26 | 30 | 380 |
| Material | T (°C) | Char yield (%) |
|---|---|---|
| a Char yield = (biochar mass/raw stuff mass) × 100. | ||
| PM | Material | 100 |
| 200 | 87.58 | |
| 350 | 54.68 | |
| 500 | 46.80 | |
| 650 | 45.10 | |
| 800 | 42.95 | |
| SM | Material | 100 |
| 200 | 86.83 | |
| 350 | 56.11 | |
| 500 | 48.66 | |
| 650 | 43.27 | |
| 800 | 41.07 | |
In this study, the CDbio of Cr, Pb, and Ni tended to decrease with increasing pyrolysis temperature. Some previous studies have indicated that heavy metals are fractionated and volatilized during pyrolysis.43 The CDbio of heavy metals in biochar tends to increase with increasing pyrolysis temperature. This phenomenon may be attributable to the more stable organic matter generated with an increasing pyrolysis temperature and the stronger adsorption of the livestock-manure-derived biochars.44,45 Because pigs and sheep are fed differently, the CDbio values of the heavy metals in PM and PMB are different from those in SM and SMB. This finding is compliance with the results of a previous research.46 The CDbio of Cd in biochar tended to decrease with increasing pyrolysis temperature from 500 °C to 800 °C. This result may be due to fractional distillation and devolatilization of Cd. Previous studies have reported that Cd evaporates with increasing pyrolysis temperature.47 Cadmium chloride, produced by the combination of Cd and chloride, is the major Cd species in the vapor phase during pyrolysis.48,49 In this study, the bioavailability and ecotoxicity of Pb in livestock-manure-derived biochars was reduced after pyrolysis. This result may be due to Pb make up more chlorides than other elements.50–52 The CDbio of Cr tended to decrease with increasing pyrolysis temperature. However, the CNbio of Cr appeared to increase due to agglomeration. This is likely attributable to the low chlorine content during the pyrolysis process and the high concentration of Cr in the concentrated material.53–55 Similar results were observed for Cu and Ni as for Pb. The bioavailability and ecotoxicity of Cu reduced in PMB. The bioavailability and ecotoxicity of Ni reduced in SMB. This is likely attributable to sulfur in the feedstock may combine with Cu and Ni to produce metal sulfides and sulfates.56 Cu and Ni Sulfides have a lower volatility,54 and are likely to cause Cu and Ni to agglomerate in the condensed phase. The manure is subjected to pyrolysis, the surface properties and material affinity of the material affect its adsorption capacity and adsorption process.57–59 Therefore, the bioavailability and ecotoxicity of heavy metal in biochars was affected. In summary, the results demonstrate that pyrolysis is an effectually method for reducing the toxicity of heavy metals.
3.2 Contamination degree based on GAI
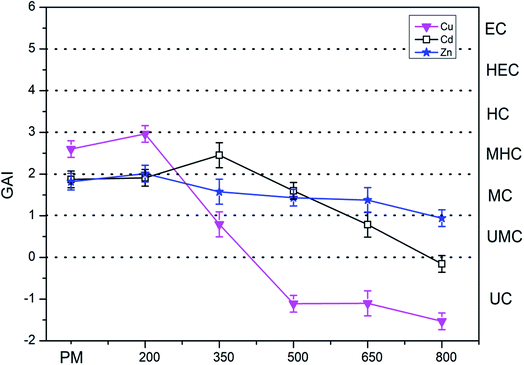
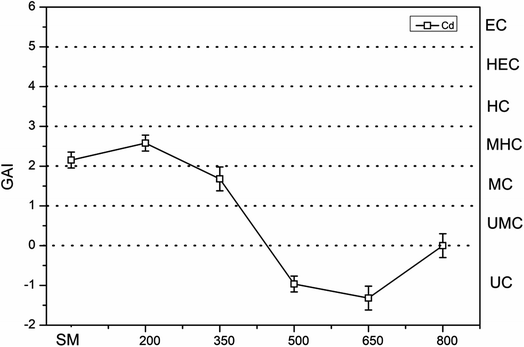
The GAI was used to assess the degree of metal pollution in PM, SM, PMB, and SMB. The GAI value of the heavy metals in PM, PMB, SM, and SMB are presented in Fig. 1 and 2. The GAI results for Ni, Pb, and Cr in PM and PMB were below 0, corresponding to UC. Similarly, the GAI values for Cr, Zn, Cu, Pb, and Ni in SM and SMB were below 0 (UC).For PM, the GAI results for the heavy metals were in the order of Cu (2.60) > Cd (1.87) > Zn (1.81), which correspond to grades of MC for Cd and Zn and MHC for Cu. For PMB, the GAI values for Cu, Cd, and Zn increased after pyrolysis at 200 °C compared with those in PM. The GAI values of Cu and Zn decreased with increasing pyrolysis temperature from 200 °C to 800 °C. However, the GAI of Cd initially increased with increasing pyrolysis temperature from 1.91 at 200 °C to 2.45 at 350 °C and thereafter started to decrease. The GAI values of Cu in PMB samples obtained at pyrolysis temperatures from 500 °C to 800 °C were all less than zero, corresponding to UC. Meanwhile, the GAI values of Cd in PMB were 1.59 and 0.78 at 500 °C and 650 °C, respectively. These results correspond to grades of MC for Cd and UMC for Cd in PMB. The GAI values of Zn in PMB samples obtained at pyrolysis temperatures of 500 °C, 650 °C, and 800 °C were 1.43 (MC), 1.37 (MC), and 0.94 (UMC), respectively. These results indicate that the levels of Zn in PMB should be monitored.
For SMB, the GAI of Cd in SMB increased after pyrolysis at 200 °C compared with that in SM. The GAI of Cd in SMB decreased from 1.68 at 350 °C to −1.31 at 650 °C. Upon further increasing the pyrolysis temperature to 800 °C, the GAI of Cd in SMB increased. In general, the GAI values of Cd in SMB samples obtained at pyrolysis temperatures from 500 °C to 800 °C were all under 0 (UC).
The reason that the GAI value of Cd in biochars was increased at 200 °C and thereafter decreased with increasing pyrolysis temperature was because of the decrease in volume of biochar during the pyrolysis at 200 °C result in the content of Cd increased. Subsequently, the Cd volatilization with increasing pyrolysis temperature.60 Overall, the degree of contamination by heavy metals was mitigated by pyrolysis treatment. The GAI results for Cd, Cu, and Zn in PM were categorized as MC, MHC, and MC, separately. In contrast, the GAI results for Cd, Cu, and Zn in PMB after pyrolysis at 800 °C were classified as UC, UC, and UMC. Furthermore, the degree of contamination by Cd in SMB changed from UMC to UC upon increasing the pyrolysis temperature. Therefore, pyrolysis can effectively decrease the contamination grade at 800 °C.
3.3 Potential ecological risk assessment based on PERI
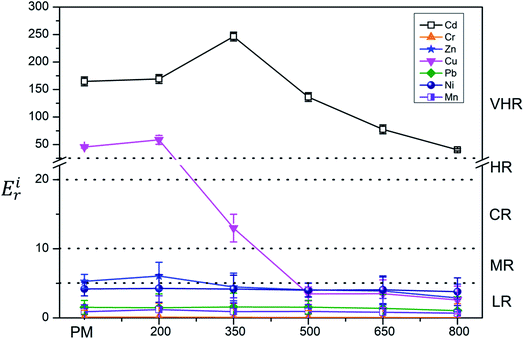
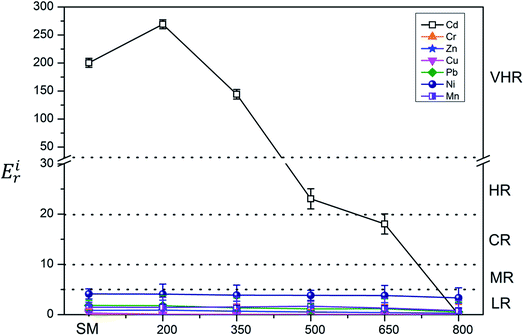
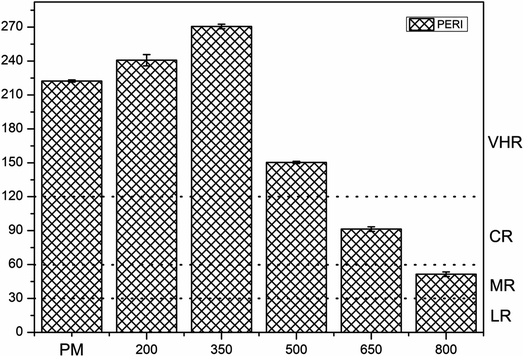
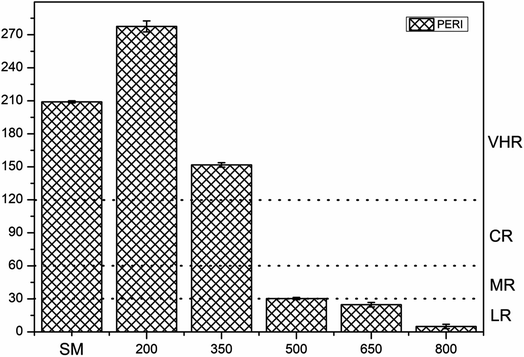
The ecological risk assessment consequence of the heavy metals in the samples are shown in Fig. 3 and 4. The result shown that the risk indices (Eri) of the heavy metals in PM were ranked in the following order: Cd > Cu > Zn > Ni > Pb > Mn > Cr. The Eri values of Cd and Cu in PM were 164.85 and 45.48, respectively, corresponding to VHR, which should be of major concern. The Eri of Zn in PM was 5.29, indicating MR to the local environment. The Eri values of Ni, Pb, Mn, and Cr in PM were all below 5, suggesting LR to the local environment. However, the Eri values of Ni, Pb, Mn, and Cr in PMB were all below 5, indicating LR to the local environment. The Eri of Zn in PMB at 200 °C was 6.04, suggesting MR to the local environment. However, at higher pyrolysis temperatures, the Eri values of Zn in PMB were all below 5, indicating LR. The Eri values of Cu in PMB at 200 °C and 350 °C were 58.49 and 12.99, respectively, corresponding to VHR and CR to the local environment. The Eri values of Cd in PMB were all above 40, indicating VHR. Therefore, the treatment of Cd requires urgent attention. For SMB, the Eri values of all of the other heavy metals except Cd were below 5, suggesting LR to the environment. The Eri values of Cd at 200 °C, 350 °C, 500 °C, and 650 °C were 269.18 (VHR), 144.23 (VHR), 23.05 (HR), and 18.04 (CR), respectively. The reasons that the Eri values of Cd came under very high risk was because of relatively higher concentration of heavy metals in biochars with increasing pyrolysis temperature. Cd began to transfer to the off-gas and could not be prevented, while Cr, Ni, Cu, Zn, and Pb were retained quantitatively in the char during pyrolysis at temperatures up to 750 °C.61 In conclusion, the Eri values of the heavy metals in the biochars declined with increasing pyrolysis temperature. Pyrolysis temperature above 350 °C be regarded as the optimum condition. Therefore, pyrolysis temperature at 800 °C can provide an available method for reducing the risks of heavy metals.To quantitate the overall underlying ecological risk from the heavy metals in PM, PMB, SM, and SMB, the PERI was calculated as the total of all seven risk factors. Descriptive statistics of PERI are also summarized in Fig. 5 and 6. The PERI values of the heavy metals in PM and SM were 222.37 and 208.99, respectively, which correspond to VHR. After pyrolysis, the PERI values of PMB remained VHR at 200 °C, 350 °C, and 500 °C, although they decreased with increasing pyrolysis temperature from 650 °C to 800 °C. At pyrolysis temperatures of 650 °C and 800 °C, the PERI values were classified as CR and MR, respectively. Similarly, after pyrolysis treatment, the PERI values of SMB remained VHR at 200 °C and 350 °C and declined with increasing pyrolysis temperature from 500 °C to 800 °C. At pyrolysis temperatures of 500 °C, 650 °C and 800 °C, the PERI values were classified as LR. These results demonstrate that the PERI of biochar also decreases with increasing pyrolysis temperature. Pyrolysis temperature above 650 °C be regarded as the optimum condition. PERI values can be used to describe the susceptibility of the local ecosystem to toxic heavy metals and indicate the ecological risk resulting from the overall pollution.62 For PM, SM, PMB, and SMB, the element Cd was found to be responsible for most of the total risk. It can be concluded that the high ecological risk of PM, SM, PMB, and SMB can be primarily attributed to Cd.
3.4 Environmental risk assessment based on RAC
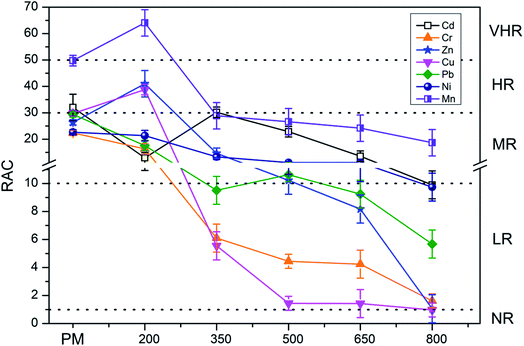
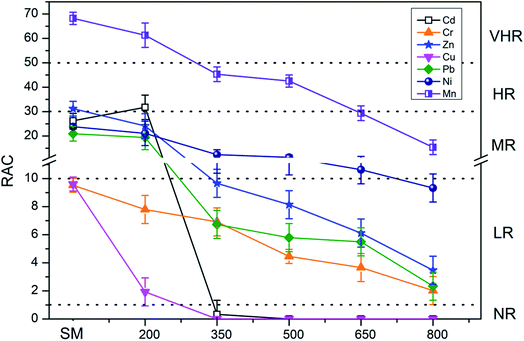
Fig. 7 and 8 present the environmental risk evaluation results according to the RAC. For PM, the RAC of Mn was classified as VHR, whereas the RAC values of Cr, Pb, Zn, Cu, and Ni indicated MR and the RAC of Cd indicated HR. The RAC values of PMB also decreased with increasing pyrolysis temperature. After pyrolysis, the classification of the RAC of Mn in PMB decreased to HR. The RAC values of Cd, Cr, Zn, Ni, and Pb in PMB were 9.90%, 1.62%, 1.05%, 9.74%, and 5.67%, indicating LR to the local environment. The RAC of Cu in PMB was 0.97%, suggesting NR to the local environment.For SM, the RAC of Mn indicated VHR, whereas the RAC values of Zn, Cd, Ni, and Pb indicated MR and the RAC values of Cu and Cr indicated LR. Similarly, the RAC values of SMB decreased with increasing pyrolysis temperature. After pyrolysis, the RAC of Mn in SMB was 15.39%, suggesting MR to the environment. Meanwhile, the RAC values of Ni, Zn, Pb, and Cr in SMB were 9.32%, 3.47%, 2.33%, and 2.02%, respectively, indicating LR to the environment, and the RAC values of Cu and Cd were 0, suggesting NR to the local environment. Heavy metals were categorized as the F2 fraction when bounded with Fe and Mn oxides and as the F3 fraction when bounded with organic matters and sulfides. When the content of Fe and Mn oxides, organic matter, and sulfides vary in biochars with increasing pyrolysis temperature, the heavy metal F2 and F3 extraction fractions can convert to other fractions, potentially leading to changes in the F1 fraction (the most unstable fraction).41 Overall, the RAC values indicate that the risk from heavy metals decreases with increasing pyrolysis temperature. Pyrolysis temperature above 500 °C be regarded as the optimum condition.
3.5 Comparison of assessment results based on GAI, PERI, and RAC
Comparison of the assessment results according to GAI, PERI, and RAC values revealed several inconsistencies between the three classifications with respect to evaluating heavy metal pollution in PM, SM, and livestock-manure-derived biochar. According to the GAI evaluation, the Cu in PM was classified as MHC. However, the Eri of the Cu in PM was classified as VHR. Furthermore, according to the GAI evaluation, the Cd in SM was classified as MHC, whereas the RAC indicated a HR due to the high percentage of Cd in the acid-soluble/exchangeable fraction (F1). In addition, the Cd in PMB was classified as VHR based on Eri and as MR based on the RAC. Similarly, the Cd in SMB was classified as LR based on Eri and as NR based on the RAC.These inconsistencies can be explained as follows. The GAI considers only the accumulation levels of individual heavy metals without regard to their toxicity response factor. The PERI can be used to describe both the ecological risks caused by a single contamination and the integrated risk or pollution from multiple contaminations.39 The RAC considers only the percentage of each pollutant in the F1 fraction, ignoring the percentage in the reducible fraction (F2). In contrast with the RAC, both the GAI and PERI consider the sum of metals bound to F2. Thus, it is essential to consider the results of all three assessment methods when attempting to evaluate the environmental impact, as this allows more integrated and accurate evaluation results to be obtained.
4. Conclusion
According to the results of bioavailability, ecotoxicity, and GAI, the risks of heavy metals in livestock-manure-derived biochar were decreased after pyrolysis. The PERI results demonstrated that increasing the pyrolysis temperature, results in the content of heavy metal in biochars decreased, reducing its the risk of contamination. The toxicity of the heavy metals also decreased with increasing pyrolysis temperature. However, according to the potential ecological risk analysis, the Cd in PMB still presents a VHR to the local environment. Therefore, the removal of Cd from PMB should be addressed. In summary, pyrolysis can be used to mitigate the toxicity and environmental risk of heavy metals in livestock-manure-derived biochar when pyrolysis temperature above 350 °C. Furthermore, pyrolysis temperature at 800 °C can provide an effective method for treating agricultural waste.Conflicts of interest
There are no conflicts to declare.Acknowledgements
This research was financially supported by the National Key Research and Development Programs of China (Grant No. 2017YFD0301505 and 2018YFC0213300), the Natural Science Foundation of Hunan Province, China (Grant No. 2018JJ3222 and 2017NK2383), the Special Fund for Local Scientific and Technological Development under the Leadership of the Central Government (Grant No. 2017CT5010), the Science Foundation of Hunan Education Department, China (Grant No. CX2017B386, 18B097, CX2018B405 and S201910537053) and the Double First-class Construction Project of Hunan Agricultural University (Grant No. kxk201801007, YB2018005, 18QN19, SYL2019025, SYL2019026).References
- Z. Tian, B. U. Meidong and G. Wei, Chinese J. Ecol., 2012, 31, 1241–1249 Search PubMed.
- N. Zhu, Bioresour. Technol., 2006, 97, 1870–1875 CrossRef CAS PubMed.
- W. Ouyang, X. Xu, Z. Hao and X. Gao, J. Hydrol., 2017, 546, 71–80 CrossRef CAS.
- M. Hamidpour, E. Khadivi and M. Afyuni, Environ. Earth Sci., 2016, 75, 1037 CrossRef.
- X. Zeng, D. Zou, A. Wang, Y. Zhou, Y. Liu, Z. Li, F. Liu, H. Wang, Q. Zeng and Z. Xiao, J. Environ. Manage., 2020, 255, 109885 CrossRef PubMed.
- Z. Xiao, X. Yuan, H. Li, L. Jiang, L. Leng, X. Chen, G. Zeng, F. Li and L. Cao, Sci. Total Environ., 2015, 536, 774–783 CrossRef CAS PubMed.
- Z. Xiao, X. Yuan, L. Jiang, X. Chen, H. Li, G. Zeng, L. Leng, H. Wang and H. Huang, Energy, 2015, 91, 441–450 CrossRef CAS.
- C. Liu, Q. Tong, Y. Li, N. Wang, B. Liu and X. Zhang, RSC Adv., 2019, 9, 4488–4498 RSC.
- X. Zeng, Z. Xiao, G. Zhang, A. Wang, Z. Li, Y. Liu, H. Wang, Q. Zeng, Y. Liang and D. Zou, J. Anal. Appl. Pyrolysis, 2018, 132, 82–93 CrossRef CAS.
- Y. Niu, H. Tan and S. Hui, Prog. Energy Combust. Sci., 2016, 52, 1–61 CrossRef.
- W.-J. Liu, W.-W. Li, H. Jiang and H.-Q. Yu, Chem. Rev., 2017, 117, 6367–6398 CrossRef CAS PubMed.
- Q. Lin, X. Xu, L. Wang, Q. Chen, J. Fang, X. Shen, L. Lou and G. Tian, Front. Environ. Sci. Eng., 2017, 11, 5 CrossRef.
- J. Meng, L. Wang, L. Zhong, X. Liu, P. C. Brookes, J. Xu and H. Chen, Chemosphere, 2017, 180, 93–99 CrossRef CAS PubMed.
- K. B. Cantrell, T. Ducey, K. S. Ro and P. G. Hunt, Bioresour. Technol., 2008, 99, 7941–7953 CrossRef CAS PubMed.
- Y. Wang, B. Zhong, M. Shafi, J. Ma, J. Guo, J. Wu, Z. Ye, D. Liu and H. Jin, Chemosphere, 2019, 219, 510–516 CrossRef CAS PubMed.
- L. He, H. Zhong, G. Liu, Z. Dai, P. C. Brookes and J. Xu, Environ. Pollut., 2019, 252, 846–855 CrossRef CAS PubMed.
- R. SHI, J. LI, N. NI and R. XU, J. Integr. Agric., 2019, 18, 1508–1517 CrossRef CAS.
- H. Nacke, A. C. Gonçalves, M. A. Campagnolo, G. F. Coelho, D. Schwantes, M. G. Dos Santos, D. L. Briesch and J. Zimmermann, Open Chem., 2016, 14, 103–117 CAS.
- L. Li, D. Zou, Z. Xiao, X. Zeng, L. Zhang, L. Jiang, A. Wang, D. Ge, G. Zhang and F. Liu, J. Cleaner Prod., 2019, 210, 1324–1342 CrossRef CAS.
- M. R. Awual, N. H. Alharthi, M. M. Hasan, M. R. Karim, A. Islam, H. Znad, M. A. Hossain, M. E. Halim, M. M. Rahman and M. A. Khaleque, Chem. Eng. J., 2017, 324, 130–139 CrossRef CAS.
- M. R. Awual, J. Environ. Chem. Eng., 2019, 7, 103124 CrossRef CAS.
- M. R. Awual, Mater. Sci. Eng., C, 2019, 101, 686–695 CrossRef CAS PubMed.
- Z. Xiao, X. Yuan, L. Leng, L. Jiang, X. Chen, W. Zhibin, P. Xin, Z. Jiachao and G. Zeng, Environ. Sci. Pollut. Res., 2016, 23, 3934–3942 CrossRef CAS PubMed.
- F. Li, J. Zhang, W. Liu, J. Liu, J. Huang and G. Zeng, Sci. Total Environ., 2018, 644, 649–660 CrossRef CAS PubMed.
- F. Li, J. Zhang, C. Liu, M. Xiao and Z. Wu, Process Saf. Environ. Prot., 2018, 116, 169–179 CrossRef CAS.
- A. Makara, Z. Kowalski and A. Saeid, Open Chem., 2017, 15, 19–27 CAS.
- Z. Xiao, X. Yuan, H. Li, L. Jiang, L. Leng, X. Chen, G. Zeng, F. Li and L. Cao, Sci. Total Environ., 2015, 536, 774–783 CrossRef CAS PubMed.
- T. G. Kazi, M. K. Jamali, A. Siddiqui, G. H. Kazi, M. B. Arain and H. I. Afridi, Chemosphere, 2006, 63, 411–420 CrossRef CAS PubMed.
- M. Chen, X. ming Li, Q. Yang, G. ming Zeng, Y. Zhang, D. xiang Liao, J. jin Liu, J. mei Hu and L. Guo, J. Hazard. Mater., 2008, 160, 324–329 CrossRef CAS PubMed.
- X. Liu, Y. Wang, C. Gui, P. Li, J. Zhang, H. Zhong and Y. Wei, RSC Adv., 2016, 6, 101960–101967 RSC.
- F. Li, Y. Cai and J. Zhang, Sustainability, 2018, 10, 91 CrossRef.
- Z. Sun and J. Chen, Int. J. Environ. Res. Public Health, 2018, 15, 85 CrossRef PubMed.
- J. Zhang, Hunan Geol., 1994, 12, 185–191 Search PubMed.
- L. Hakanson, Water Res., 1980, 14, 975–1001 CrossRef.
- X. Xu, X. Hu, Z. Ding and Y. Chen, Chemosphere, 2017, 189, 76–85 CrossRef CAS PubMed.
- L. Wu, G. Liu, C. Zhou, R. Liu, S. Xi, C. Da and F. Liu, Environ. Sci. Pollut. Res., 2018, 25, 588–600 CrossRef CAS PubMed.
- L. Mao, H. Ye, F. Li, H. Tao, L. Shi, L. Chen, W. Shi, G. Yan and H. Chen, Mar. Pollut. Bull., 2017, 125, 389–398 CrossRef CAS PubMed.
- X. Z. Ren Fumin, Z. Yusong and N. Muchen, J. Beijing Jiaotong Univ., 2007, 31, 102–105 Search PubMed.
- H. Huang, X. Yuan, G. Zeng, H. Zhu, H. Li, Z. Liu, H. Jiang, L. Leng and W. Bi, Bioresour. Technol., 2011, 102, 10346–10351 CrossRef CAS PubMed.
- Y. Lin, J. Ma, Z. Zhang, Y. Zhu, H. Hou, L. Zhao, Z. Sun, W. Xue and H. Shi, Sci. Total Environ., 2018, 610–611, 944–950 CrossRef CAS.
- G. Liang, B. Zhang, M. Lin, S. Wu, H. Hou, J. Zhang, G. Qian, X. Huang and J. Zhou, Sci. Total Environ., 2017, 607–608, 1339–1347 CrossRef CAS PubMed.
- S. K. Sundaray, B. B. Nayak, S. Lin and D. Bhatta, J. Hazard. Mater., 2011, 186, 1837–1846 CrossRef CAS PubMed.
- Z. Gu, M. Wu, K. Li and P. Ning, Arabian J. Chem., 2017, 10, S2196–S2204 CrossRef CAS.
- J. Paz-Ferreiro, P. Plasencia, G. Gascó and A. Méndez, Land Degrad. Dev., 2017, 28, 355–360 CrossRef.
- F. Wang, Q. Bu, X. Xia and M. Shen, Environ. Pollut., 2011, 159, 1905–1913 CrossRef CAS PubMed.
- A. Zielińska and P. Oleszczuk, Biomass Bioenergy, 2015, 75, 235–244 CrossRef.
- K. Lin, N. Lai, J. Zeng and H. Chiang, Environ. Sci. Pollut. Res., 2018, 25, 6487–6496 CrossRef CAS PubMed.
- M. Benito Abascal, M. Bläsing, Y. Ninomiya and M. Müller, Ind. Eng. Chem. Res., 2016, 55, 6911–6921 CrossRef CAS.
- J. Liu, Z. Zhuo, S. Sun, W. Xie, S. Lu, J. Sun, J. Kuo and W. Yujie, Water Environ. Res., 2016, 88, 2245–2256 CrossRef CAS PubMed.
- H. Belevi and M. Langmeier, Environ. Sci. Technol., 2000, 34, 2507–2512 CrossRef CAS.
- S. Abanades, G. Flamant and D. Gauthier, J. Hazard. Mater., 2001, 88, 75–94 CrossRef CAS PubMed.
- H. Okyere, R. B. Voegborlo and S. E. Agorku, Food Chem., 2015, 179, 331–335 CrossRef CAS PubMed.
- J.-G. Jang, W.-H. Kim, M.-R. Kim, H.-S. Chun and J.-K. Lee, Korean J. Chem. Eng., 2001, 18, 506–511 CrossRef CAS.
- I. S. Mkilaha, H. Yao and I. Naruse, J. Mater. Cycles Waste Manage., 2002, 4, 143–149 CAS.
- D. Pudasainee, Y. C. Seo, J. H. Kim and H. N. Jang, J. Mater. Cycles Waste Manage., 2013, 15, 202–209 CrossRef CAS.
- J. Luan, R. Li, Z. Zhang, Y. Li and Y. Zhao, Waste Manage. Res., 2013, 31, 1012–1018 CrossRef PubMed.
- M. R. Awual, Chem. Eng. J., 2016, 303, 539–546 CrossRef CAS.
- M. R. Awual, Chem. Eng. J., 2017, 307, 85–94 CrossRef CAS.
- M. R. Awual, Chem. Eng. J., 2017, 307, 456–465 CrossRef CAS.
- J. Du, L. Zhang, T. Liu, R. Xiao, R. Li, D. Guo, L. Qiu, X. Yang and Z. Zhang, Bioresour. Technol., 2019, 274, 73–82 CrossRef CAS PubMed.
- X. Yuan, L. Leng, H. Huang, X. Chen, H. Wang, Z. Xiao, Y. Zhai, H. Chen and G. Zeng, Chemosphere, 2015, 120, 645–652 CrossRef CAS PubMed.
- G. Shi, Z. Chen, C. Bi, Y. Li, J. Teng, L. Wang and S. Xu, Environ. Pollut., 2010, 158, 694–703 CrossRef CAS PubMed.
| This journal is © The Royal Society of Chemistry 2019 |

