 Open Access Article
Influence of Mg/CTAB ratio on the structural, physicochemical properties and catalytic activity of amorphous mesoporous magnesium silicate catalysts†
Kok-Hou Tan a,
Anwar Iqbal
 *ac,
Farook Adama,
N. H. H. Abu Bakara,
M. N. Ahmadb,
Rahimi M. Yusopc and
Hariy Pauzid
aSchool of Chemical Sciences, Universiti Sains Malaysia, 11800 Penang, Malaysia. E-mail: anwariqbal@usm.my; Tel: +604-6533565
bExperimental and Theoretical Research Lab, Department of Chemistry, Kulliyyah of Science, International Islamic University Malaysia, Bandar Indera Mahkota, 25200 Kuantan Pahang, Malaysia
cSchool of Chemical Sciences and Food Technology, Faculty of Science and Technology, Universiti Kebangsaan Malaysia, 43600 UKM, Bangi, Malaysia
dScience and Engineering Research Centre (SERC), Universiti Sains Malaysia, Engineering Campus, 14300 Nibong Tebal, Seberang Perai Selatan, Penang, Malaysia
First published on 26th November 2019
Abstract
This study investigated the physicochemical and catalytic properties of mesoporous magnesium silicate catalysts prepared at various Mg/CTAB ratios (0.25, 0.50, 0.75 and 1.00). The XPS analysis detected a mixture of enstatite and magnesium carbonate species when the Mg/CTAB ratio was 0.25, and 0.50. A mixture of forsterite and magnesium carbonate species were detected when the Mg/CTAB ratio was 0.75 whereas for the Mg/CTAB ratio of 1.00, enstatite and magnesium metasilicate species were detected. A catalyst with the Mg/CTAB ratio of 1.00 demonstrated the highest catalytic activity in the oxidation of styrene. The styrene conversion rate was 59.0%, with 69.2% styrene oxide (StO) selectivity. The H2O2 molecules were activated regio-specifically by the magnesium species to prevent rapid self-decomposition while promoting selective interaction with styrene. All the parameters that influence the styrene conversion and product selectivity were evaluated using analysis of variance (ANOVA) with Tukey's test. The ANOVA analysis showed that the reaction time (h), Mg/CTAB ratio, styrene/H2O2 ratio, catalyst loading (mg) and temperature (°C) affect styrene conversion and product selectivity (StO) significantly (p < 0.05). The oxidation of styrene was well fitted to the pseudo-first-order model. The activation energy, Ea of the catalysed styrene epoxidation reaction was calculated to be 27.7 kJmol−1. The catalyst can be reused several times without any significant loss in its activity and selectivity. The results from this study will be useful in designing and developing low cost, high activity catalysts from alkaline earth metals.
1. Introduction
Styrene oxide is a useful precursor and intermediate in the production of cosmetics, surface coatings, co-polymers and in the treatment of fibers and textiles.1,2 Besides, it is also used to synthesize antidepressants and anti-HIV agents.3,4 Conventionally, styrene oxide is synthesized via a chlorohydrin epoxidation route.5,6 However, the use of hazardous precursors and undesired waste products have urged the need for a greener alternative synthesis route. Utilizing H2O2 in a partial oxidation reaction has received a great deal of attention owing to its high atom economy (48%), low cost (USD1.39 per mole, compared to USD6.06 per mole for THBP and USD55.07 per mole for dibenzoyl peroxide), and environmentally friendly nature.7 However, the poor epoxide selectivity due to the rapid decomposition of H2O2 at high temperature has limited its industrial viability.8,9 This shortcoming can be overcome with the use of catalysts. Metal-based catalysts are among the most extensively studied catalytic systems in H2O2 driven epoxidation of styrene.Transition metals, for example, gold, indium, iron, manganese, rhenium, titanium, tungsten, and vanadium, have been frequently used in formulating active epoxidation catalysts with or without support.10–13 In contrast, studies on the catalytic epoxidation performance of s-block elements are relatively rare. Most researchers have focused on the use of alkali and alkaline earth metals as promoters in transition metal-based catalysts. A study conducted by Wang and his co-workers demonstrated that wet impregnation of alkaline earth metals (Mg, Ca, Sr and Ba) onto SBA-15 together with vanadium ion increased the styrene oxide selectivity in photo-assisted styrene epoxidation reaction.14 The alkaline metals were added to restrain the vanadium(V) ion and to prevent deep oxidation of styrene oxide by inhibiting ring-opening reaction.
Sebastian et al. prepared a series of bimetallic zeolite X containing cobalt(II) and s-block (Na, K, Rb, Cs, Mg, Ca, Sr and Ba) metal cation pairs, for the epoxidation of styrene using molecular oxygen.15 Barium exchanged Co-zeolite X catalyst indicated highest catalytic activity with 100% styrene conversion and 83% selectivity of styrene oxide. A high turnover frequency of 32.5 h−1 was achieved due to the stronger interaction between Co(II) cations and molecular oxygen and the presence of barium cations. Previous studies have indicated that alkaline earth metal oxides alone are active in catalysing epoxidation reaction. Barium oxide has been reported to effectively convert 40.7% of styrene to styrene oxide. The selectivity of styrene oxide was 78.7%.16 The conversion of styrene and the selectivity of styrene oxide were 97.0% and 88.4%, respectively when MgO was applied with H2O2.17 Almost complete conversion of styrene with 97.5% selectivity of styrene oxide was achieved when CaO was used with H2O2.18 The amount of strong basic site and strength were concluded as the key factors for their exceptional performance. However, alternative solution is needed to replace these long reaction time (t = 10 h) and low turnover frequency catalysis system (0.74 h−1 for MgO and 1.34 h−1 for CaO at t = 1 h).
Previously, metal, metal oxide and their complexes have been incorporated onto various supports to improve their catalytic performances.19–21 However, to the best of our knowledge, the catalytic activity of supported magnesium cation for styrene epoxidation has not been reported so far. Herein, we report the one-pot synthesis of a series of magnesium silicate catalysts from rice husk ash. This study focuses on the effect of Mg/CTAB molar ratio on the structural, physicochemical and catalytic properties of resulting catalysts. The collected physicochemical data and catalytic data were used to propose the catalysts surface structure, kinetics and possible reaction mechanisms.
2. Experimental
2.1. Preparation of RHA
Rice husk ash (RHA) was prepared by first washing 40 g of rice husk (RH) with tap water to remove the dirt.22 The washed RH was then dried for 48 h at room temperature, followed by acid treatment with 1 L of 1 M HNO3 to reduce the metal impurities. The acid treated RH was washed thoroughly with distilled water until the pH of the rinsed water became constant. The acid treated RH was dried at 100 °C for 24 h and then heated to 600 °C at a ramp rate of 5 °C min−1 before calcining at 600 °C for a duration of 6 h.2.2. Synthesis of mesoporous silica support (MST)
A mixture of spherical and rod shape MST was synthesized based on the reported method by Anwar et al. with some modifications.22 Sodium silicate solution was first prepared by dissolving 3.00 g of RHA in 100 mL of 3.10 wt% sodium hydroxide solution (3.20 g of NaOH (QReC, 99%) in 100 mL of distilled water) under continuous stirring for 2 h at 80 °C. The surface directing agent (SDA) solution was prepared by dissolving 2.90 g of hexadecyltrimethylammonium bromide (CTAB, Sigma-Aldrich, 96%) in 50 mL of water at room temperature. The SDA solution was then slowly added into sodium silicate solution at 80 °C under vigorous stirring. The reactant mixture was stirred for 5 min, followed by pH adjustment from 14 to 10 using 2.0 M HNO3. The precursor mixture was reacted under reflux condition for six days at 80 °C. At the end of hydrothermal treatment, the resulting solution was washed and centrifuged for five times using distilled water and subsequently washed with distilled water and acetone. The solid was dried at 100 °C for 24 h in an oven and subjected to template-removing calcination at a heating rate of 1 °C min−1 from 30 to 550 °C, then a dwell time of five hours.2.3. Synthesis of mesoporous magnesium silicate nanoparticles
The synthesis of mesoporous magnesium silicates was similar to MST, with an additional step of dissolving desired amount of magnesium nitrate hexahydrate (Mg/CTAB ratio, x = 0.25, 0.50, 0.75, 1.00) in CTAB solution at room temperature under continuous stirring before adding it into the sodium silicate solution. The reactant mixture was stirred for 5 min, adjusted to pH 10 using 2.0 M HNO3, and refluxed for six days at 80 °C in a water bath under continuous stirring. The resulting mixture was centrifuged, washed with distilled water, and finally rinsed with acetone. The samples were dried in an oven at 100 °C for 24 h before being calcined at a ramp rate of 1 °C min−1 from 30 to 550 °C, followed by dwelling for five hours. The resulting solid sample were labelled in accordance to their Mg/CTAB ratio, x (xMgMST).2.4. Catalysts characterization
The structure and crystallinity of the synthesized catalysts was characterized with both high and low angle X-ray diffraction analysis (Bruker D8 Advance, Cu Kα = 1.5418 Å, step size = 0.02° per step, step time = 1 s per step). The morphology and texture of the materials were observed using scanning electron (Quanta FEG-650) and transmission electron (Philips CM12 electron microscope) microscopy. The particle size of prepared catalysts was measured using Digimizer version 4.6.1. Their porosity was determined using nitrogen adsorption–desorption and BET analysis (Micromeritics ASAP 2020 Porosimeter). The total magnesium content was determined using inductive coupled plasma-optical emission spectroscopy (ICP-OES, PerkinElmer OPTIMA 8000). The chemical environment of the catalysts surface was analysed using X-ray photoelectron spectroscopy (High Resolution Multi Technique X-ray Spectrometer, Axis Ultra DLD XPS, Kratos, Al Kα = 1486.7 eV, Monochromator, calibrated at C 1s 284.8 eV) and Fourier Transform Infrared spectroscopy (FT-IR, PerkinElmer 2000, resolution = 4 cm−1, scan range = 400–4000 cm−1, number of scans = 16).2.5. Catalytic testing
In a typical reaction, 1.15 mL of styrene (10 mmol, 98%, Merck), 10 mL of acetonitrile (Fisher) and 50 mg of catalyst were mixed in a 50 mL round bottom flask. The reaction mixture was stirred at 80 °C for 10 min to achieve thermal equilibrium. Oxidant, H2O2 (31%, QRec) was added to the reactant mixture to start the reaction. Aliquots were withdrawn at desired time interval and filtered with 0.2 μm syringe membrane filter prior to GC-FID analysis (PerkinElmer Claurus 600 Gas Chromatography equipped with Flame Ionization Detector, Elite-5 column, inlet temperature: 240 °C, detector temperature: 240 °C, carrier gas (compress air) flow rate: 20 mL min−1, programme: 80 °C to 240 °C, ramp rate: 5 °C min−1). The GC-MS was utilized to identify the compounds presented in the mixture with the same condition as that of GC-FID was applied using Elite-5MS column. Acetonitrile was fixed as the solvent throughout this study due to its capability to homogenize the immiscible polar (water and H2O2) and non-polar (styrene) reactants.2.6. Statistical analysis
All the parameters studied (reaction time, Mg/CTAB ratio, styrene/H2O2 ratio, catalyst loading, and temperature) were performed in duplicate and the data were expressed as means ± standard deviation (SD). The differences among means were determined by one-way analysis of variance (ANOVA) with Tukey's test by using JMP Pro 13 (SAS Institute Inc., USA). The statistical significance was established at p < 0.05. The test was performed to validate the conversion and selectivity of StO only since it as the targeted product.3. Results and discussion
3.1. Synthesis and characterization
The ICP-OES was used to determine the total quantity of magnesium cations incorporated whereas XPS was used to determine the concentration of magnesium on the catalysts surface. From Table 1, the overall concentration of magnesium increased significantly up to the Mg/CTAB molar ratio of 0.75, followed by a slight increase to 5.57% when Mg/CTAB = 1.00. Meanwhile, the surface Mg concentration continuously increase up to the Mg/CTAB molar ratio of 1.00.| Mg/CTAB ratio | Mg content (wt%) | |
|---|---|---|
| ICP-OES | XPS | |
| 0.25 | 1.88 | 4.20 |
| 0.50 | 3.20 | 6.69 |
| 0.75 | 5.06 | 8.23 |
| 1.00 | 5.57 | 14.41 |
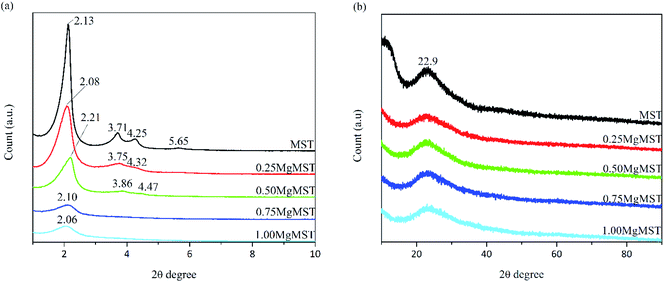
From Fig. 1(a), the small angle XRD pattern of MST was found to be identical to MCM-41. Four diffraction peaks can be observed at 2θ = 2.1°, 3.7°, 4.3° and 5.7°, correspond to the planes of (100), (110), (200) and (210), respectively. The diffraction peaks started to disappear as the Mg/CTAB molar ratio was increased, indicating the reduction in the number of ordered hexagonal pore channel with the incorporation of magnesium cations. The wide angle XRD diffraction patterns (Fig. 1(b)) showed a diffraction peak at 2θ = 23° referring to the amorphous nature of silica.23 Since no apparent crystalline peaks of MgO were detected, it is rationalized that no crystalline MgO cluster was formed.24,25
The unit cell parameter (a0) was calculated using the formula a0 = 2d100/√3, where d100 is the pore to pore distance in nm.26 The d100 value was obtained from the peak given by Bragg's equation, λ = 2d sin θ, where λ = 0.15406 nm for the Cu Kα line and θ is the reflection angle. The values are given in Table 2.
| Sample | 2θ (degree) | d100 (nm) | a0 (nm) |
|---|---|---|---|
| MST | 2.13 | 4.15 | 4.79 |
| 0.25MgMST | 2.08 | 4.25 | 4.90 |
| 0.50MgMST | 2.21 | 4.00 | 4.62 |
| 0.75MgMST | 2.10 | 4.21 | 4.86 |
| 1.00MgMST | 2.06 | 4.29 | 4.95 |
The chemical environment and coordination of magnesium, silicon and oxygen atoms on the surface of catalysts were investigated using X-ray photoelectron (XPS) spectroscopy. The position of the peaks after deconvolution are presented in Table 3. All spectrum was calibrated in accordance to adventitious carbon (284.8 eV). Additional carbon peaks between 286 eV to 288 eV are assigned as C–O and C![[double bond, length as m-dash]](https://www.rsc.org/images/entities/char_e001.gif) O, respectively.27,28
O, respectively.27,28
| Sample | Binding energy (eV) | |||
|---|---|---|---|---|
| Mg 1s | Si 2p | O 1s | C 1s | |
| MST | — | 103.6 | 532.7 | 284.8 |
| 533.4 | 286.7 | |||
| 535.7 | ||||
| 0.25MgMST | 1303.8 | 103.7 | 530.5 | 284.8 |
| 1304.6 | 104.3 | 532.9 | 286.2 | |
| 533.9 | 288.4 | |||
| 0.50MgMST | 1303.7 | 103.4 | 530.6 | 284.8 |
| 1305.2 | 103.9 | 532.7 | 285.8 | |
| 533.5 | 288.1 | |||
| 0.75MgMST | 1304.0 | 103.9 | 531.4 | 284.8 |
| 1304.7 | 104.3 | 533.0 | 286.1 | |
| 533.6 | 288.5 | |||
| 1.00MgMST | 1303.1 | 103.3 | 531.0 | 284.8 |
| 1304.0 | 103.8 | 532.3 | ||
| 104.2 | 534.2 | |||
The deconvolution of Si 2p core region resulted in a broad peak at the binding energy of 103.6 eV. The broadness of the peak indicates the presence of Si–O–Si and Si–OH bonds.29 Deconvolution of O 1s core region indicate the existence of more than one environment for the oxygen atoms. The peak at binding energy of 532.7 eV is assigned to the oxygen atom of siloxane bond (Si–O–Si) whereas the second peak at 533.4 eV is ascribed to the oxygen atom of silanol (Si–O–H) bond.30 The third peak at binding energy of 535.7 eV is assigned to gas phase H2O which was strongly adsorbed to the surface of silica and was unable to fully desorbed during the pre-drying process.31,32
For Mg/CTAB ratio of 0.25, the deconvolution of Mg 1s core region resulted in the appearance of two peaks located at 1303.8 and 1304.6 eV. These peaks refer to the magnesium species in enstatite and magnesium carbonate, respectively (Fig. 2(a) and (c)).33,34 The latter was resulted due the interaction between atmospheric carbon dioxide and surface magnesium oxide after calcination. The presence of carbonate is confirmed by the C 1s peak at 288.4 eV.28 The enstatite species is an orthorhombic unit coordinated by the oxygens of two opposite tetrahedral silicate chains.35 The deconvolution of Si 2p region resulted in two distinct peaks at 103.7 and 104.3 eV, which represent Si–O–Si and Si–OH, respectively.27 The O 1s peak with weak intensity found at 530.8 eV is referred to the non-bridging Mg–O–Si bond.36,37 These information suggest that the Mg cations were partitioned between anionic diffuse layer on micelles surface and bulk liquid in the precursor mixture. Deconvolution of Si 2p, O 1s and Mg 1s peaks of 0.50MgMST showed similar pattern as for 0.25MgMST. However, this sample contains much higher quantity of enstatite-Mg (84.7%) than that of magnesium carbonate (15.3%).
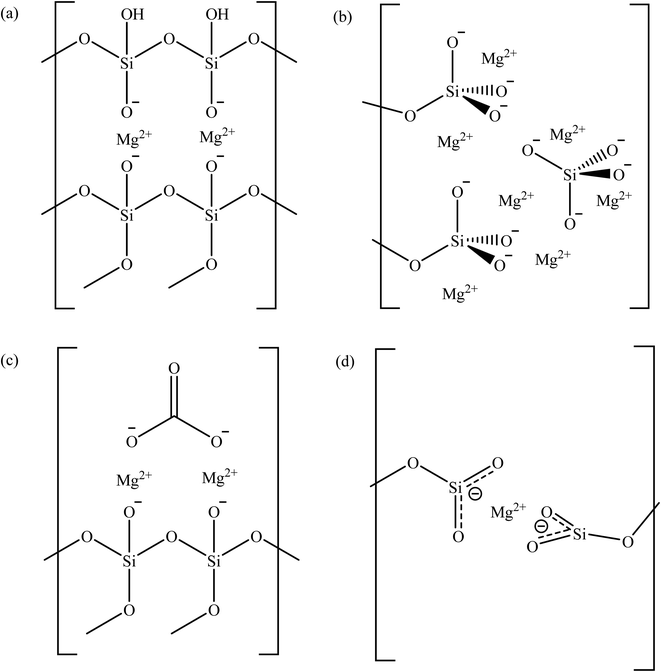 | ||
| Fig. 2 The possibly structure of magnesium in (a) enstatite, (b) forsterite, (c) magnesium silicate-carbonate, and (d) Mg-O3Si based on XPS analysis. | ||
Further increase of Mg/CTAB ratio to 0.75 favors the formation of forsterite, a dense orthosilicate comprising of the tetrahedral silicate and magnesium cation in 1![[thin space (1/6-em)]](https://www.rsc.org/images/entities/char_2009.gif) :
:![[thin space (1/6-em)]](https://www.rsc.org/images/entities/char_2009.gif) 2 molar ratio, in addition to magnesium carbonate. In forsterite, cations occupy two distinct octahedral sites, in which one site has silicates that share edges and corners with [MgO6]10− while another shares only corners (Fig. 2(b)).38 The magnesium in forsterite environment is indicated by the presence of a peak at 1304.0 eV whereas the magnesium carbonate is indicated by the peaks at 1304.7 and 288.5 eV. The deconvolution pattern of Si 2p and O 1s of 0.75MgMST are similar to 0.25MgMST and 0.50MgMST. The O 1s binding energy of 531.4 eV appeared to be higher than the corresponding peak in 0.25MgMST and 0.50MgMST, which was attributed to the presence of tetrahedral silicates in forsterite surface group.
2 molar ratio, in addition to magnesium carbonate. In forsterite, cations occupy two distinct octahedral sites, in which one site has silicates that share edges and corners with [MgO6]10− while another shares only corners (Fig. 2(b)).38 The magnesium in forsterite environment is indicated by the presence of a peak at 1304.0 eV whereas the magnesium carbonate is indicated by the peaks at 1304.7 and 288.5 eV. The deconvolution pattern of Si 2p and O 1s of 0.75MgMST are similar to 0.25MgMST and 0.50MgMST. The O 1s binding energy of 531.4 eV appeared to be higher than the corresponding peak in 0.25MgMST and 0.50MgMST, which was attributed to the presence of tetrahedral silicates in forsterite surface group.
When the amount of magnesium is equal to that of CTAB, the XPS analysis indicate the presence of magnesium in the chemical state that resembles metallic magnesium (1303.1 eV) and enstatite environment (1304.0 eV). Apart from Si–O–Si (103.8 eV and 532.3 eV) group, Mg2+(−O3SiR)2 can also be detected on the surface of the catalyst. This was indicated by the emergence of peaks at binding energy of 103.3 and 531.0 eV, which correspond to metasilicate anions.33 These findings are similar to the findings by Gui and his co-workers in their reported work on the use of sandwich like magnesium silicate/reduced graphene oxide.39 Coordination of high electron density −O3Si-R group to Mg2+ reduces its effective nuclear charge towards the inner 1s electron, which leads to the decrease in Mg 1s binding energy to the value that resembles the binding energy of metallic magnesium.
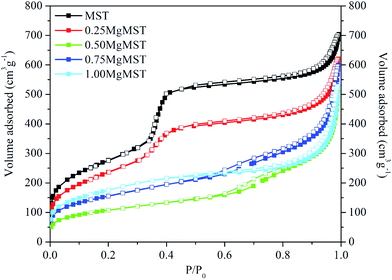
Fig. 3 depicts the N2 adsorption–desorption isotherm of the catalysts. Based on the IUPAC classification, the isotherm of MST and 0.25MgMST are Type IV isotherms, which is typical for mesoporous materials. This is associated with a small hysteresis loop that represents the capillary condensation step at P/P0 = ∼0.4.40 A sharp increase at P/P0 = 0.25–0.40 indicates that MST has well-ordered uniform pore structure and distribution.41 The steepness reduced and eventually flattened as the magnesium cation concentration increased. These changes in the isotherm shapes indicate that MgMST catalysts has different structures as indicated by the XRD and XPS analyses. All the catalysts exhibit H3 hysteresis loop due to the presence of non-rigid plate-like particles that give rise to slit-shaped pores. The amount of adsorbed nitrogen gradually decreased as well when compared to MST due the reduction in the surface area (Table 4).41 The 0.25MgMST has the highest BET surface area whereas 0.50MgMST has the lowest surface area.
| Sample | SBET (m2 g−1) | dBJH (nm) | Vtotal (cm3 g−1) |
|---|---|---|---|
| MST | 1000 | 3.4 | 1.0888 |
| 0.25MgMST | 870 | 3.6 | 0.9595 |
| 0.50MgMST | 378 | 5.9 | 0.7880 |
| 0.75MgMST | 558 | 4.9 | 0.9265 |
| 1.00MgMST | 633 | 3.8 | 0.8168 |
The incorporation of Mg has also resulted in the change of pore size and pore volume (Table 4). The pore size increased when the Mg/CTAB molar ratio was increased to 0.50. However, further increase in the Mg/CTAB ratio resulted in pore size reduction. The BJH pore size of the catalysts was determined to be in the range of 3.4–5.9 nm. The largest pore size and the lowest pore volume was achieved when the Mg/CTAB molar ratio was 0.50. The trend in the pore size distribution can be attributed to the arrangement of magnesium atoms in enstatite, forsterite and magnesium metasilicate.
The TEM micrographs of the catalysts are shown in Fig. 4. As seen in Fig. 4(a), the MST contains longitudinal and spiral architecture with long-ordered parallel pore channels as indicated by the low angle XRD (Fig. 1(a)). The MCM-41-like feature, hexagonally packed mesopores, can also be seen clearly in the image. The pore structure became more disordered when more magnesium was added. The progressive disappearance of ordered pore channels observable in the TEM micrographs of the catalysts is in-line with the finding in small angle XRD analysis, which depicts the weakening of (100) plane (Fig. 1(a)) also indicate the deterioration in the order of pore channels.
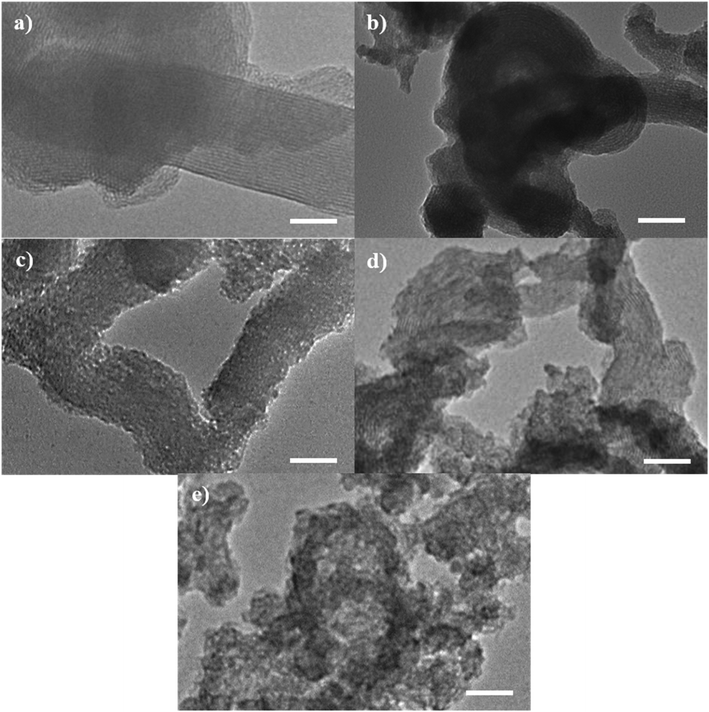 | ||
| Fig. 4 The TEM micrographs of (a) MST, (b) 0.25MgMST, (c) 0.50MgMST, (d) 0.75MgMST and (e) 1.00MgMST. Scale bar = 50 nm. | ||
The SEM micrographs show that the catalysts were made up by rod-shaped particles. Some of these nanorods were observed to be bent. According to Volkov and co-workers, the bending is the result of an equilibrium process involving entropically bending of soft mesoporous silica by Brownian motion and silica condensation to form cross-linked Si–O–Si.42 These bent structures would later aggregate to form spherical particles, as observed in Fig. 5(a). The mixture of nanorods and nanospheres can still be observed in the 0.25MgMST (Fig. 5(b)). This observation supports the results of XRD and TEM, which deduced that the addition of small amount of magnesium has limited influence on the pore structure of the catalyst. Higher Mg/CTAB ratio has led to the formation of shorter irregular rods which cannot be proceeded to develop spherical aggregates (Fig. 5(c)–(e)). The images also indicate that the catalysts contain significant number of textural pores.
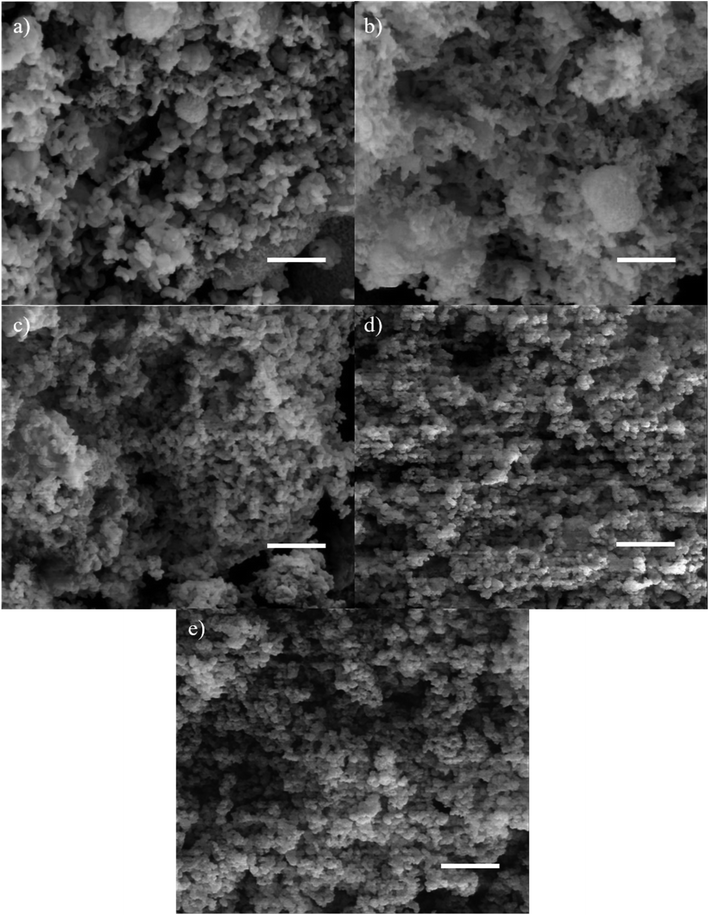 | ||
| Fig. 5 The SEM micrographs of (a) MST, (b) 0.25MgMST, (c) 0.50MgMST, (d) 0.75MgMST and (e) 1.00MgMST. Scale bar = 1 μm. | ||
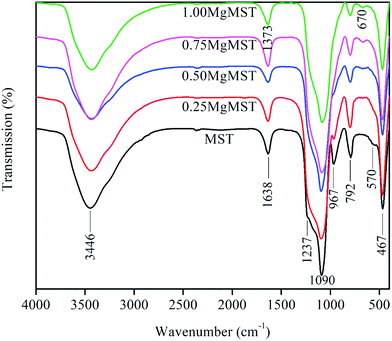
The infrared spectra of the catalysts are presented in Fig. 6. The broad absorption bands at ∼3446 and 1638 cm−1 are due to the stretching and bending vibration of O–H bonds in Si–OH and of water molecules adsorbed on the surface of the catalysts. The internal and external asymmetric Si–O–Si stretching vibration of structural siloxane bond are indicated by the presence of IR band at ∼1090 cm−1 and its shoulder at 1237 cm−1.41 The Si–O–Si bending modes of Si–O–Si is represented by the IR band at ∼467 cm−1. It is observed that the IR band at ∼960 cm−1, which is often associated to the symmetric stretching vibration of Si–OH, diminished as the concentration of magnesium cation increased.
The disappearance of IR bands at 1237 and 960 cm−1 indicates the formation of Si–O–Mg bond. As of the Mg/CTAB = 1, a small absorption band emerges at 670 cm−1, which arises from the formation of Si–O–Mg bond.43 The bridged bidentate carbonate is identified by the distinct IR peaks at 1530–1670 cm−1 and 1220–1270 cm−1. These peaks overlapped with the absorption band of hydroxyl and siloxane groups.44 The unique magnesium metasilicate surface group is evidenced by the IR peaks at 670 and 1373 cm−1.39 The later was comparable to that measured in the Ar environment.45
3.2. Epoxidation of styrene
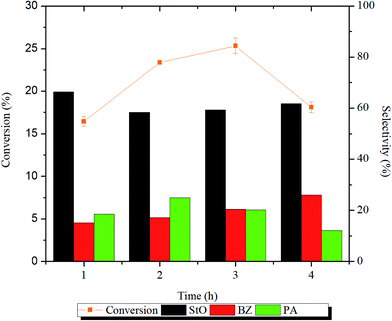
In the presence of magnesium silicate catalysts, styrene oxide (StO) was detected as the major product whereas benzaldehyde (BZ) and phenylacetaldehyde (PA) were detected as the minor products. The parameters that were studied are catalyst structure, reaction time, temperature, styrene/H2O2 molar ratio and catalyst loading. Based on the results of characterization and catalytic activities, reaction mechanisms were proposed, and the reaction kinetics was calculated.The influence of reaction time on the catalytic activity is presented in Fig. 7 and Table S1.† From the Fig. 7 and Table S1,† it can be noted as the reaction time from 1 to 2 h, the conversion of styrene increased significantly (p < 0.05) from 16 to 23%, respectively. The styrene conversion continued to reduce as the reaction time was prolonged to 4 h. As the reaction time was prolonged, more water molecules will be generated as by-product. The water molecules may had adsorbed on the catalyst surface thus reducing its catalytic activity. The selectivity of StO dropped after 1 h and remained constant (∼60%) thereafter. The BZ selectivity increased with increasing reaction time while the PA selectivity increased for the first 2 h and decreased afterwards. Longer reaction time will promote the formation of side products (BZ and PA), which reduces the selectivity of StO. Due to the interest in StO and that high energy input is not attractive from an energy saving point of view, subsequent reactions were carried out at 1 h throughout this study.
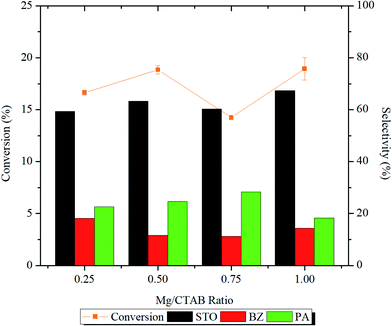
From the reaction profile presented in Fig. 8 and Table S1,† it was demonstrated that increasing the number of magnesium active sites from Mg/CTAB = 0.25 to 0.50 increased significantly (p < 0.05) the styrene conversion from ∼16 to ∼19% and the StO selectivity from 59.8 to 63.3%. In the meantime, the BZ selectivity slightly dropped from 18.1 to 11.7% followed by an increase in the selectivity of PA from 22.0% to 24.6%.
In 0.75MgMST, magnesium cations in forsterite structure were surrounded by anionic silicates in octahedral geometry. The geometry had limited the access of O–O bond of H2O2 from interacting with the magnesium cation. As the result, the styrene conversion dropped to 14.3%. However, the selectivity of the products was not affected. In contrary to 0.75MgMST, magnesium cations in 1.00MgMST were compensated by two metasilicate anions to form rigid tetrahedral structure. This structure has unsaturated coordination sites that is more accessible to H2O2 molecules. As the result, 1.00MgMST achieved better styrene conversion (18.4%) and StO selectivity (66.3%) than its precedents. The selectivity of BZ and PA were lower compared to 0.50MgMST and 0.75MgMST.
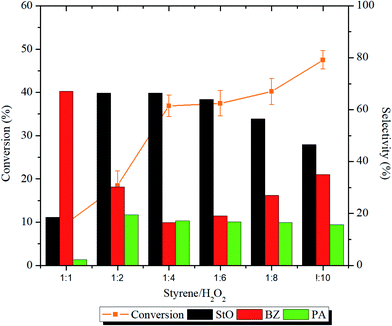
The effect of styrene/H2O2 molar ratio was investigated using 1.00MgMST. The influence of the molar ratio and ANOVA results on the conversion and products selectivity is shown in Fig. 9 and Table S1,† respectively. The styrene conversion increased significantly (p < 0.05) when the styrene/H2O2 molar ratio was increased from 1![[thin space (1/6-em)]](https://www.rsc.org/images/entities/char_2009.gif) :
:![[thin space (1/6-em)]](https://www.rsc.org/images/entities/char_2009.gif) 1 to 1
1 to 1![[thin space (1/6-em)]](https://www.rsc.org/images/entities/char_2009.gif) :
:![[thin space (1/6-em)]](https://www.rsc.org/images/entities/char_2009.gif) 10. However, varying the styrene/H2O2 molar ratio has impacted the products distribution.
10. However, varying the styrene/H2O2 molar ratio has impacted the products distribution.
At styrene/H2O2 molar ratio of 1![[thin space (1/6-em)]](https://www.rsc.org/images/entities/char_2009.gif) :
:![[thin space (1/6-em)]](https://www.rsc.org/images/entities/char_2009.gif) 1, the selectivity of BZ (67.1%) was higher compared to StO (18.6%). At this ratio, the self-decomposition of H2O2 to hydroxyl and hydroperoxyl radicals might had happened at a faster rate. The initially formed StO was further oxidized to BZ by these radicals. The selectivity of PA was the lowest (2.2%) in 1
1, the selectivity of BZ (67.1%) was higher compared to StO (18.6%). At this ratio, the self-decomposition of H2O2 to hydroxyl and hydroperoxyl radicals might had happened at a faster rate. The initially formed StO was further oxidized to BZ by these radicals. The selectivity of PA was the lowest (2.2%) in 1![[thin space (1/6-em)]](https://www.rsc.org/images/entities/char_2009.gif) :
:![[thin space (1/6-em)]](https://www.rsc.org/images/entities/char_2009.gif) 1 ratio due to the lack of StO to be isomerized. Increasing the molar ratio beyond 1
1 ratio due to the lack of StO to be isomerized. Increasing the molar ratio beyond 1![[thin space (1/6-em)]](https://www.rsc.org/images/entities/char_2009.gif) :
:![[thin space (1/6-em)]](https://www.rsc.org/images/entities/char_2009.gif) 2 increased the selectivity towards StO and accompanied by an increase in PA selectivity. The StO selectivity started to drop when the styrene/H2O2 molar ratio was increased to 1
2 increased the selectivity towards StO and accompanied by an increase in PA selectivity. The StO selectivity started to drop when the styrene/H2O2 molar ratio was increased to 1![[thin space (1/6-em)]](https://www.rsc.org/images/entities/char_2009.gif) :
:![[thin space (1/6-em)]](https://www.rsc.org/images/entities/char_2009.gif) 8 and 1
8 and 1![[thin space (1/6-em)]](https://www.rsc.org/images/entities/char_2009.gif) :
:![[thin space (1/6-em)]](https://www.rsc.org/images/entities/char_2009.gif) 10 whereas the selectivity of BZ increased. Based on the results, it is concluded that the catalyst can effectively utilize the H2O2 when styrene/H2O2 molar ratios were in the range of 1
10 whereas the selectivity of BZ increased. Based on the results, it is concluded that the catalyst can effectively utilize the H2O2 when styrene/H2O2 molar ratios were in the range of 1![[thin space (1/6-em)]](https://www.rsc.org/images/entities/char_2009.gif) :
:![[thin space (1/6-em)]](https://www.rsc.org/images/entities/char_2009.gif) 2 to 1
2 to 1![[thin space (1/6-em)]](https://www.rsc.org/images/entities/char_2009.gif) :
:![[thin space (1/6-em)]](https://www.rsc.org/images/entities/char_2009.gif) 6. The presence of magnesium cations has stabilized the H2O2 from homolytic self-decomposition and provided alternative pathways for the reaction to occur. The finding is consistent with the findings of Sebastian et al. where incorporation of magnesium cation was proven to increase the styrene conversion and styrene oxide selectivity.15 Styrene/H2O2 molar ratio of 1
6. The presence of magnesium cations has stabilized the H2O2 from homolytic self-decomposition and provided alternative pathways for the reaction to occur. The finding is consistent with the findings of Sebastian et al. where incorporation of magnesium cation was proven to increase the styrene conversion and styrene oxide selectivity.15 Styrene/H2O2 molar ratio of 1![[thin space (1/6-em)]](https://www.rsc.org/images/entities/char_2009.gif) :
:![[thin space (1/6-em)]](https://www.rsc.org/images/entities/char_2009.gif) 6, which achieves the highest StO selectivity, has been chosen as the optimum ratio.
6, which achieves the highest StO selectivity, has been chosen as the optimum ratio.
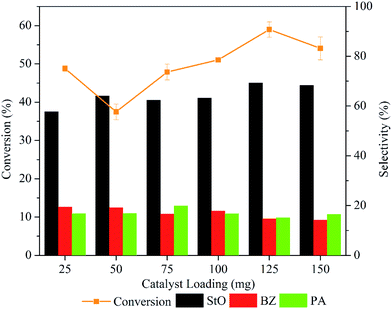
Fig. 10 depicts the trend in styrene conversion and products selectivity as the mass of catalyst was varied. The conversion of styrene dropped from 48.8 to 37.5% when the mass of catalyst was increased from 25 to 50 mg. The reduce in catalytic activity could be caused by the adsorption of the styrene and products molecule on the active sites.
However, the conversion of styrene increased significantly (p < 0.05) (Table S1†) when the catalyst loading was increased from 75 to 125 mg due to the availability of excess surface area and active sites for the reaction to take place. The products selectivity was almost similar when the mass of catalyst was varied from 25 to 100 mg. Increasing the mass to 125 mg increased the StO selectivity to 69.2%. Further increase to 150 mg slightly reduced the styrene conversion (54.1%) and StO selectivity (68.3%). This suggested that the reaction rate was governed by internal mass transport limitation when catalyst loading was 150 mg.46 Hence, 125 mg was employed as the optimal catalyst loading in 1.00MgMST catalysed oxidation of styrene.
The influence of reaction temperature on the epoxidation of styrene conversion and products selectivity were investigated in the range of 60–100 °C for 1 h. The reaction profiles and ANOVA results are shown in Fig. 11 and Table S1,† respectively. From the reaction profile, it is indicated that the styrene conversion increased significantly (p < 0.05) when the reaction temperature was raised from 60 to 80 °C. This can be explained by the collision model, in which increasing the reaction temperature will increase the number of reactants molecules with higher kinetic energy than that of reaction activation energy. Eventually, greater number of effective collisions occurred, and more styrene was successfully oxidized.9 The selectivity of StO was calculated to be ∼68% when the reaction temperature was 60–80 °C.
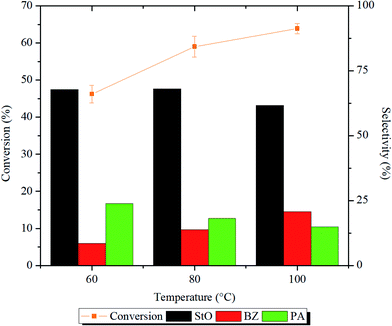 | ||
| Fig. 11 Styrene conversion and product selectivity after 1 h of reaction at 60, 80 and 100 °C. Reaction condition: 125 mg of 1.00MgMST, 10 mmol of styrene, 60 mmol of H2O2, and 10 mL of acetonitrile. | ||
Further increase to 100 °C reduced the selectivity of StO to 61.6%. At 100 °C, H2O2 rapidly decomposed to form hydroxyl and hydroperoxyl radicals that can easily oxidize StO to BZ.47,48 This is evidenced by the highest selectivity of BZ (20.8%) at 100 °C compared to other temperatures. At 60 °C, the formation of PA was higher compared to BZ. This observation indicates that the direct isomerization of StO to PA required lower energy compared to the secondary oxidation of StO to BZ. Based on the results, it is decided that the consecutive reactions to be carried out at 80 °C.
In conclusion, the optimum conditions required to selectively oxidize 10 mmol of styrene to StO, BZ and PA with 69.2% of epoxide selectivity are 125 mg of 1.00MgMST, styrene/H2O2 ratio equals to 1![[thin space (1/6-em)]](https://www.rsc.org/images/entities/char_2009.gif) :
:![[thin space (1/6-em)]](https://www.rsc.org/images/entities/char_2009.gif) 6, 80 °C and 1 h of reaction time, while the amount of solvent used was 10 mL. The catalytic activity of 1.00MgMST was compared with blank reaction and MST. They are presented in Table 5. In the absence of catalyst, the conversion of styrene was 16.1% whereas the selectivity of StO, BZ and PA were 2%, 92.2% and 5.8%, respectively. The conversion of styrene improved significantly (p < 0.05) almost 2-fold to 23.8% when MST was used as the catalyst. Slight improvement in the StO selectivity can be observed. The selectivity of PA (18.4%) was higher compared to blank due to the weak acidic nature of MST. According to the Tukey's test, the collected data suggest that magnesium cations played a significant (p < 0.05) role in improving the styrene conversion and StO selectivity.
6, 80 °C and 1 h of reaction time, while the amount of solvent used was 10 mL. The catalytic activity of 1.00MgMST was compared with blank reaction and MST. They are presented in Table 5. In the absence of catalyst, the conversion of styrene was 16.1% whereas the selectivity of StO, BZ and PA were 2%, 92.2% and 5.8%, respectively. The conversion of styrene improved significantly (p < 0.05) almost 2-fold to 23.8% when MST was used as the catalyst. Slight improvement in the StO selectivity can be observed. The selectivity of PA (18.4%) was higher compared to blank due to the weak acidic nature of MST. According to the Tukey's test, the collected data suggest that magnesium cations played a significant (p < 0.05) role in improving the styrene conversion and StO selectivity.
| Catalyst | Conversion | Selectivity (%) | ||
|---|---|---|---|---|
| StO | BZ | PA | ||
| a Results are average of duplicate analysis, with standard deviations in parentheses. a, b, c should be analysed vertically. Different letters show significant difference according to Tukey test (p < 0.05). | ||||
| Blank | 16.1a ± 0.2 | 2.0a ± 0.2 | 92.2a ± 0.6 | 5.8b ± 0.4 |
| MST | 23.8a,b ± 1.4 | 11.3b ± 0.6 | 70.3b ± 1.5 | 18.4a ± 0.9 |
| 1.00MgMST | 59.0b ± 2.8 | 69.2c ± 2.0 | 13.8c ± 0.8 | 17.6a ± 1.2 |
3.3. Kinetic study
The experimental data were fitted into various kinetic model to determine the order and rate constant of the studied reaction (Table S2†). At all temperatures, the reaction kinetic was best fitted in pseudo-first-order model, with the adjusted R2 falls in the range of 0.9977 to 0.9982. The reaction rate constants (k), calculated by multiplying the value of the slope with 2.303, were gradually increased from 7.8073 × 10⁻⁵ s−1 to 1.3367 × 10⁻⁴ s−1, followed by 2.2811 × 10⁻⁴ s−1 when the reaction temperature was increased from 60 °C to 100 °C. An Arrhenius plot of ln![[thin space (1/6-em)]](https://www.rsc.org/images/entities/char_2009.gif) k against 1/T was then plotted to obtain the activation energy, Ea (Fig. S5†). By substituting the value of slope to eqn (1), the activation energy of the reaction was determined to be 27.7 kJmol−1. This value is considered as relatively lower than most of the activation energy reported in literature (Table 6).
k against 1/T was then plotted to obtain the activation energy, Ea (Fig. S5†). By substituting the value of slope to eqn (1), the activation energy of the reaction was determined to be 27.7 kJmol−1. This value is considered as relatively lower than most of the activation energy reported in literature (Table 6).
 | (1) |
| Catalyst | Oxidant | Solvent | Time | Temperature (K) | Conversion (%) | Styrene oxide selectivity (%) | Epoxide yield (%) | Activation energy, Ea (kJ mol−1) | Reference |
|---|---|---|---|---|---|---|---|---|---|
| 1.00MgMST | H2O2 | Acetonitrile | 1 h | 353 | 59.0 | 69.2 | 38.15 | 27.7 | Current study |
| Cu–Co Prussian blue (PBA) | TBHP | Acetonitrile | 6 h | 345 | 96.0 | 64.0 | 61.4 | 100.4 | 49 |
| P450 (CYP102) Enzyme | Sodium peroxynitrite solution | Mixture of glycerol and phosphate buffer | 2 s | 273 | — | — | 70.0 | 63.6 | 50 |
| P450 (CYP119) Enzyme | 0.5 s | — | — | 50.0 | 61.1 | 50 | |||
| Co(II)-NaX | O2 | N,N-Dimethylformamide | 2 h | 373 | 44.0 | 60.0 | 26.4 | 96.0 (<363 K), 18.0 (>363 K) | 24 |
| DTPA-CDMBAC combination | H2O2 | Ethylene dichloride | 4 h | 323 | 28.0 | — | — | 30.4 | 51 |
| Mesoporous TUD-1 supported indium oxide | O2 | N,N-Dimethylformamide | 8 h | 403 | 24.7 | 57.0 | 14.1 | 12.1 | 52 |
| Novozym 435, conventional microwave | H2O2/Lauric acid | Toluene | 3 h | 328 | 68.0 | — | — | 43.9 | 53 |
| 78.0 | 45.3 |
3.4. Reusability test
The stability of 1.00MgMST was evaluated by continuously reusing the catalyst for four cycles (fresh and 3 reuses). Based on Fig. 12, the styrene conversion and StO selectivity reduced when the catalyst was reused for the first time and remained constant since then. Surprisingly, the selectivity of BZ started to increase when the catalyst was reused. The phenomenon is currently being investigated. Based on the reusability study, it is concluded that 1.00MgMST is relatively stable and versatile.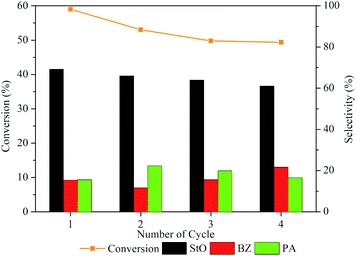 | ||
| Fig. 12 Styrene conversion and product selectivity of 1.00MgMST after being regenerated using calcination for up to four cycles. | ||
4. Conclusions
A series of catalysts with various surface magnesium species were successful synthesized using direct one-pot synthesis method by varying Mg/CTAB ratios (0.25, 0.50, 0.75 and 1.00). Catalysts with enstatite, magnesium carbonate, forsterite and magnesium metasilicate surface active sites were observed by increasing Mg/CTAB ratio. The introduction of magnesium cation has shown to disrupt the order of catalyst pore channels. 1.00MgMST, which contains tetrahedral magnesium metasilicate and enstatite magnesium groups, was proven to be the most active and selective catalyst among the four catalysts. The conversion of styrene was 59.0% whereas the selectivity of StO was 69.2% under optimum conditions (125 mg of 1.00MgMST, styrene/H2O2 ratio = 1![[thin space (1/6-em)]](https://www.rsc.org/images/entities/char_2009.gif) :
:![[thin space (1/6-em)]](https://www.rsc.org/images/entities/char_2009.gif) 6, 80 °C and 1 h of reaction time). It was proposed that the catalyst reduces the reaction activation energy down to 27.7 kJmol−1 by catalysing the epoxidation reaction via adsorption and regiospecific activation of H2O2 on the magnesium metasilicate species. The catalyst can be recycled several times without losing its catalytic activity. The ANOVA analysis showed that the reaction time (h), Mg/CTAB ratio, styrene/H2O2 ratio, catalyst loading (mg) and temperature (°C) effects the styrene conversion and product selectivity (StO), significantly (p < 0.05).
6, 80 °C and 1 h of reaction time). It was proposed that the catalyst reduces the reaction activation energy down to 27.7 kJmol−1 by catalysing the epoxidation reaction via adsorption and regiospecific activation of H2O2 on the magnesium metasilicate species. The catalyst can be recycled several times without losing its catalytic activity. The ANOVA analysis showed that the reaction time (h), Mg/CTAB ratio, styrene/H2O2 ratio, catalyst loading (mg) and temperature (°C) effects the styrene conversion and product selectivity (StO), significantly (p < 0.05).
Conflicts of interest
There are no conflicts to declare.Acknowledgements
Authors would like to acknowledge the financial support from the Universiti Sains Malaysia Short Term Grant (304/PKIMIA/6313215), Universiti Sains Malaysia Research University Grant (RUI) (1001/PKIMIA/8011083), and TRGS Grant (203/PKIMIA/679001). The technical service provided by Mr Ahmad Fadly Bin Jusoh and Earth Material Characterization Laboratory (MPBB), Universiti Sains Malaysia was appreciated. We would like to extend our gratitude to the RSC Materials Chemistry Division for the financial support given to Mr Kok-Hou Tan through RSC Travel Grant for PhD Students and Early Career Scientists, Ministry of Education Malaysia (Higher Education) and Universiti Sains Malaysia for the Post-Doctoral Training Fellowship awarded to Anwar Iqbal.References
- U.S. EPA, Styrene oxide, 2000 Search PubMed.
- G.-P. Wu, S.-H. Wei, W.-M. Ren, X.-B. Lu, B. Li, Y.-P. Zu and D. J. Darensbourg, Energy Environ. Sci., 2011, 4, 5084 RSC.
- D. Mitchell and T. M. Koenig, Synth. Commun., 1995, 25, 1231–1238 CrossRef CAS.
- D. M. Hodgson and S. Man, Chem.–Eur. J., 2011, 17, 9731–9737 CrossRef CAS PubMed.
- H. R. Frisch, US Pat., US2582114A, 1949.
- M. F. Handley, US Pat., US2776982A, 1953.
- V. G. Dryuk, Tetrahedron, 1976, 32, 2855–2866 CrossRef CAS.
- J. Tong, W. Li, L. Bo, H. Wang, Y. Hu, Z. Zhang and A. Mahboob, J. Catal., 2016, 344, 474–481 CrossRef CAS.
- N. Masunga, G. S. Tito and R. Meijboom, Appl. Catal., A, 2018, 552, 154–167 CrossRef CAS.
- G. Grigoropoulou, J. H. Clark and J. A. Elings, Green Chem., 2003, 5, 1–7 RSC.
- X. Yang, S. Gao and Z. Xi, Org. Process Res. Dev., 2005, 9, 294–296 CrossRef CAS.
- B. Singh and A. K. Sinha, J. Mater. Chem. A, 2014, 2, 1930–1939 RSC.
- D. K. Dumbre, V. R. Choudhary, N. S. Patil, B. S. Uphade and S. K. Bhargava, J. Colloid Interface Sci., 2014, 415, 111–116 CrossRef CAS PubMed.
- G. Wang, S. Zhang, Y. Huang, F. Kang, Z. Yang and Y. Guo, Appl. Catal., A, 2012, 413–414, 52–61 CrossRef CAS.
- J. Sebastian, K. M. Jinka and R. V. Jasra, J. Catal., 2006, 244, 208–218 CrossRef CAS.
- V. R. Choudhary, R. Jha and P. Jana, Green Chem., 2006, 8, 689 RSC.
- X. Bian, Q. Gu, L. Shi and Q. Sun, Chin. J. Catal., 2011, 32, 682–687 CAS.
- Q. Gu, D. Han, L. Shi and Q. Sun, J. Nat. Gas Chem., 2012, 21, 452–458 CrossRef CAS.
- D. Tang, W. Zhang, Y. Zhang, Z. A. Qiao, Y. Liu and Q. Huo, J. Colloid Interface Sci., 2011, 356, 262–266 CrossRef CAS PubMed.
- N. S. Patil, B. S. Uphade, D. G. McCulloch, S. K. Bhargava and V. R. Choudhary, Catal. Commun., 2004, 5, 681–685 CrossRef CAS.
- N. S. Patil, R. Jha, B. S. Uphade, S. K. Bhargava and V. R. Choudhary, Appl. Catal., A, 2004, 275, 87–93 CrossRef CAS.
- A. Iqbal, T. K. Hou, U. S. Shaari, F. Adam, N. H. H. Abu Bakar, L. D. Wilson, N. F. Jaafar, M. Hazwan Hussin and M. A. Afandi, in Materials Today: Proceedings, Elsevier, 2018, vol. 5, pp. 21584–21593 Search PubMed.
- R. Tayebee, M. M. Amini, M. Akbari and A. Aliakbari, Dalton Trans., 2015, 44, 9596–9609 RSC.
- Q. Tang, Q. Zhang, H. Wu and Y. Wang, J. Catal., 2005, 230, 384–397 CrossRef CAS.
- M. Pirouzmand, M. Asadi and A. Mohammadi, Greenhouse Gases: Sci. Technol., 2018, 8, 462–468 CrossRef CAS.
- J. N. Appaturi, F. Adam and Z. Khanam, Microporous Mesoporous Mater., 2012, 156, 16–21 CrossRef CAS.
- C. J. Thompson, J. S. Loring, B. P. McGrail, K. M. Rosso, E. S. Ilton, P. F. Martin, H. T. Schaef, P. Bénézeth, A. R. Felmy, J. Chen, O. Qafoku and N. M. Washton, Langmuir, 2015, 31, 7533–7543 CrossRef PubMed.
- Y. L. Huang, H. W. Tien, C. C. M. Ma, S. Y. Yang, S. Y. Wu, H. Y. Liu and Y. W. Mai, J. Mater. Chem., 2011, 21, 18236–18241 RSC.
- C. Molina, K. Dahmouche, P. Hammer, V. de Z. Bermudez, L. D. Carlos, M. Ferrari, M. Montagna, R. R. Gonçalves, L. F. C. deOliveira, H. G. M. Edwards, Y. Messaddeq and S. J. L. Ribeiro, J. Braz. Chem. Soc., 2006, 17, 443–452 CrossRef CAS.
- M. E. Simonsen, C. Sønderby, Z. Li and E. G. Søgaard, J. Mater. Sci., 2009, 44, 2079–2088 CrossRef CAS.
- X. Deng, T. Herranz, C. Weis, H. Bluhm and M. Salmeron, J. Phys. Chem. C, 2008, 112, 9668–9672 CrossRef CAS.
- R. Kotz, Spectroscopic and Diffraction Techniques in Interfacial Electrochemistry, Springer Science+Business Media, 1990 Search PubMed.
- A. V. Naumkin, A. Kraut-Vass and C. J. Gaarenstroom, S. W. Powell, NIST X-ray Photoelectron Spectroscopy Database, NIST Standard Reference Database Number 20, https://srdata.nist.gov/xps/EngElmSrchQuery.aspx?EType=PE%26CSOpt=Retri_ex_dat%26Elm=Mg, accessed 29July 2018 Search PubMed.
- A. R. González-Elipe, J. P. Espinós, G. Munuera, J. Sanz and J. M. Serratosa, J. Phys. Chem., 1988, 92, 3471–3476 CrossRef.
- W. B. Simmons, Encycl. Br., 2014 Search PubMed.
- S. Ardizzone, C. L. Bianchi, M. Fadoni and B. Vercelli, Appl. Surf. Sci., 1997, 119, 253–259 CrossRef CAS.
- K. Narasimharao, T. T. Ali, S. Bawaked and S. Basahel, Appl. Catal., A, 2014, 488, 208–218 CrossRef CAS.
- J. A. Tangeman, B. L. Phillips, A. Navrotsky, J. K. R. Weber, A. D. Hixson and T. S. Key, Geophys. Res. Lett., 2001, 28, 2517–2520 CrossRef CAS.
- C.-X. Gui, Q.-Q. Wang, S.-M. Hao, J. Qu, P.-P. Huang, C.-Y. Cao, W.-G. Song and Z.-Z. Yu, ACS Appl. Mater. Interfaces, 2014, 6, 14653–14659 CrossRef CAS PubMed.
- M. Thommes, K. Kaneko, A. V. Neimark, J. P. Olivier, F. Rodriguez-Reinoso, J. Rouquerol and K. S. W. Sing, Pure Appl. Chem., 2015, 87, 1051–1069 CAS.
- C. Huo, J. Ouyang and H. Yang, Sci. Rep., 2015, 4, 3682 CrossRef PubMed.
- D. O. Volkov, J. Benson, Y. Y. Kievsky and I. Sokolov, Phys. Chem. Chem. Phys., 2010, 12, 341–344 RSC.
- W. Wang, G. Tian, D. Wang, Z. Zhang, Y. Kang, L. Zong and A. Wang, Sci. Rep., 2016, 6, 39599 CrossRef CAS PubMed.
- R. W. Stevens, R. VSiriwardane and J. Logan, Energy Fuels, 2008, 22, 3070–3079 CrossRef CAS.
- B. Tremblay, P. Roy, L. Manceron, M. Esmaïl Alikhani and D. Roy, J. Chem. Phys., 1996, 104, 2773–2781 CrossRef CAS.
- H. I. DeLasa and B. Serrano-Rosales, Advances in Chemical Engineering, Photocatalytic Technologies, Academic, 2009, vol. 36 Search PubMed.
- T. A. G. Duarte, A. C. Estrada, M. M. Q. Simões, I. C. M. S. Santos, A. M. V. Cavaleiro, M. G. P. M. S. Neves and J. A. S. Cavaleiro, Catal. Sci. Technol., 2015, 5, 351–363 RSC.
- P. Pędziwiatr, F. Mikołajczyk, D. Zawadzki, K. Mikołajczyk and A. Bedka, Acta Innovations, 2018, 45–52 Search PubMed.
- Y. Liang, C. Yi, S. Tricard, J. Fang, J. Zhao and W. Shen, RSC Adv., 2015, 5, 17993–17999 RSC.
- X. Yuan, Q. Wang, J. H. Horner, X. Sheng and M. Newcomb, Biochemistry, 2009, 48, 9140–9146 CrossRef CAS PubMed.
- G. D. Yadav and A. A. Pujari, Org. Process Res. Dev., 2000, 4, 88–93 CrossRef CAS.
- S. Rahman, S. A. Farooqui, A. Rai, R. Kumar, C. Santra, V. C. Prabhakaran, G. R. Bhadu, D. Sen, S. Mazumder, S. Maity, A. K. Sinha and B. Chowdhury, RSC Adv., 2015, 5, 46850–46860 RSC.
- G. D. Yadav and I. V. Borkar, AIChE J., 2006, 52, 1235–1247 CrossRef CAS.
Footnote |
| † Electronic supplementary information (ESI) available. See DOI: 10.1039/c9ra08024d |
| This journal is © The Royal Society of Chemistry 2019 |

