
 Open Access Article
 This Open Access Article is licensed under a Creative Commons Attribution-Non Commercial 3.0 Unported Licence
Photoabsorption markers of pressure-induced phase changes in small mercury clusters. A case study on Hg8
Martina Šarmanová†
ab,
Aleš Víteka,
Rajko Ćosić ac and
René Kalus*a
ac and
René Kalus*a
aIT4Innovations, VŠB–Technical University of Ostrava, 17. listopadu 2172/15, 708 00 Ostrava-Poruba, Czech Republic. E-mail: rene.kalus@vsb.cz
bOlga Havlová Grammar School, Marie Majerové 1691, 708 00 Ostrava-Poruba, Czech Republic
cDepartment of Applied Mathematics, VŠB–Technical University of Ostrava, 17. listopadu 2172/15, 708 00 Ostrava-Poruba, Czech Republic
First published on 14th November 2019
Abstract
Photoabsorption spectra of Hg8 have been calculated at various cluster temperatures and external pressures. A diatomics-in-molecules method has been used to model cluster electronic structure and classical isothermal–isobaric Monte Carlo simulations have been employed for sampling representative cluster configurations. Contributions of different structural isomers of the Hg8 cluster have been analyzed and related to structural transitions in the cluster, particularly those induced by an increased pressure.
1. Introduction
Flexible, weakly bound complexes may undergo, in contrast to covalently bound molecules, significant changes in their geometric structure if they are exposed to increased temperature. These changes comprise either deformations of their equilibrium structure (represented by the global minimum on their potential energy surface and often denoted as the stable isomer of the complex) or switches between the global minimum and other, local minima (metastable isomers) or between various local minima. If different local minima become accessible under specific conditions, so called phase changes1,2 take place in the studied system. Alternatively, structural changes can be achieved by varying the external pressure the studied system is exposed to if metastable isomers are more compact than the stable one.3,4The phase changes can be identified by inspecting temperature and/or pressure dependences of specific properties of the system which are directly or indirectly sensitive to changes of the layout of atoms of the system in space. For example, internal energy (enthalpy), heat capacity, correlations between various quantities (like the Pearson coefficient for the energy and the system volume3), and Lindemann index5 are used to pinpoint regions on the temperature and/or pressure scales where the phase changes take place (so called coexistence regions since various structural motifs coexist during a particular phase change1,2). Note, however, that none of the quantities is of a universal use and they must be often combined to identify phase changes of various kinds as completely as possible.
One of the physical properties which are sensitive to the geometric structure of flexible complexes is the way they interact with electromagnetic radiation, experimentally represented by their photoabsorption spectra. For these systems, the photoabsorption spectrum usually consists of a set of more or less broad absorption bands the positions and heights of which may considerably change after ambient conditions have been modified. Moreover, photoabsorption spectra can readily be recorded and, thus, used in experimental studies of phase changes in small systems for which more conventional methods (like heat capacity measurements) are not easily practicable.6 As a consequence, modelings aimed at shedding light on the nature the interaction of the studied system with radiation is influenced by ambient conditions (temperature and pressure) is of particular interest.
Small mercury clusters, HgN, are very appropriate for such studies. Firstly, if small sizes (N ≲ 13–20) are considered, the clusters are bound by weak forces of the van der Waals type7,8 and even if the size is increased and the bond type changes from van der Waals to semi-covalent and metallic, their flexibility is conserved. Secondly, they exhibit9 quite strong absorption in the UV region (resulting from 6s → 6p excitations in the Hg atom). Thirdly and most importantly, this photoabsorption can be rather easily modeled in theoretical calculations by taking advantage of a computationally cheap and, at the same time, realistic model of intra-cluster interactions10,11 providing both the electronic ground state as well as all relevant excited states of a HgN cluster of basically any size.
The interaction of mercury clusters with electromagnetic radiation have received a considerable attention, both experimentally.9,12–17 and theoretically,18–20 in the literature.21 The topics covered comprise, e.g., photoabsorption of ionic12–14,20 as well as neutral9 mercury clusters, photoionization and photoelectron spectroscopy of the latter,15,16 their post-excitation dynamics,18,19 or even photoinduced nucleation in mercury vapor.17 Note, however, that gas-phase conditions have been mostly considered in those preceding studies without any explicit control of clusters temperature and/or external pressure.
Recently, we have performed a series of gas-phase (zero-pressure) calculations of the photoabsorption spectra of smallest HgN clusters (N ≤ 5) covering a broad range of clusters temperatures.22 The potential energy surfaces of these smallest clusters are, however, too simple (they contain only one, global minimum) to lead to qualitative changes in the calculated photoabsorption spectra with increased temperature and/or pressure. It is the main aim of the present work to extend this preceding study to larger cluster sizes for which more than one structural isomer exist and observable changes in their structure and, consequently, in their response to electromagnetic radiation may be expected. Specifically, changes induced by increased pressure are of particular interest here.
The smallest cluster of this more complex type is the mercury hexamer, Hg6, with two structural isomers, followed by 4, 5, 14, and (probably more than) 24 structural isomers existing for Hg7, Hg8, Hg9, and Hg10, respectively. Since the main interest of the present work is on pressure-induced phase changes, several conditions must be obeyed for the cluster to be useful for related computations: (a) metastable, energetically richer isomers must have smaller volumes than the stable, lowest-energy isomer (so that the decreased PV term in the cluster enthalpy is able to compensate the increased cluster energy if metastable isomers get into play) and (b) differences between binding energies of the isomers must be small enough (so that such a compensation can efficiently apply at not too high pressures). Two HgN clusters meet these conditions for the cluster sizes considered here: Hg8 (the binding energies and volumes of its structural isomers are shown in Table 1) and Hg9, the first metastable isomer of which has the volume by about ΔVe ≈ 30 Å3 smaller than the stable isomer while its binding energy is only slightly higher (ΔDe ≈ 15 meV).23 For computational reasons, the smaller cluster, Hg8, is considered.
| Isomer | Symmetry | De (ΔDe) | D0 (ΔD0) | Moments of inertia | Ve |
|---|---|---|---|---|---|
| 1 | Cs | 1.289 (0.170) | 1.222 (0.162) | 32.7 46.3 58.5 | 225 |
| 2 | C2v | 1.288 (0.170) | 1.221 (0.160) | 31.0 47.1 52.8 | 220 |
| 3 | D3d | 1.227 (0.108) | 1.162 (0.101) | 23.8 62.4 62.4 | 207 |
| 4 | C2v | 1.209 (0.091) | 1.145 (0.085) | 33.1 50.4 59.7 | 209 |
| 5 | Td | 1.199 (0.081) | 1.137 (0.076) | 46.9 46.9 46.9 | 247 |
The rest of the paper is organized as follows. First, methodological and computational approaches relevant to the present computations (electronic structure model and simulation methods, including methods for finite system volume evaluation) are summarized in Sec. 2, then, main results (temperature and/or pressure dependent photoabsorption spectra of the Hg8 cluster, including resolved contributions from various structural isomers) are presented and discussed in Sec. 3, and finally, conclusive remarks and outlooks are provided in Sec. 4.
2. Methods and computations
The photoabsorption spectrum of a system is quantitatively represented via the effective photoabsorption cross-section. For a flexible system, it is calculated, within a semiclassical approximation, from the probabilities of transitions from the electronic ground-state to relevant electronically excited states which are averaged over an ensemble of (classical) nuclear configurations corresponding to particular ambient conditions,24,25
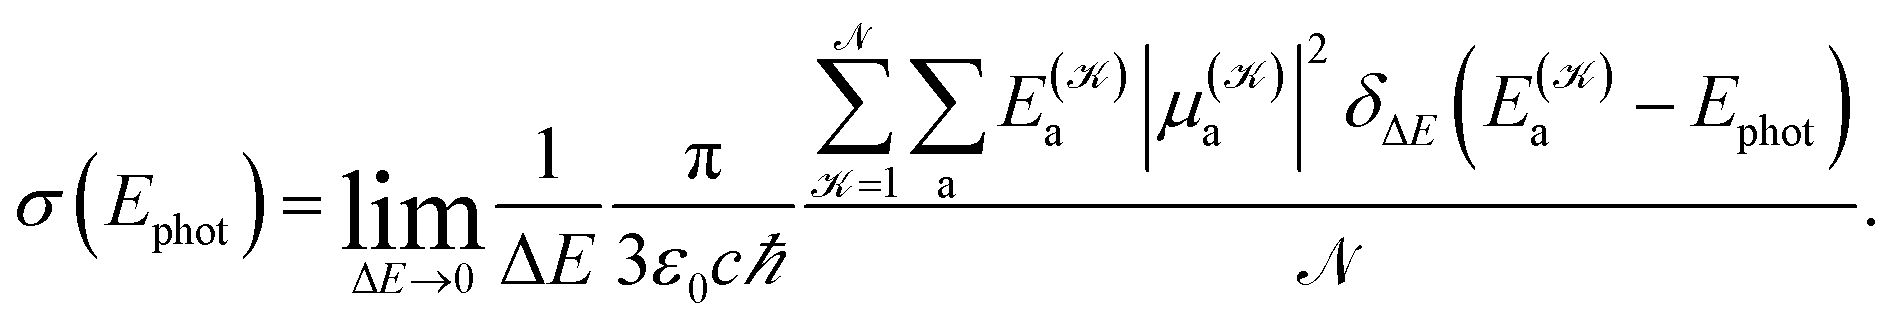 | (1) |
 distinguishes between different nuclear configurations sampled on the system ground-state potential energy surface, the first sum on the right-hand-side runs over a sufficiently large ensemble of such configurations, the second sum covers all the relevant electronic states of the system with
  and
and  respectively denoting their vertical excitation energies and transition dipole moments from the ground state, and δΔE(X) = 1 for |X| ≤ ΔE/2 and zero otherwise. The other symbols have the usual meaning, ε0 is the vacuum permittivity, c stands for the vacuum light velocity, and ℏ = h/2π denotes the reduced Planck constant.
The following is thus needed for a photoabsorption cross-section calculation: (a) an electronic structure method providing, with a sufficient accuracy, electronic energies of both the electronic ground-state and all relevant excited states as well as related transition dipole moments and (b) an efficient method for sampling nuclear configurations. The former subject (a) has already been described in detail in the preceding paper22 (as well as in other studies cited therein) and only a short account is provided for reader's convenience in the immediately following subsection. The methods of sampling nuclear configurations (b) are discussed in a somewhat greater detail afterwards.
2.1. Electronic structure calculations
The effective electronic Hamiltonian used in our calculations is constructed within the diatomics-in-molecules (DIM) approach.26 This method consists of writing the overall electronic Hamiltonian operator as a sum of diatomic and atomic contributions,
 | (2) |
Since the basis sets usually used in DIM models are rather small, the method itself is not of a very high quality. Its popularity stems, however, from the known fact that its accuracy can be dramatically increased if highly accurate diatomic and atomic inputs are employed (as discussed, e.g., for rare-gas cluster cations in ref. 27–29). These inputs are usually taken from high-level ab initio calculations and/or experiments. In this way, reliable results can be obtained for large systems, e.g., at the expense of ab initio calculations performed on much smaller subsystems (diatomic and atomic fragments). In our calculations, diatomic inputs have been taken from accurate ab initio calculations,30–32 and the atomic inputs, namely the atomic excitation energies (without the inclusion of the spin–orbit coupling) of the 6s2(1S) → 6s16p1(1P) and 6s2(1S) → 6s16p1(3P) transitions, have been adopted as proposed in ref. 10. For a more detailed description, see either our preceding paper22 or the original papers by Kitamura.10,11
Another important advantage of the DIM approach, when applied to mercury clusters, is the possibility to easily include the spin–orbit (SO) coupling10 using a simple atoms-in-molecules scheme.33 Most importantly, this approach does not extend the dimension of the electronic Hamiltonian matrix and requires only two additional parameters to be supplied from outside. Specifically, a parameter representing the SO splitting of the 3P electronic state of the Hg atom is needed together with another parameter quantifying the interaction between the 3P and 1P atomic states. In this work, the two SO coupling constants have been derived from experimental data as reported in ref. 34.
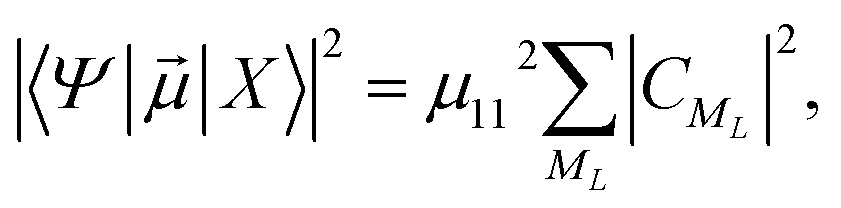
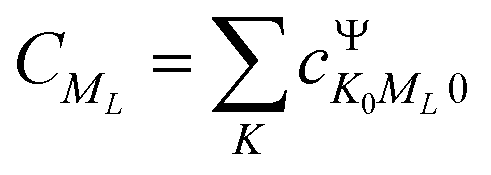
he transition dipole moments (TDMs) between the HgN electronic ground-state and excited states have been calculated, as proposed in ref. 10 and used in our preceding paper,22 from another atoms-in-molecules model. After some computations (see ref. 22 for a detailed explanation), the following formula is obtained after one denotes the electronic ground state of the HgN cluster by |X〉 and a particular excited state by |Ψ〉,
 | (3) |
 and
and  represents the expansion coefficient of the HgN excited state, |Ψ〉, with respect to the DIM basis set wave function corresponding to the 1P atomic (Hg) excitation localized on atom N and with the projection of the electronic orbital angular momentum ML; μ11 is the atomic TDM corresponding to the 1S → 1P transition, μ11 = 1.55 bohr.10
2.2. Sampling of nuclear configurations
A Monte Carlo method for sampling in the isothermal–isobaric ensemble has been used. The method is based on a usual Metropolis algorithm,35 originally proposed for canonical (isothermal–isochoric) simulations, with only the canonical weight, ρc ∼ exp[−βE(R)], replaced by a weight appropriate for the isothermal–isobaric ensemble,| ρ ∼ e−β[E(R)+PV(R)]. | (4) |
 using a random and isotropic displacement of a one-by-one selected atom36 and, then, the new configuration is accepted,
 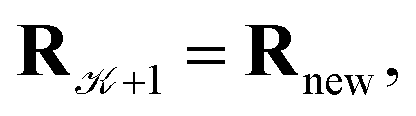 with probability
 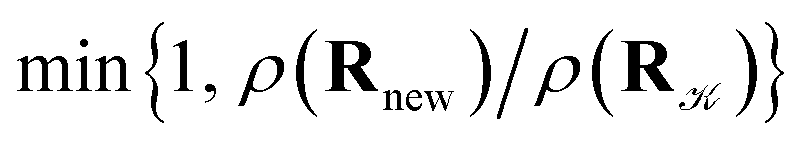 and rejected,
 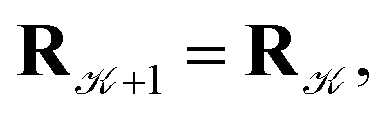 with the complementary probability,
  The cluster volume has been estimated, after each proposal step, as the volume of a convex hull of nuclei represented by spheres of a radius equal to the van der Waals radius of the mercury atom (r = 1.55 Å)37,38. An in-house code implementing the QuickHull algorithm39 has been used for cluster convex hull calculations. The maximum distance of the displacement in the proposal step has been adjusted dynamically so that the average acceptance probability has been kept around 0.5.40 The simulated cluster has always been placed in a hard-wall spherical container of radius Rc = 100 Å to avoid escapes of atoms to “infinity”, which may occur at high temperatures and low pressures and which would eventually lead to the crash of a particular simulation.
A cycle comprising all the attempts to change the positions of all the atoms in the cluster will be denoted as a sweep. Typically, 13 × 106 sweeps have been generated for each temperature and pressure with 5 × 10⁵ of them ignored at the beginning of each simulation to allow a proper equilibration of the simulated cluster. Only each 50th sweep has been taken into account afterwards to avoid non-physical correlations between generated samples. As a consequence, about  cluster configurations have been used in eqn (1).
A parallel-tempering algorithm41–43 has been employed to enhance the efficiency of convergence of performed simulations. Such an enhancement is necessary for larger clusters, unlike the preceding calculations22 focusing on clusters for which only one minimum exists on their ground-state potential energy surfaces, since, in the present work, several structurally different minima are involved and transitions between them have to be included properly. A two-dimensional variant of the parallel-tempering approach44 has been used consisting in (a) simulating the cluster at different temperatures and pressures in parallel and (b) periodically swapping configurations between neighboring temperatures and/or pressures. To preserve the detailed balance, a proposed swap of configurations between systems A and B has been accepted with probability44
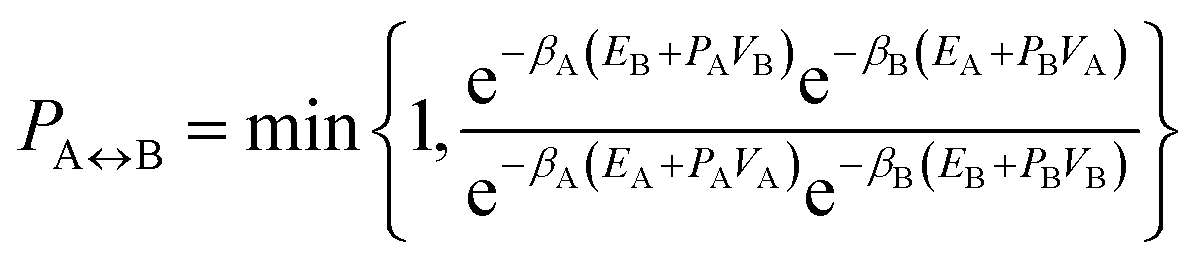 | (5) |
As a complement to the Monte Carlo sampling described above, another sampling approach has also been used to identify contributions of various structural isomers of the simulated cluster to the overall photoabsorption spectrum. This approach consists of sampling cluster configurations from the square of the ground-state nuclear vibrational wave functions calculated at the harmonic approximation level (see, e.g., ref. 46). It means that, first, equilibrium geometries of different structural isomers are found as local minima on the cluster (ground-state) potential energy surface and, then, the Hessian matrix is calculated for each isomer and diagonalized. The latter leads to harmonic vibrational frequencies and normal vibrational modes of the cluster. The ground-state vibrational wave function is then expressed as a product of independent normal modes Gaussians, which can easily be used to sample normal modes coordinates. Finally, the eigenvectors of the Hessian matrix enable to return back to simulation (usually Cartesian) coordinate system. Effectively, this sampling approach corresponds to a full quantum description of nuclei moving around the potential energy minimum corresponding to a particular structural isomer of the cluster at zero temperature and zero pressure.
3. Results and discussions
3.1. Structures and zero-temperature photoabsorption spectra of Hg8 structural isomers
We start our discussion with analyzing contributions of different structural isomers of the Hg8 cluster to its overall photoabsorption spectrum. For this, spectra of particular isomers found for this cluster have been calculated using their ground-state vibrational wave functions obtained at the harmonic approximation level.First, the isomers have been identified by locally optimizing the configurations resulting from high-temperature runs of the performed Monte Carlo simulations. Results are summarized in Tables 1 and 2. Altogether, five isomers have resulted from these optimization calculations. Interestingly, the first metastable isomer (isomer 2), has almost the same binding energy as the stable isomer (isomer 1), either with the zero-point energy considered or not, despite the fact that their equilibrium geometries are quite different. As a consequence, both isomers may play a role even at low temperatures and, at the same time, their contributions to the photoabsorption spectrum of Hg8 are expected to visibly differ from each other. The other isomers are somewhat higher in energy and they cannot get into play at temperatures below T ≈ 40–60 K (a rough estimate made from the assumption of the equipartition of thermal energy). Another interesting observation is obvious if one inspects estimated volumes of the isomers. Except for the highest isomer (isomer 5), all the other metastable isomers have the volumes significantly lower than the stable one. As a consequence, these isomers are expected to gradually enter the game as the external pressure is increased (due to the PV term in eqn (4)). This particularly holds for isomer 2 which is only marginally higher in energy than the stable isomer.
| Isomer | Front view | Side view |
|---|---|---|
| 1 |  |
 |
| 2 |  |
 |
| 3 |  |
 |
| 4 |  |
 |
| 5 |  |
 |
The results of Table 1 can be directly compared with the data published recently by Calvo et al.,47 which were obtained using the same interaction model as that employed in the present work. In that study, however, only stable isomers have been reported for mercury clusters. For the Hg8 cluster, the Cs geometry of its stable isomer we have obtained from our calculations compares, on one hand, very well with the geometry reported in ref. 47. The binding energy provided for this isomer by Calvo et al. (De = 1.299 eV) slightly differs, on the other hand, from our estimate (De = 1.289 eV). Since the Hg8 potential energy surface is simple enough for any optimization method to arrive at a true global minimum, we believe that the observed deviation must be due to numerical differences in the interaction model implementations by Calvo et al. and ours. Probably different methods used to represent the diatomic inputs of the DIM model contribute.
A lot of other theoretical studies on the equilibrium structures of mercury clusters of small and medium sizes have been published in the literature. They comprise calculations based on semiempirical models,48,49 calculations using DFT-based methods,50–52 as well as post Hartree-Fock correlated calculations.50,53,54 However, the data (most importantly, geometric structures and binding energies of the clusters) reported from those calculations differ significantly from one another and a thorough analysis of these differences goes clearly beyond the scope of the present work. Shortly, the DFT-based methods seem to provide a promising way towards a reliable modeling of structures and energetics of mercury clusters. For example, they provide51,52 basically the same equilibrium structure of the Hg8 cluster as that resulting from our calculations and similar calculations by Calvo et al. Reported binding energies, however, strongly depend on a particular exchange–correlation functional used.50–52 A proper inclusion of the dispersion interaction55 seems crucial.56
Photoabsorption spectra of the five structural isomers of Hg8 are depicted in Fig. 1. All the isomers are considered in the main panel to get a global view while the absorption profiles of the two expectedly most important isomers 1 and 2 are depicted separately in the inset for clarity. As expected, quite complex structure of absorption peaks is seen if all the isomers are considered, mainly because their capability to absorb photons of various energies are quite different due to different geometric structures (see Table 1). For example, in the main absorption band observed between Ephot ≈ 7.3 eV and Ephot ≈ 7.7 eV, both the stable and all the metastable isomers contribute. The contributions of the metastable isomers are, however, visibly shifted, with respect to the peak attributed to the stable isomer 1, either to lower (isomers 2–4) or to higher (isomer 5) photon energies. Alike, the contributions of the metastable isomers at lower photon energies (Ephot ≲ 7.0 eV) differ considerably from the contributions of the stable isomer as well as from one another. As a consequence, absorption features of specific structural isomers of Hg8 are expected to be well distinguishable in the overall photoabsorption spectrum.
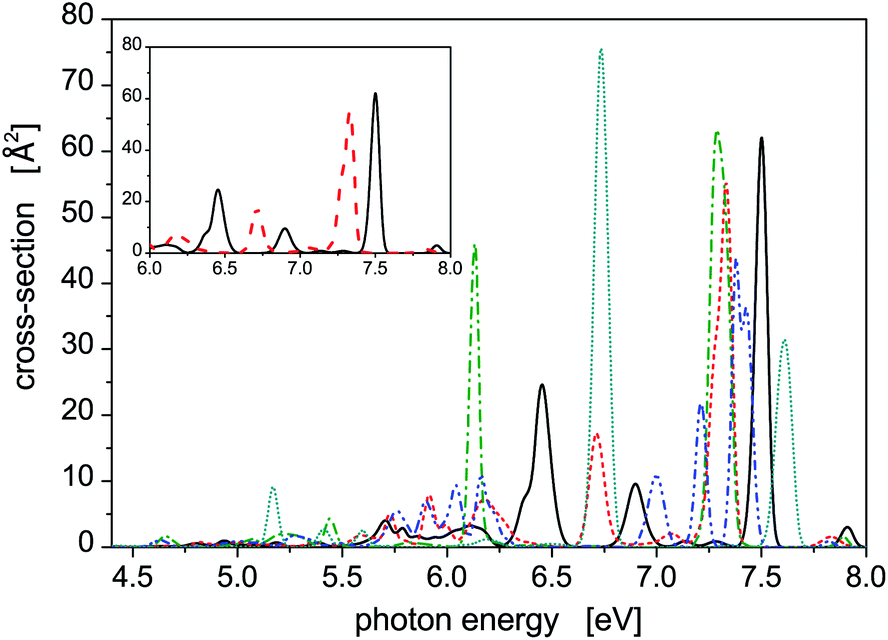 | ||
| Fig. 1 Photoabsorption spectra of structural isomers of the Hg8 cluster calculated at T = 0 K using the harmonic zero-point nuclear vibration wave function, isomer 1 – solid, isomer 2 – dash, isomer 3 – dash-dot, isomer 4 – dash-dot-dot, isomer 5 – dot. In the inset, a simplified view is provided comprising only isomers 1 and 2, i.e., the supposingly most relevant isomers under the conditions considered in this work. | ||
Let us further briefly discuss another interesting question, namely how much the SO coupling influences the capability of the Hg8 cluster to absorb photons of various energies. To illustrate this, photoabsorption spectra of isomer 1 and isomer 2, calculated using the DIM method with and without the inclusion of the SO coupling terms, are depicted in Fig. 2. Interestingly, the effect of the SO coupling is only moderate, maybe except for the region of Ephot ≈ 5.5–6.3 eV where the differences between corresponding SO and SO-free curves are better pronounced. In the latter case, however, the absorption efficiency of the Hg8 cluster is only marginal and observed peaks are unimportant as compared to other photon energies. For the main absorption peaks, the exclusion of the SO coupling almost does not change their heights and only slightly shifts the peaks to lower photon energies (on average, by about 0.05 eV). This holds for both isomer 1 and isomer 2. Note, however, that regardless of this observation we do consider the SO coupling in all the remaining calculations reported in this work since no computational overhead is associated with doing so.
 | ||
| Fig. 2 Comparison of the photoabsorption spectra of structural isomers 1 (solid lines) and 2 (dashed lines) of the Hg8 cluster calculated in the same way as the spectra reported in Fig. 1 with (thick lines) and without (thin lines) the spin–orbit coupling included. | ||
3.2. Dependence of the Hg8 photoabsorption spectrum on temperature
Photoabsoprtion spectra of Hg8 calculated at atmospheric pressure (P = 105 Pa) and selected temperatures lying below the estimated evaporation temperature (Tevap ≈ 110 K)45 are depicted in Fig. 3. In the recorded profiles, five main absorption peaks representing contributions of different isomers are seen. Interestingly, only two energetically lowest isomers contribute. The five peaks are best pronounced for the lowest temperature (T = 10 K), three of them belonging to isomer 1 (Ephot ≈ 7.5 eV, Ephot ≈ 6.9 eV, and Ephot ≈ 6.4 eV) and two more corresponding to contributions of isomer 2 (Ephot ≈ 7.3 eV and Ephot ≈ 6.7 eV). As the cluster temperature increases, the peaks become broader and lower and the two peaks of isomer 1 and isomer 2 seen at Ephot ≈ 7.3–7.5 eV gradually merge together.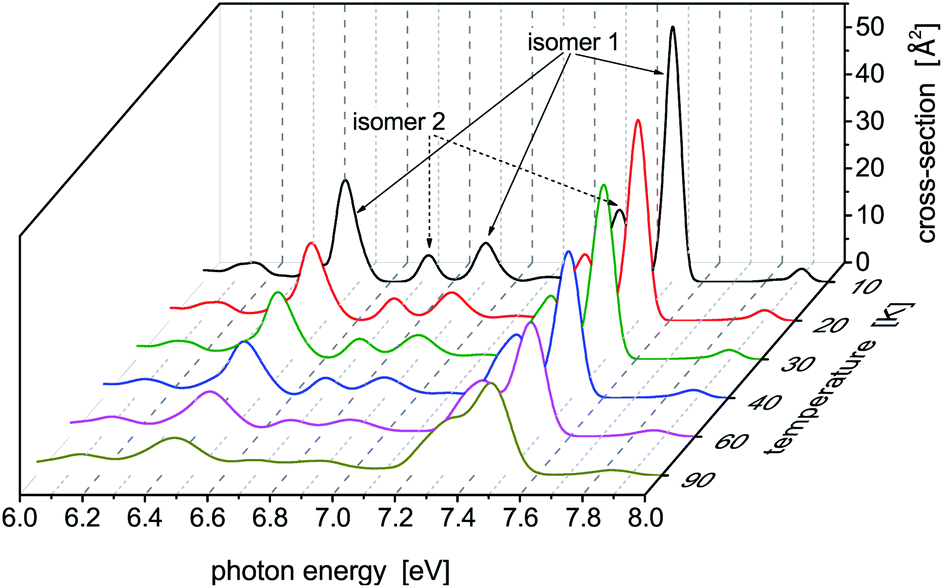 | ||
| Fig. 3 Photoabsorption spectra of the Hg8 cluster calculated via the classical isothermal–isobaric Monte Carlo approach at low pressure (P = 105 Pa) and various temperatures. Contributions of different structural isomers of Hg8 are indicated for T = 10 K. | ||
Note that even for the highest temperature we have considered, no higher metastable isomers contribute (as verified by local optimizations of structures recorded during the simulations) even though they should if only energetic openness of their appearance were considered. For example, only traces of isomer 3 (0.03%) have been detected at T = 90 K, not below, however, and no energetically reacher isomers 4 and 5 have been detected even at this rather high temperature. Probably, entropic effects are responsible for this behavior. Moreover, the stable isomer 1 prevails at all the temperatures considered, even though its abundance slightly decreases from about 75% obtained at T = 10 K to about 65% recorded at T = 90 K.
A note concerning the cluster temperature is needed here. All the calculations presented in this work have been performed using classical Monte Carlo methods, i.e., nuclear quantum effects have not been considered explicitly. As discussed in the preceding paper,22 this may not be fully correct, despite the fact that heavy atoms are involved, if low temperatures are considered. Therefore, increased effective temperatures are needed in classical calculations to take quantum nuclear delocalization into account. For example, preliminary path-integral Monte Carlo57 calculations seem to indicate that, in the case of the Hg8 cluster, the lowest temperature considered in the present classical calculation, T = 10 K, corresponds to Tquant ≈ 5 K used in the quantum calculation (photoabsorption spectra recorded at these two temperatures in classical and quantum calculations, respectively, are very close to each other) and that the classical and quantum temperatures become more or less the same once the temperature rises above T ≈ 15–20 K. As a consequence, the lowest temperature considered in this work represents a cluster temperature which would be about twice lower if nuclear quantum effects were taken into account while at higher temperatures nuclear quantum effects seem to disappear and classical simulations are highly probably fully applicable.
3.3. Dependence of the Hg8 photoabsorption spectrum on pressure
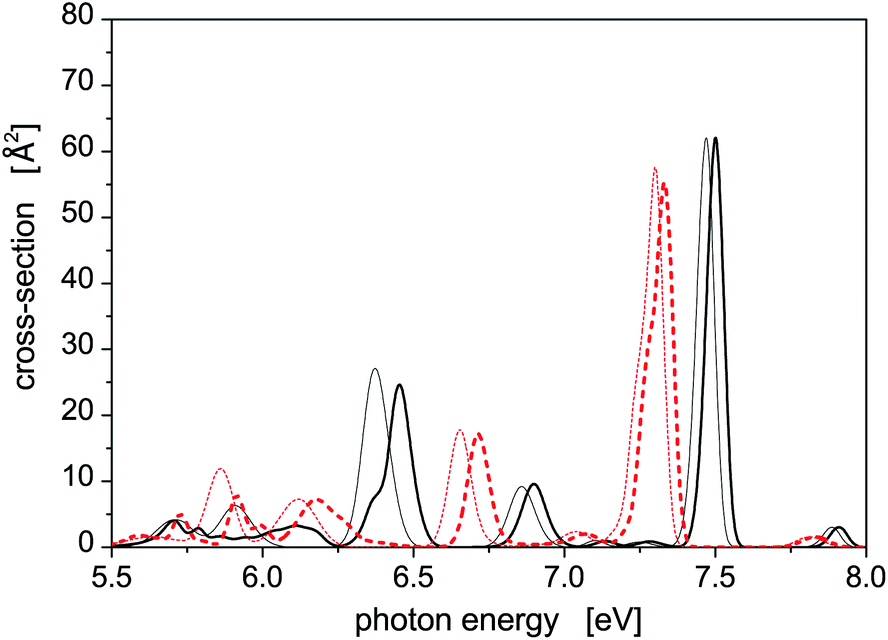
While no dramatic changes occur in the photoabsorption spectrum of Hg8 when the cluster temperature is increased, the situation is quite different if external pressure increases. This is clearly seen in Fig. 4 where the evolution of the Hg8 photoabsorption spectrum with increasing pressure is depicted. For clarity, only two cluster temperatures are considered in two separate figure panels.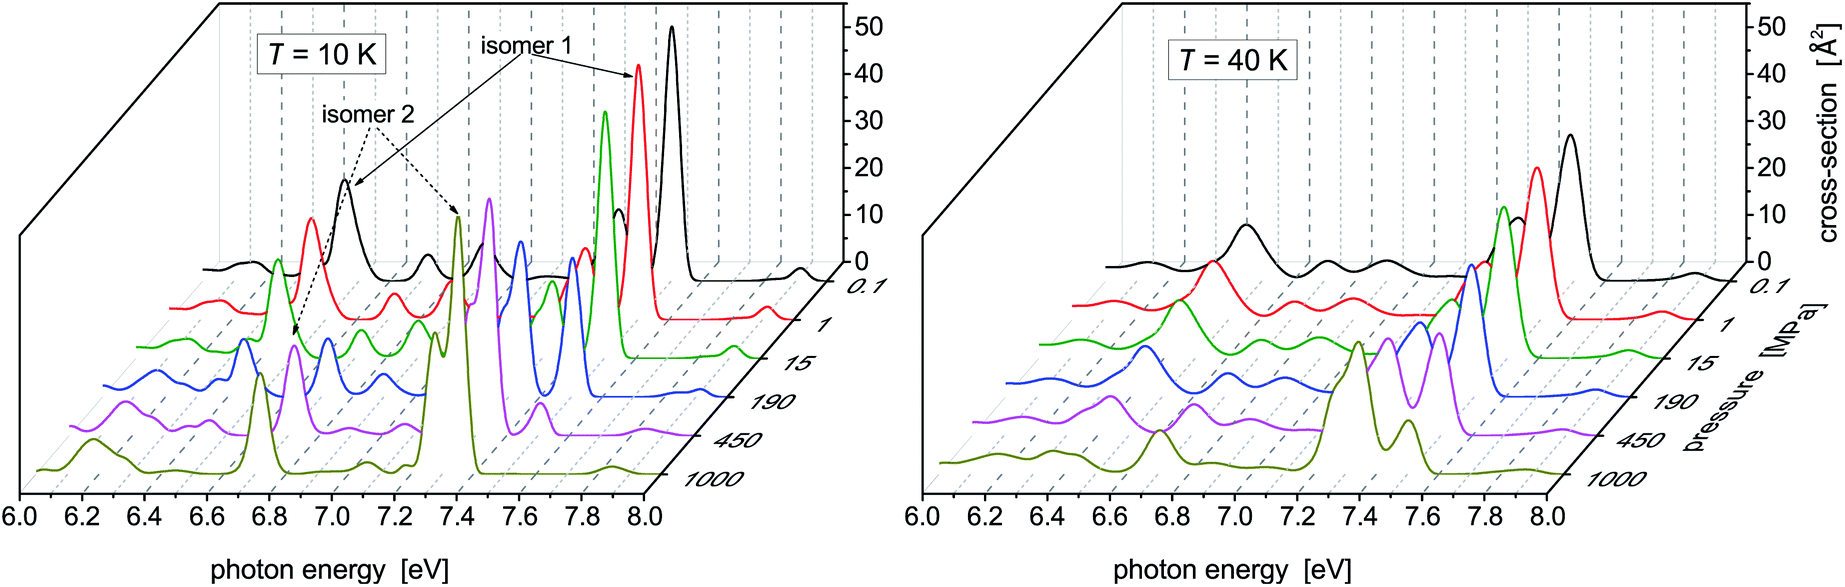 | ||
| Fig. 4 Photoabsorption spectra of the Hg8 cluster calculated via the classical isothermal–isobaric Monte Carlo approach at two representative temperatures and various pressures. | ||
For the lower temperature (T = 10 K), the picture we obtained is better resolved and sharper. Up to P ≈ 150 MPa, the stable isomer 1 dominates. However, at P ≈ 190 MPa the contributions of isomer 1 and isomer 2 become more or less the same and, finally, at the highest pressure (P = 1 GPa) the contribution of isomer 1 completely disappears. A similar picture is seen for the higher temperature (T = 40 K), just the isomer 1 to isomer 2 transition is pushed to higher pressures (the contributions of the two isomers become of the same value at about P ≈ 450 MPa) and even at P = 1 GPa isomer 1 still contributes. One can thus conclude that, at high pressures, isomer 2 of the Hg8 cluster becomes more important than isomer 1 (due to its smaller volume) and that this fact is observably reflected in the Hg8 photoabsorption spectrum by a well seen shift of the main absorption bands along the photon energy axis as pressure increases.
The increased role of isomer 2 is further illustrated in Fig. 5 where average abundances of isomers 1 and 2 are plotted, for selected temperatures, against the external pressure the cluster is subjected to. In this figure, the same features are seen as above: (a) the dominance of the stable isomer 1 at low pressures (irrespective of cluster temperature), (b) a transition from isomer 1 to isomer 2 at intermediate pressures (the higher is the cluster temperature, the higher pressure is needed), and (c) a dominance of isomer 2 at high pressures. Isomer 1 will highly probably completely disappear at sufficiently high pressures. In the pressure range considered in this work, this occurs for the lowest temperature. For higher temperatures, higher pressures (P > 1 GPa) would be needed, but the approach of the abundance of isomer 1 to zero with increased pressure is clear.
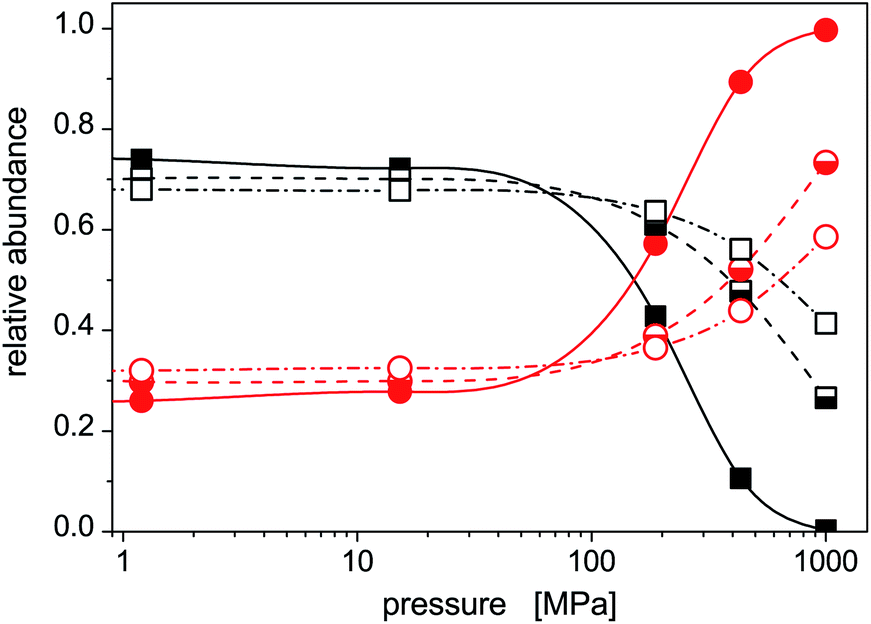 | ||
| Fig. 5 Pressure dependences of relative abundances of isomer 1 (squares) and isomer 2 (circles) of the Hg8 cluster calculated via the classical isothermal–isobaric Monte Carlo approach for selected cluster temperatures, solid symbols T = 10 K, half-filled symbols T = 40 K, and open symbols T = 60 K. | ||
4. Conclusions
Photoabsorption spectra of Hg8 have been calculated for selected temperatures and pressures (T ∈ [10, 90] K and P ∈ [0.1, 1000] MPa) using a parallel-tempering Monte Carlo method for the classical isothermal–isobaric ensemble44 and a diatomics-in-molecules electronic structure model.10,11 The main emphasis has been placed on the identification of changes in the calculated spectra with increased cluster temperature and (mainly) external pressure and on relating them to structural (phase) changes occurring in the cluster. The structural changes themselves have been identified using relative abundances of structural isomers of the Hg8 cluster calculated at different temperatures and pressures by locally optimizing the Hg8 geometries sampled in Monte Carlo simulations.Five structural isomers have been found for the Hg8 cluster (see Table 1 for a summary). However, only two of them, the stable isomer (isomer 1 in Table 1) and the energetically lowest metastable isomer (isomer 2), contribute at pressures and temperatures considered in this work. The photoabsorption spectra of the two isomers (see Fig. 1) differ visibly from each other and, consequently, changes in isomers abundances are well reflected in the overall photoabsorption profiles recorded for the Hg8 cluster (see Fig. 3 and 4).
At low pressures, the evolution of the Hg8 spectrum is smooth and no major (qualitative) changes are observed if cluster temperature is changed and pressure is kept constant. This is mainly due to the fact that the abundances of the two contributing isomers of the Hg8 cluster do not change much with temperature in this pressure range.
If the external pressure is increased, on the other hand, well pronounced and significant changes are observed in the calculated photoabsorption spectra. Such behavior stems from a transition in the population of Hg8 from the stable isomer to the lowest metastable isomer as pressure increases, mainly because the two isomers have close binding energies, but differ non-negligibly in their volumes. The volume of isomer 2 is by about ΔV ≈ 5 Å3 smaller than the volume of isomer 1. The PV term in the isothermal–isochoric statistical weight (see eqn (4)) induces then a decrease of the abundance of isomer 1 in the Hg8 population in favor of isomer 2 as pressure increases and eventually leads to its complete disappearance (see Fig. 5). These changes are clearly reflected in the change of patterns seen in the Hg8 photoabsorption spectrum as the external pressure increases.
Note also that similar effects, like those discussed in the present work for Hg8, could as well be expected for other small HgN clusters (cf. a short discussion on this subject in the Introduction section). Presently, additional calculations are running with the main goal to in detail describe and understand pressure-induced phase changes in small mercury clusters and to analyze the possibility of their detection through HgN photoabsorption measurements.
Conflicts of interest
There are no conflicts of interest to declare.Acknowledgements
A support by the Ministry of Education, Youth and Sports of the Czech Republic via the National Programme of Sustainability, NPS II (grant no. LQ1602), is greatly acknowledged. The calculations have been performed using the IT4Innovations infrastructure supported from the Large Infrastructures for Research, Experimental Development and Innovations grant (LM2015070) and made available to us through computational grants OPEN-10-47 and OPEN-14-20. Partial financial support from VSB–Technical University of Ostrava (grants no. SP2019/162 and SP2019/84) is also acknowledged.Notes and references
- R. S. Berry, Theory of Atomic and Molecular Clusters, Springer, 1999, pp. 1–26 Search PubMed.
- R. S. Berry, Handbook of Nanophysics. Principles and Methods, CRC Press, 2017, pp. 20.1–20.15 Search PubMed.
- A. Vítek, A. Ofiala and R. Kalus, Phys. Chem. Chem. Phys., 2012, 14, 15509 RSC.
- A. Vítek, D. J. Arismendi-Arrieta, R. Rodríguez-Cantano, R. Prosmiti, P. Villarreal, R. Kalus and G. Delgado-Barrio, Phys. Chem. Chem. Phys., 2015, 17, 8792 RSC.
- F. A. Lindemann, Z. Phys., 1910, 11, 609 CAS.
- H. Haberland, Atomic Clusters and Nanoparticles, Springer, 2000, pp. 29–56 Search PubMed.
- C. Bréchignac, M. Broyer, P. Cahuzac, G. Delacretaz, G. Labastie and L. Wöste, Chem. Phys. Lett., 1985, 120, 559 CrossRef.
- C. Bréchignac, M. Broyer, P. Cahuzac, G. Delacretaz, G. Labastie, J. P. Wolf and L. Wöste, Phys. Rev. Lett., 1988, 60, 275 CrossRef PubMed.
- K. Rademann, M. S. O. Dimopoulou-Rademann, U. Even and F. Hensel, Phys. Rev. Lett., 1992, 69, 3208 CrossRef CAS PubMed.
- H. Kitamura, Chem. Phys., 2006, 325, 207 CrossRef CAS.
- H. Kitamura, Chem. Phys. Lett., 2006, 425, 205 CrossRef CAS.
- H. Haberland, B. von Issendorff, J. Yufeng and T. Kolar, Phys. Rev. Lett., 1992, 69, 3212 CrossRef CAS PubMed.
- H. Haberland, B. von Issendorff, J. Yufeng, T. Kolar and G. Thanner, Z. Phys. D: At., Mol. Clusters, 1993, 26, 8 CrossRef CAS.
- S. Grabowski, M. E. Garcia and K. H. Bennemann, Phys. Rev. Lett., 1994, 72, 3969 CrossRef CAS.
- B. Kaiser and K. Rademann, Phys. Rev. Lett., 1992, 69, 3204 CrossRef CAS PubMed.
- J. Blanc, M. Broyer, P. Dugourd, P. Labastie, M. Sence, J. P. Wolf and l. Wö, J. Chem. Phys., 1995, 102, 680 CrossRef CAS.
- H. Uchtmann, R. Dettmer, S. D. Baranovskii and F. Hensel, J. Chem. Phys., 1998, 108, 9775 CrossRef CAS.
- M. E. Garcia, D. Reichardt and K. H. Bennemann, J. Chem. Phys., 1998, 109, 1101 CrossRef CAS.
- M. E. Garcia, H. O. Jeschke, I. Grigorenko and K. H. Bennemann, Appl. Phys. B, 2000, 71, 361 CrossRef CAS.
- N. Gaston, P. Schwerdtfeger and B. von Issendorff, Phys. Rev. A, 2006, 74, 043203 CrossRef.
- Note that only an incomplete selection of the published studies can be given here due to limited space and interested readers are referred to the cited references for a more complete view.
- R. Ćosić, A. Vítek and R. Kalus, Phys. Chem. Chem. Phys., 2018, 20, 28871 RSC.
- The metastable isomer of the Hg6 cluster has as well smaller volume than the stable one (by about ΔVe ≈ 2 Å3), but its energy is too high (ΔDe ≈ 45 meV) for it to become important unless very high pressures are involved. For the remaining cluster sizes, Hg7 and Hg10, all the metastable isomers have larger volumes than corresponding stable ones and no pressure-induced phase changes are thus expected in these clusters.
- A. Bastida and F. X. Gadea, Chem. Phys., 1996, 209, 291 CrossRef CAS.
- T. Ikegami and S. Iwata, J. Chem. Phys., 1996, 105, 10734 CrossRef CAS.
- F. O. Ellison, J. Am. Chem. Soc., 1963, 85, 3540 CrossRef CAS.
- P. J. Kuntz and J. Valldorf, Z. Phys. D: At., Mol. Clusters, 1988, 8, 195 CrossRef CAS.
- M. Amarouche, G. Durand and J. P. Malrieu, J. Chem. Phys., 1988, 88, 1010 CrossRef CAS.
- P. Milko, R. Kalus, I. Paidarová, J. Hrušák and F. X. Gadéa, Theor. Chem. Acc., 2009, 124, 169 Search PubMed.
- E. Czuchaj, F. Rebentrost, H. Stoll and H. Preuss, Chem. Phys., 1997, 214, 277 CrossRef CAS.
- E. Pahl, D. Figgen, C. Thierfelder, K. A. Petterson, F. Calvo and P. Schwerdtfeger, J. Chem. Phys., 2010, 132, 114301 CrossRef PubMed.
- The ground-state potential of ref. 31 has been represented by an analytic formula reported therein for the CCSDT data and the discrete points calculated for electronically excited states of Hg2 in ref. 30 have been interpolated via cubic splines.
- J. S. Cohen and B. I. Schneider, J. Chem. Phys., 1974, 61, 3230 CrossRef CAS.
- P. J. Hay, J. T. H. Dunning and R. C. Raffenetti, J. Chem. Phys., 1976, 65, 2679 CrossRef CAS.
- N. Metropolis, A. W. Rosenbluth, M. N. Rosenbluth, A. H. Teller and E. Teller, J. Chem. Phys., 1953, 21, 1087 CrossRef CAS.
- The following procedure has been employed in our calculations to generate isotropic atomic displacements. First, a random vector,
 , has been proposed with components selected uniformly from interval [−dmax, dmax], dmax being the current maximum size of the atomic displacement. Then, if the vector belongs to a sphere of radius dmax, Δr ≤ dmax, the coordinates of the particular atom have been changed by adding it, otherwise a new attempt to generate
  has been performed.
 - A. Bondi, J. Phys. Chem., 1964, 68, 441 CrossRef CAS.
- The volume of the cluster depends on a particular estimate of the atomic van der Waals radius since, for a convex hull of non-overlaping spheres of radius r, the following formula holds (see, e.g., ref. 58): V(r) = V0 + A0r + M0r2 + 4/3πr3 with V0, A0, and M0 being respectively the cluster volume, surface, and integral mean curvature calculated for r = 0. As a consequence, if a value of the Hg van der Waals radius different from that used in the present calculation is considered, the estimates of the pressures at which structural changes take place in Hg8 will change. This change adopts a form of a simple multiplicative scaling and it follows from our calculations that this scaling is almost identical for all the isomers found for Hg8, P(r) ≈ P(r = 1.55)/(0.07234 + 0.44038r + 0.04795r2 + 0.03493r3), where r is to be provided in Å. As a consequence, this simple scaling rule may be used to easily recalculate transition pressures provided in this work to those corresponding to different estimates of r.
- C. B. Barber, D. P. Dobkin and H. Huhdanpaa, ACM Trans. Math Software, 1996, 22, 469 CrossRef.
- The maximum displacement has been adjusted each 20th sweep (all-atoms move) by multiplying or dividing its current value by 1.05, a factor only slightly different from 1. Further, it is important to emphasize that a systematic drift of the maximum displacement value has only occurred during the equilibration phase of performed calculations, during which sampled configurations have been discarded. After equilibrium has been achieved, only small-magnitude oscillations around the desired value (0.5) have been observed. The detailed balance conditions have thus been only marginally disturbed by these adjustments.
- R. H. Swendsen and J. S. Wang, Phys. Rev. Lett., 1986, 57, 2607 CrossRef.
- C. J. Geyer, Computing Science and Statistics Proceedings of the 23rd Symposium on the Interface, New York, 1991, p. 156 Search PubMed.
- C. J. Geyer and E. A. Thompson, J. Am. Stat. Assoc., 1995, 90, 909 CrossRef.
- T. Okabe, M. Kawata, Y. Okamoto and M. Mikami, Chem. Phys. Lett., 2001, 335, 435 CrossRef CAS.
- The upper temperature used in the present parallel tempering calculations has been chosen so that it is well above the lowest estimate of the Hg8 evaporation temperature (T(min)evap ≈ 110 K) and, consequently, should be sufficiently high for overcoming the barriers which may be present on the Hg8 potential energy surface. The lowest estimate of the evaporation temperature has been calculated form the assumption of the equipartition of the thermal energy in the Hg8 cluster and from the energy difference (ΔDe) between equilibrium structures of Hg8 and Hg7, (3 × 8 − 6)kBT(min)evap = ΔDe ≈ 0.17 eV (in the present work, the classical binding energy of Hg7 is estimated to De = 1.119 eV)..
- N. L. Doltsinis and P. J. Knowles, Chem. Phys. Lett., 1999, 301, 241 CrossRef CAS.
- F. Calvo, E. Pahl, P. Schwerdtfeger and F. Spiegelman, J. Theor. Comput. Chem., 2012, 8, 639 CrossRef CAS PubMed.
- B. Hartke, H.-J. Flad and M. Dolg, Phys. Chem. Chem. Phys., 2001, 3, 5121 RSC.
- H. Kitamura, Eur. Phys. J. D, 2007, 43, 33 CrossRef CAS.
- N. Gaston and P. Schwerdtfeger, Phys. Rev. B: Condens. Matter Mater. Phys., 2006, 74, 024105 CrossRef.
- J. Kang, J. Kim, H. Ihee and Y. S. Lee, J. Phys. Chem. A, 2010, 114, 5630 CrossRef CAS PubMed.
- A. S. Chaves, M. J. Piotrowski and J. L. F. D. Silva, Phys. Chem. Chem. Phys., 2017, 19, 15484 RSC.
- G. E. Moyano, R. Wesendrup, T. Söhner and P. Schwerdtfeger, Phys. Rev. Lett., 2002, 89, 103410 CrossRef PubMed.
- Y. Wang, H.-J. Flad and M. Dolg, Phys. Rev. B: Condens. Matter Mater. Phys., 2000, 61, 2362 CrossRef CAS.
- R. Hatz, V. Hänninen and L. Halonen, J. Phys. Chem. A, 2014, 118, 5734 CrossRef CAS PubMed.
- F. Karlický and M. Novotný, University of Ostrava, unpublished results.
- D. M. Ceperley, Rev. Mod. Phys., 1995, 67, 279 CrossRef CAS.
- L. Maibaum, M. Schmidt and H. Löwen, Phys. Rev. E: Stat., Nonlinear, Soft Matter Phys., 2001, 63, 051401 CrossRef CAS PubMed.
Footnote |
| † Present address: Faculty of Mathematics and Physics, Charles University, Ke Karlovu 2027/3, 121 16 Praha 2, Czech Republic. |
| This journal is © The Royal Society of Chemistry 2019 |