 Open Access Article
K0.36(H2O)yWS2: a new layered compound for reversible hydrated potassium ion intercalation in aqueous electrolyte†
Yuanlv
Mao‡
ab,
Miao
Xie‡
ab,
Wei
Zhao
*a,
Kaidi
Yuan
c,
Yuqiang
Fang
ab and
Fuqiang
Huang
 *ad
*ad
aState Key Laboratory of High Performance Ceramics and Superfine Microstructure, Shanghai Institute of Ceramics, Chinese Academy of Sciences, Shanghai 200050, P. R. China. E-mail: zhaowei220@mail.sic.ac.cn; huangfq@mail.sic.ac.cn
bUniversity of Chinese Academy of Sciences, Beijing 100049, China
cShanghaiTech University, Shanghai 201210, China
dState Key Laboratory of Rare Earth Materials Chemistry and Applications, College of Chemistry and Molecular Engineering, Peking University, Beijing 100871, P. R. China
First published on 10th October 2019
Abstract
This work reports the synthesis of a new quasi two-dimensional layered compound, K0.36(H2O)yWS2, for aqueous potassium ion storage. Its crystal structure determined by single crystal X-ray diffraction is composed of WS2 layers and disordered hydrated K+ stacking along the c direction alternately. Due to the large interlayer spacing and high conductivity, K0.36(H2O)yWS2 is demonstrated to be a stable host for reversible intercalation and de-intercalation of hydrated K+ in K2SO4 aqueous solution.
Aqueous alkali-ion rechargeable batteries attract extensive interest towards large-scale energy storage applications, especially for smart grids.1–5 Compared with the present commercialized lithium-ion batteries containing organic electrolytes,6 aqueous rechargeable batteries are more appealing in terms of safety and cost.4 Among them, the aqueous potassium ion (K+) battery (KIB) possesses several advantages. The natural abundance of potassium is much higher than lithium, indicating a lower cost.7 The standard redox potential of potassium (−2.93 V vs. SHE) is 0.21 V lower than that of sodium (−2.72 V vs. SHE), suggesting a higher energy density.8 Moreover, the Stokes radius (total radius of ion and bound water molecules) of hydrated K+ is smaller than that of hydrated Li+ or Na+, which can facilitate K+ transport in aqueous electrolytes.9
However, because the stable electrochemical window of conventional aqueous system (1.23 V) is much narrower than non-aqueous systems, the selection of electrode materials for aqueous batteries is challenging. Only materials with operating potential located between the H2 and O2 evolution potential are appropriate and they should be chemically stable in H2O during the charge/discharge process. Compared with the large amounts of reported electrode materials for aqueous lithium and sodium ion batteries,4,5,10–12 suitable candidates for aqueous KIBs are rare. In recent years, Prussian blue analogues are widely studied as cathode materials for aqueous KIBs.13–16 These compounds adopting open-framework structures display decent performance due to their large interstitial sites and 3D channels that can allow fast insertion/extraction of metal ions. However, the studies on anode materials for aqueous KIBs are still in an early stage. Most of the reported candidates can only be operated in concentrated electrolyte. For example, NASICON-type KTi2(PO4)3 (KTP) compound delivers a specific capacity of 53 mA h g−1 in 30 M KAc aqueous electrolyte by reversibly intercalating K+ into the interstitial positions of the NASICON matrix but it delivers pronounced cathodic current caused by hydrogen evolution reaction in 1 M and 10 M KAc electrolyte.17 The perylenetetracarboxylic diimide (PTCDI) can store K+ in 22 M KCF3SO3 aqueous electrolyte by the reversible enolation of carbonyl groups in the structure while it would dissolve seriously during cycling in 1 M KCF3SO3 electrolyte.18 The scarcity of electrochemically active anode materials in mild electrolyte has been one of the biggest obstacles for the further development of aqueous KIBs.
In this communication, a new compound with typical layered structure, K0.36(H2O)yWS2, has been synthesized successfully for aqueous K+ storage. The crystal structure of the compound has been determined by single crystal X-ray diffraction. The structure of K0.36(H2O)yWS2 is composed of WS2 layers connected by edge-sharing distorted [WS6] octahedra and interlayer hydrated K+. The electrochemical performance of K0.36(H2O)yWS2 in neutral 0.5 M K2SO4 solution was studied. Benefiting from the large interlayer spacing (9.258 Å) and high conductivity (35.8 S m−1), this compound delivers an initial discharge capacity of 40.9 mA h g−1 as anode material of aqueous KIB. The reversible hydrated K+ intercalation/de-intercalation process in K0.36(H2O)yWS2 electrode is revealed by ex situ XRD, Raman spectra, XPS and TEM investigation.
High-quality K0.36(H2O)yWS2 crystal was successfully obtained via two steps: ternary KxWS2 crystal was synthesized by solid state reaction at 800 °C and then oxidized in water to form K0.36(H2O)yWS2 at room temperature (see experimental section in ESI†). The crystal structure of K0.36(H2O)yWS2 was determined by single crystal X-ray diffraction and its crystal data and structure refinement details are summarized in Tables S3–S6 (ESI†).
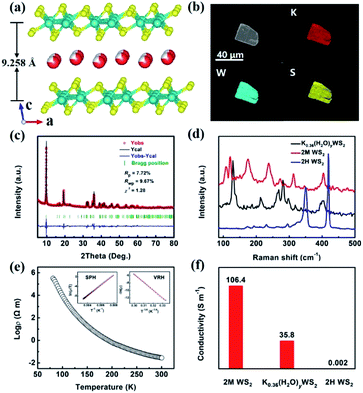
The K0.36(H2O)yWS2 compound that is isostructural to the reported Rb0.21(H2O)yWS2 (ref. 19) crystallizes in the monoclinic space group P21/m and the cell parameters are a = 5.693 (2) Å, b = 3.2498 (1) Å and c = 9.410 (3) Å. As shown in Fig. 1a, the crystal structure of K0.36(H2O)yWS2 is composed of WS2 layers stacking along the c direction and disordered hydrated K+ reside between them. Similar to Rb0.21(H2O)yWS2,19 the position of water molecules cannot be determined due to the diffuse electron density between the layers.
In the WS2 layer, the W atom coordinates to six S atoms to form a distorted [WS6] octahedron. The [WS6] octahedra connected via edge sharing lead to WS2 layer. Similar to 2M WS2,20 two adjacent W atoms are associated with each other, forming one-dimensional W zigzag chains along [010]. Because of intercalated K+ charge/radius ratio e/r < 1, the monolayer water molecules are formed,21 which expands the interlayer spacing to 9.258 Å compared with that of 2H WS2 (6.162 Å) and 2M WS2 (5.920 Å).20,22 The enlarged interlayer distance can reduce the ion diffusion resistance and contribute to faster reaction kinetics and lower energy barrier for K+ transport.23
The SEM image and elemental mapping of the K0.36(H2O)yWS2 single crystal are shown in Fig. 1b. Apparently, the title compound displays a platelet-like morphology. Elemental mapping results indicate the homogenous distribution of K, W, and S elements in a single platelet. The atomic ratio of K to W determined by ICP-OES is 0.36. As depicted in Fig. 1c, the experimental PXRD pattern matches well the simulated one (convergence factors: Rp = 7.72%, Rwp = 9.67% and χ2 = 1.28), suggesting the high purity of the sample. The PXRD measurement of the sample annealed at 100 °C under Ar atmosphere and then sealed with vacuum tape was also conducted. The diffraction peak of (001) plane shifts remarkably from 9.55° to 11.64°, implying a reduced interlayer spacing due to the loss of water (Fig. S1a, ESI†). In addition, TG-DSC data confirms that the title compound will lose interlayer water molecules around 100 °C. Because of the interference of possible surface-adsorbed water, the estimated water content in K0.36(H2O)yWS2 is determined to be 0.4 (Fig. S1b, ESI†). Raman spectra of K0.36(H2O)yWS2, 2H WS2 and 2M WS2 in the range of 85–500 cm−1 are shown in Fig. 1d. Different from the two other compounds, K0.36(H2O)yWS2 is characteristics of six distinct peaks at 129, 213, 265, 281, 298 and 401 cm−1, respectively. K0.36(H2O)yWS2 is a typical semiconductor unveiled by the temperature–resistivity curve and its resistivity can be fitted with small polaron hopping model (SPH) and variable range hopping model (VRH) (Fig. 1e).24,25 As shown in Fig. 1f, compared with 2H WS2 (0.002 S m−1), the superior conductivity of K0.36(H2O)yWS2 (35.8 S m−1) and 2M WS2 (106.4 S m−1) is beneficial to the charge transfer during intercalation/de-intercalation reactions.
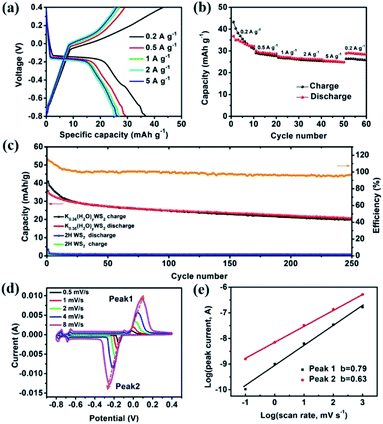
The electrochemical performance of K0.36(H2O)yWS2 is evaluated using three-electrode system at different current densities from 0.2 to 5 A g−1 (see experimental section in ESI†). As depicted in Fig. 2a, obvious plateaus are observed in the charge/discharge curves of K0.36(H2O)yWS2 electrode (∼0.05 V vs. Ag/AgCl in the charge curve and ∼−0.15 V vs. Ag/AgCl in the discharge curve). Specific discharge capacities are 43.3, 30.1, 27.5, 26.5 and 25.7 mA h g−1 at 0.2, 0.5, 1, 2 and 5 A g−1, respectively. The rate performance of K0.36(H2O)yWS2 is obviously better than that of KTP (∼18 mA h g−1 at 5 A g−1).17 The discharge capacity is slightly larger than the charge capacity at 0.2 A g−1, which may be caused by side reactions such as hydrogen evolution reaction occurring at a very negative potential (−0.8 V vs. AgCl/Ag) (Fig. 2b).26 When the current density is reduced back to 0.2 A g−1, a discharge capacity of 28.9 mA h g−1 could be recovered with a recovery ratio of 66.7%. The comparison of the cycle performance between the compound and 2H WS2 at 0.5 A g−1 is shown in Fig. 2c. 2H WS2 is not electroactive with negligible capacity delivered. In contrast, the initial discharge capacity of K0.36(H2O)yWS2 can reach 40.9 mA h g−1 and 20 mA h g−1 is maintained after 250 cycles. Even after 1000 cycles at 2 A g−1, K0.36(H2O)yWS2 electrode still can maintain 40% initial discharge capacity (Fig. S3, ESI†). The capacity decay may be caused by the appearance of electrochemically inactive 2H WS2 after cycling (Fig. S4, ESI†). During the first 15 cycles, the coulombic efficiency is higher than 100%. It may also result from the phase transformation from 2M WS2 into 2H WS2. 2H WS2 after phase change almost cannot be inserted hydrated K+ during the discharge process, leading to that charge capacity is higher than discharge capacity. The coulombic efficiency of the working electrode keeps greater than 96% after 15 cycles. Apparently, the improved capacity can be ascribed to huge interlayer spacing for facile ion intercalation/de-intercalation and high conductivity of K0.36(H2O)yWS2 for electron transport.
Cyclic voltammetry (CV) measurements at different scan rates were carried out to investigate the kinetics of K+ insertion/extraction (Fig. 2d). In the CV curve at a scan rate of 0.5 mV s−1, there are three pairs of evident oxidation/reduction peaks at −0.151/−0.017, −0.666/−0.661 and −0.761/−0.754 V in the electrochemical window of −0.8–0.4 V, consistent with the charge/discharge curves. The capacity mainly comes from the redox reaction located at −0.151/−0.017 V, which should be ascribed to the insertion/extraction of hydrate K+ (see the discussion below). The other two pairs of oxidation/reduction peaks at −0.666/−0.661 and −0.761/−0.754 V may be caused by the insertion/extraction of hydrated K+ at different sites between the WS2 layers.
When increasing scan rates, the oxidation and reduction peaks of the sample move towards lower and higher potentials, respectively. Generally, the power law relationship between peak current i and sweep rate v can be assumed by the following equation:27
| i = avb |
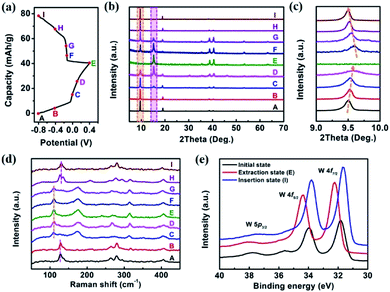
To unravel the energy storage mechanism of K0.36(H2O)yWS2 electrode, the ex situ XRD, Raman spectra and XPS measurements were performed. Fig. 3b shows the XRD patterns of K0.36(H2O)yWS2 electrode at different charge/discharge stages of the second cycle (marked points in Fig. 3a). During the charging process (from state A to E), a gradual shift of the (001) peak of K0.36(H2O)yWS2 towards higher angles is observed (Fig. 3c), which indicates the decrease of the interlayer spacing. Meanwhile, a new peak at about 14.9° emerges gradually and is ascribed to the (200) peak of 2M WS2.20 K0.36(H2O)yWS2 transforms into 2M WS2 at state E. The variation of the interlayer distance (∼3.3 Å) is close to the van der Waals diameter of hydrated K+ (∼3 Å),28 indicating the complete extraction of hydrated K+ rather than naked K+. During the discharging process (from state E to I), the diffractions of 2M WS2 disappear gradually and the peak belonging to K0.36(H2O)yWS2 at approximately 9.5° shows up with the hydrated K+ re-inserting into the layers of 2M WS2, revealing a highly reversible intercalation/de-intercalation process of K0.36(H2O)yWS2 electrode. Ex situ Raman spectra of K0.36(H2O)yWS2 electrode are shown in Fig. 3d. During the charging process (from state A to E), the characteristic peaks of K0.36(H2O)yWS2 fade down and disappear eventually. The new peaks located in 110, 175, 239, 268, 314 and 405 cm−1 can be indexed to 2M WS2, showing the extraction of hydrated K+.20 Among them, three prominent peaks located in 110, 268 and 405 cm−1 correspond to the J1, J2 and J3 mode resulted from the 2a × a superstructure in the 2M WS2, respectively.20,29 On the other hand, when the electrode is discharged to −0.8 V (state I), the characteristic peaks of 2M WS2 disappear completely and only that of K0.36(H2O)yWS2 can be detected, indicating the insertion of hydrated K+. According to the result of XPS measurement (Fig. 3e), the W 4f orbitals of K0.36(H2O)yWS2 in initial state (fresh electrode without any further treatment) show two main peaks at 34 eV (W 4f5/2) and 31.8 eV (W 4f7/2). When the electrode is charged to 0.4 V (extraction state; state E), the binding energy of two main peaks increase by 0.43 eV, corresponding to the extraction of hydrated K+. Meanwhile, the trivalent W in K0.36(H2O)yWS2 get electrons to convert to tetravalent W. When the electrode is discharged to −0.8 V, the binding energy decrease to 33.8 and 31.6 eV, respectively. The downshift of the binding energy indicates the intercalation of more hydrated K+ evidenced by EDS analysis (insertion state (state I): the content of K+ increases to 0.42; Table S2, ESI†) and the formation of more W3+ states. The shifts of XPS peaks exhibit the reversible hydrated K+ intercalation/de-intercalation mechanism of K0.36(H2O)yWS2 electrode during the charge/discharge process, consistent with the result of XRD and Raman analysis.
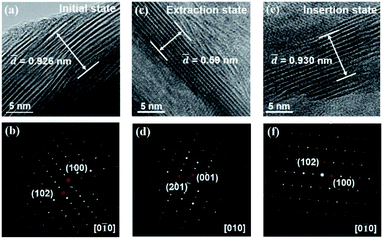
Moreover, ex situ TEM measurements were performed on the scratched samples of working electrodes at initial state, extraction state and insertion state. The HRTEM images and SAED patterns of K0.36(H2O)yWS2 at above three states are shown in Fig. 4a–f. From initial state to extraction state, the interlayer spacing of K0.36(H2O)yWS2 is reduced from 0.926 nm to 0.59 nm. At insertion state, the interlayer spacing goes back to 0.930 nm due to the insertion of more hydrated K+. The SAED patterns of K0.36(H2O)yWS2 electrodes at above three states display bright diffraction spots, exhibiting that high crystallinity of K0.36(H2O)yWS2 was kept during insertion/extraction process. At initial and insertion states, K0.36(H2O)yWS2 electrodes display typical  superstructure, which is caused by distorted [WS6] octahedra between the layers.30 Meanwhile, similar electron diffraction pattern was observed in the SAED pattern at extraction state, suggesting the stable WS2 layers during K+ insertion/extraction process. On the basis of the above analysis, the energy storage mechanism of K0.36(H2O)yWS2 was revealed to be reversible intercalation/de-intercalation of hydrated K+ in aqueous electrolyte. The intercalation/de-intercalation reaction can be described as follows:
| K0.36(H2O)yWS2 ↔ 0.36 [K(H2O)y]+ + WS2 + 0.36 e− |
 | ||
| Fig. 4 The HRTEM images and SAED patterns of K0.36(H2O)yWS2 at (a and b) initial, (c and d) extraction and (e and f) insertion state, respectively. | ||
In summary, K0.36(H2O)yWS2, a new quasi two-dimensional layered compound, was synthesized and its crystal structure was determined by single crystal X-ray diffraction. The as-prepared sample was evaluated as electrode material for aqueous KIB for the first time. Due to the large interlayer spacing, K0.36(H2O)yWS2 can realize reversible intercalation/de-intercalation of hydrated K+ in K2SO4 aqueous solution, revealed by the ex situ XRD, Raman, XPS and TEM analysis. A discharge capacity of 43.3 mA h g−1 at 0.2 A g−1 and 25.7 mA h g−1 at 5 A g−1 was obtained and then the discharge capacity (28.9 mA h g−1 at 0.2 A g−1) could be recovered after cycling at high current densities. Since few anode materials are reported, this work should be beneficial to identifying potential candidates in layered metal chalcogenides for aqueous rechargeable KIBs.
Conflicts of interest
There are no conflicts to declare.Acknowledgements
This work was financially supported by National Natural Science Foundation of China (Grant No. 21871008 and Grant 21801247), the Key Research Program of Chinese Academy of Sciences (Grant No. QYZDJ-SSW-JSC013 and KGZD-EW-T06), and CAS Centre for Excellence in Superconducting Electronics.Notes and references
- G. L. Soloveichik, Annu. Rev. Chem. Biomol. Eng., 2011, 2, 503–527 CrossRef CAS.
- Z. Yang, J. Zhang, M. C. W. Kintner-Meyer, X. Lu, D. Choi, J. P. Lemmon and J. Liu, Chem. Rev., 2011, 111, 3577–3613 CrossRef CAS.
- B. Dunn, H. Kamath and J. Tarason, Science, 2011, 334, 928–935 CrossRef CAS.
- H. Kim, J. Hong, K. Park, H. Kim, S. Kim and K. Kang, Chem. Rev., 2014, 114, 11788–11827 CrossRef CAS.
- J. Liu, C. Xu, Z. Chen, S. Ni and Z. Shen, Green Energy & Environment, 2018, 3, 20–41 Search PubMed.
- N. Nitta, F. Wu, J. T. Lee and G. Yushin, Mater. Today, 2015, 18, 252–264 CrossRef CAS.
- H. Kim, J. C. Kim, M. Bianchini, D. Seo, J. Rodriguez-Garcia and G. Ceder, Adv. Energy Mater., 2018, 8, 1702384 CrossRef.
- J. C. Pramudita, D. Sehrawat, D. Goonetilleke and N. Sharma, Adv. Energy Mater., 2017, 7, 1602911 CrossRef.
- Q. Zhang, H. Chen, T. Wu, T. Jin, Z. Pan, J. Zheng, Y. Gao and W. Zhuang, Chem. Sci., 2017, 8, 1429–1435 RSC.
- Y. You, Z. Sang and J. Liu, Mater. Technol., 2016, 31, 501–509 CrossRef CAS.
- Y. Wang, J. Yi and Y. Xia, Adv. Energy Mater., 2012, 2, 830–840 CrossRef CAS.
- W. Li, J. R. Dahn and D. S. Wainwright, Science, 1994, 264, 1115–1118 CrossRef CAS.
- D. Su, A. McDonagh, S. Qiao and G. Wang, Adv. Mater., 2017, 29, 1604007 CrossRef.
- C. D. Wessells, S. V. Peddada, R. A. Huggins and Y. Cui, Nano Lett., 2011, 11, 5421–5425 CrossRef CAS.
- W. Ren, X. Chen and C. Zhao, Adv. Energy Mater., 2018, 8, 1801413 CrossRef.
- C. D. Wessells, R. A. Huggins and Y. Cui, Nat. Commun., 2011, 2, 550 CrossRef PubMed.
- D. P. Leonard, Z. Wei, G. Chen, F. Du and X. Ji, ACS Energy Lett., 2018, 3, 373–374 CrossRef CAS.
- L. Jiang, Y. Lu, C. Zhao, L. Liu, J. Zhang, Q. Zhang, X. Shen, J. Zhao, X. Yu, H. Li, X. Huang, L. Chen and Y. Hu, Nat. Energy, 2019, 4, 495 CrossRef CAS.
- Y. Mao, Y. Fang, D. Wang, K. Bu, S. Wang, W. Zhao and F. Huang, Acta Crystallogr., Sect. E: Crystallogr. Commun., 2019, 75, 976–979 CrossRef CAS.
- Y. Fang, J. Pan, D. Zhang, D. Wang, H. T. Hirose, T. Terashima, S. Uji, Y. Yuan, W. Li, Z. Tian, J. Xue, Y. Ma, W. Zhao, Q. Xue, G. Mu, H. Zhang and F. Huang, Adv. Mater., 2019, 31, 1901942 CrossRef.
- R. Schöllhorn, M. Kümpers and D. Plorin, J. Less-Common Met., 1978, 58, 55–60 CrossRef.
- W. J. Schutte, J. L. De Boer and F. Jellink, J. Solid State Chem., 1987, 70, 207–209 CrossRef CAS.
- H. Li, Q. Yang, F. Mo, G. Liang, Z. Liu, Z. Tang, L. Ma, J. Liu, Z. Shi and C. Zhi, Energy Storage Materials, 2019, 19, 94–101 CrossRef.
- N. Mott and E. A. Davis, Electronic processes in non-crystalline materials, OUP, Oxford, 2012, pp. 202–207 Search PubMed.
- N. Mott, J. Non-Cryst. Solids, 1968, 1, 1–17 CrossRef CAS.
- X. Geng, Y. Zhang, Y. Han, J. Li, M. Benamara, L. Chen and H. Zhu, Nano Lett., 2017, 17, 1825–1832 CrossRef CAS.
- J. Wang, J. Polleux, J. Lim and B. Dunn, J. Phys. Chem. C, 2007, 111, 14925–14931 CrossRef CAS.
- A. S. Golub, G. A. Protzenko, I. M. Yanovskaya, O. L. Lependina and Y. n. Novikov, Mendeleev Commun., 1993, 3, 199–200 CrossRef.
- S. Sandoval, D. Yang, R. Frindt and J. Irwin, Phys. Rev. B, 1991, 44, 3955 CrossRef.
- D. H. Keum, S. Cho, J. H. Kim, D. Choe, H. Sung, M. Kan, H. Kang, J. Hwang, S. W. Kim, H. Yang, K. J. Chang and Y. H. Lee, Nat. Phys., 2015, 11, 482–486 Search PubMed.
Footnotes |
| † Electronic supplementary information (ESI) available. CCDC 1946876. For ESI and crystallographic data in CIF or other electronic format see DOI: 10.1039/c9ra07718a |
| ‡ These authors contributed equally. |
| This journal is © The Royal Society of Chemistry 2019 |


