 Open Access Article
Structure–property relationship of polycarbonate/polypropylene alloys prepared via eccentric rotor extruder
Xingxing Yu ab,
Jingwei Hea,
Yao Liub,
Long Sub and
Fang Liu*a
aSchool of Materials Science and Engineering, South China University of Technology, Guangzhou, Guangdong 510640, China. E-mail: mcfliu@scut.edu.cn
bKingfa Sci. & Tech. Co., Ltd, Guangzhou, Guangdong 510663, China. E-mail: yuxingxing@kingfa.com.cn
First published on 12th December 2019
Abstract
In this work, PC/PP alloys were respectively prepared by eccentric rotor extruder (ERE) and twin screw extruder (TSE). By analyzing the mechanical properties, morphology, rheological behavior and thermal properties of PC/PP alloys, the effects of processing methods on the two-phase structure and properties of PC/PP alloys were studied. The results showed that the size of the dispersed phase of PC/PP alloys was smaller and its distribution was more uniform under the elongational flow field provided by ERE. Compared to the typical sea-island phase structure provided by the shear flow field, the morphology of the alloys showed a “sea-island-fiber” phase structure under the elongational flow field. Compared to the TSE, the notched lzod impact strength of the PC/PP alloy prepared by ERE increased by 31.0%. ERE played a stronger effect on the dispersion and distribution of PC/PP alloys, which was also confirmed in the results of dynamic rheology analysis and differential scanning calorimetry. The blending method dominated by the elongational flow field could prepare PC/PP alloys with better properties.
1. Introduction
Polycarbonate (PC) has several advantages, such as good mechanical properties, thermal stability, weatherability and creep resistance, but it also suffers from high density (1.18–1.22 g cm−3), easy stress cracking, bad solvent resistance and high processing temperature. In order to improve its properties and reduce costs, other polymers are always blended with PC to prepare PC alloys, such as PC/acrylonitrile butadiene styrene alloy and PC/polyester alloy. However, these alloys still have high density, so they cannot meet the application needs in light weighted large parts.1 Polypropylene (PP) is one kind of widely used polymeric materials that possesses outstanding properties, such as low density (0.90 g cm−3), easy processing and low cost. It is of great value to prepare a PC/PP alloy with easy processing and low density.However, the solubility parameters of PC and PP are 9.5–10.6 (J cm−3)1/2 and 7.0–8.0 (J cm−3)1/2, respectively. Thus, they are thermodynamically incompatible materials. The differences in the processing temperature and shrinkage of these two polymers lead to the obvious incompatibility between PC and PP in the blending process, so it is difficult to prepare a PC/PP alloy with excellent properties by conventional blending methods.
In order to improve the compatibility of PC with PP, a third phase, such as compatibilizers, fillers or other polymers, was always added. Yang et al.2 and Li et al.3 improved the interface of PC/PP alloy by adding a self-made compatibilizer. The results showed that the tensile strength and the apparent viscosity of the alloy increased significantly and the sensitivity of the shear stress decreased with an increasing compatibilizer content. Li et al., Jang et al., and Alireza et al. improved the mechanical properties of the PC/PP alloy by adding different proportions of a self-made compatibilizer, meanwhile, the cost of the alloy was reduced by adding nano calcium carbonate4,5 or styrene–ethylene–butylene–styrene block copolymer.6
In addition to formula studies on the PC/PP alloy, recently, extensive studies concerning different blending processing methods were also applied to the PC/PP alloy. Favis et al. found that the micro morphology of the PC/PP alloy was closely related to its mass ratio, viscosity ratio and processing shear rate of PC and PP. The distribution of the dispersed phase in the PC/PP alloy became wider when the mass ratio between PC and PP got close to each other. Moreover, the tensile structure was easier to form in the process with the condition of high shear and high viscoelastic ratio between the two phases.7–9 Li et al. studied the crystallization behavior and morphology of PP/PC alloys and found that both PP and PP/PC (80/20) alloys had maximum crystallization rates.10 Kim et al.11 studied the influence of the molecular weight of PC on the blending process in a high shear rate equipment, and obtained the most suitable PC molecular weight and processing conditions under high shear rate equipments.
Guo et al.12 found that the rigidity of PC/PP alloy increased with the increase in the PC mass fraction, and the smaller dispersed phase size as well as the better mechanical properties of PC/PP alloy could be obtained by using intermeshing co-rotating twin screw extruder instead of a single screw.
Wang et al. designed a vibration blending rheometer and investigated the effect of vibration blending on the morphology of the PC/PP alloy.13 All of the above studies were focused on the classical blending processing equipment dominated by a shear flow field. According to the polymer rheology, the uniaxial extensional viscosity of the polymer is three times higher than the shear viscosity, and the dispersion efficiency under elongation flow field is better than the under shear flow field.14,15
Qu et al.16–19 invented a new type of eccentric rotor extruder (ERE) based on the volume elongation flow field. They used ERE to study UHMWPE,20,21 PP/MWCNT composites,22 PLLA/OMMT nanocomposites,23 PLA/TiO2 composite24 and the phase morphology and rheological properties of the PP/PS alloy with fillers of different dimensions.25 The above studies showed that the elongation flow shield played a special role in the polymer blending process. However, the study of the PC/PP alloy is still blank under the elongation flow shield.
In this work, we prepared PC/PP alloys with different formulations by using ERE and TSE. The effects of the shear flow field and elongation flow field on the morphology and physical properties of PC/PP alloys were investigated by analysing the morphology, mechanical properties, dynamic rheological properties and thermal properties of PC/PP alloys. The purpose of this study is to provide better processing methods for incompatible polymers and polymers with large processing temperature differences.
2. Experimental
2.1 Materials
Polypropylene (K8003) was purchased from Sinopec (Maoming, China) with a melt flow index (MFI) of 2.62 g/10 min (230 °C). Polycarbonate (PC 1300–10) was purchased from LG Chem with MFI 10 g/10 min (300 °C). Elvaloy AC resin 1125 (ethylene methyl acrylate copolymer) was purchased from DuPont China with MFI 0.5 g/10 min (190 °C).2.2 Processing devices
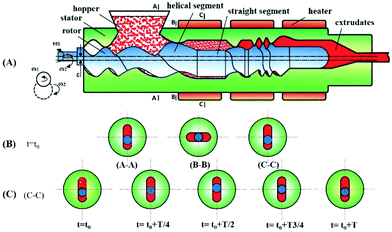
The schematic diagram of the Siiico ERE-30 (GDXL Precise Machinery CO., LTD, China) is shown in Fig. 1. The core of ERE consists of a stator, an eccentric rotor disposed in the inner cavity of the stator and a die. The stator and rotor have a special topological geometry, which is composed of alternating straight segments and helical segments. The rotor is eccentric in the inner cavity of the stator, and its stroke in 1 cycle is 4 times of the eccentricity ε. During material processing, the rotor rotates around its own axis at the speed of ω1 and revolves in the cavity of the stator at the speed of ω2, but in the opposite direction. The material undergoes axial and radial periodic changes in the material cavity formed by the rotor and stator. Based on the volume elongation rheology theory, the material undergoes periodic volume deformation during the process to obtain energy, thereby completing the plasticizing, mixing and conveying processes dominated by the elongational flow.26 The dispersion efficiency under the elongation flow field is better than that under the shear flow field, so more elongational flow fields are expected in the polymer blending process. However, in a continuous polymer blending equipment, the elongational flow field is more difficult to achieve than the shear flow field and may more easily cause extrusion flow fluctuations. In this study, by adjusting the lead of the spiral segment, the length of the straight segment and alternating the combination of the two, a certain compression ratio could be obtained, and the material was compressed while being conveyed so that the flow rate at the end of the device was more stable. The twin screw extruder ZE30 UTX was supplied by KraussMaffei Berstorff with a screw diameter of 30 mm and a length/diameter ratio of 40![[thin space (1/6-em)]](https://www.rsc.org/images/entities/char_2009.gif) :
:![[thin space (1/6-em)]](https://www.rsc.org/images/entities/char_2009.gif) 1.
1.
2.3 Preparation of PC/PP alloys
PC was firstly dried at 100 °C in an oven for 6 hours, and PP was dried at 80 °C in an oven for 4 hours. PC and PP were then added into a high speed mixer (SHR-100A) for mixing for 2 minutes according to formulations shown in Table 1.| Samples | PC (wt%) | PP (wt%) | AC 1125 (wt%) |
|---|---|---|---|
95![[thin space (1/6-em)]](https://www.rsc.org/images/entities/char_2009.gif) : :![[thin space (1/6-em)]](https://www.rsc.org/images/entities/char_2009.gif) 0 0 |
95 | 0 | 5 |
80![[thin space (1/6-em)]](https://www.rsc.org/images/entities/char_2009.gif) : :![[thin space (1/6-em)]](https://www.rsc.org/images/entities/char_2009.gif) 15 15 |
80 | 15 | 5 |
65![[thin space (1/6-em)]](https://www.rsc.org/images/entities/char_2009.gif) : :![[thin space (1/6-em)]](https://www.rsc.org/images/entities/char_2009.gif) 30 30 |
65 | 30 | 5 |
50![[thin space (1/6-em)]](https://www.rsc.org/images/entities/char_2009.gif) : :![[thin space (1/6-em)]](https://www.rsc.org/images/entities/char_2009.gif) 45 45 |
50 | 45 | 5 |
35![[thin space (1/6-em)]](https://www.rsc.org/images/entities/char_2009.gif) : :![[thin space (1/6-em)]](https://www.rsc.org/images/entities/char_2009.gif) 60 60 |
35 | 60 | 5 |
0![[thin space (1/6-em)]](https://www.rsc.org/images/entities/char_2009.gif) : :![[thin space (1/6-em)]](https://www.rsc.org/images/entities/char_2009.gif) 95 95 |
0 | 95 | 5 |
The mixed PC and PP were respectively added into TSE and ERE to prepare PC/PP alloy pellets. Both processing methods were used at the same barrel temperature, which ranged from 230 °C to 250 °C. The screw speed of TSE was 300 rpm and the rotor speed of the ERE was 120 rpm. The prepared PC/PP alloy pellets were firstly dried at 100 °C in an oven for 6 hours, and then used to prepared standard mechanical samples by an injection moulding machine (160–750 CX, KraussMaffei).
2.4 Characterization of the PC/PP alloy
3. Results and discussion
3.1 Effect of ERE on the morphology of PC/PP alloys
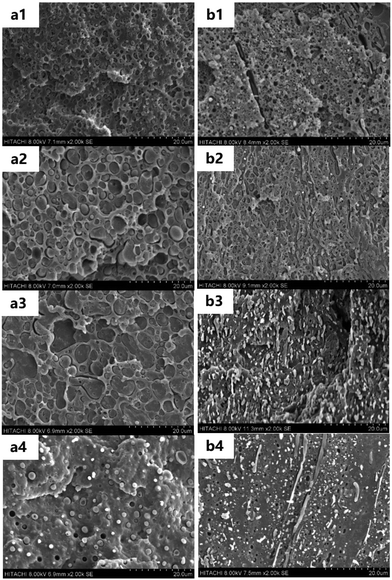
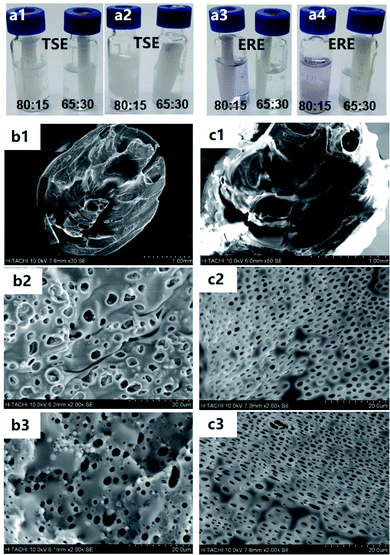
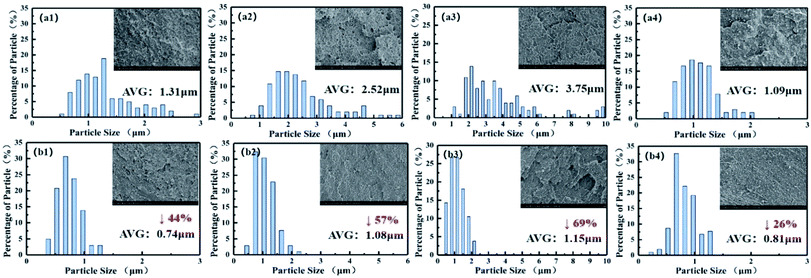
Fig. 2 showed the morphology of the extruded strips of the PC/PP alloys prepared by ERE and TSE. PC is soluble in DCM, while PP is insoluble in DCM, so the extruded strips of the PC/PP alloys prepared by ERE and TSE were immersed in DCM for 60 minutes to confirm the phase composition. Fig. 3 showed the morphology of the extruded strips of PC/PP alloys prepared by ERE and TSE immersed in DCM for 60 minutes. As shown in Fig. 2(a1–a4), the shape of the dispersed phase in PC/PP alloys prepared by TSE were mainly ellipsoid and globular and the size of dispersed phase increased with increase in the PP content, and the structure of PC/PP alloys was typical sea-island structure. Meanwhile, as shown in Fig. 3(a1–a4), the mass ratio of the 80![[thin space (1/6-em)]](https://www.rsc.org/images/entities/char_2009.gif) :
:![[thin space (1/6-em)]](https://www.rsc.org/images/entities/char_2009.gif) 15 and 65
15 and 65![[thin space (1/6-em)]](https://www.rsc.org/images/entities/char_2009.gif) :
:![[thin space (1/6-em)]](https://www.rsc.org/images/entities/char_2009.gif) 30 PC/PP alloy samples showed structural collapse. It was due to fact that the continuous phase of 80
30 PC/PP alloy samples showed structural collapse. It was due to fact that the continuous phase of 80![[thin space (1/6-em)]](https://www.rsc.org/images/entities/char_2009.gif) :
:![[thin space (1/6-em)]](https://www.rsc.org/images/entities/char_2009.gif) 15 and 65
15 and 65![[thin space (1/6-em)]](https://www.rsc.org/images/entities/char_2009.gif) :
:![[thin space (1/6-em)]](https://www.rsc.org/images/entities/char_2009.gif) 30 PC/PP alloys was PC, which was completely dissolved in DCM.
30 PC/PP alloys was PC, which was completely dissolved in DCM.
When the PP content was close to the PC content, PC transformed from a continuous phase into a dispersed phase gradually.27 As shown in Fig. 2(b1–b4), with the approximation of the two phase composition in PC/PP alloys, strip-like and stretched dispersed phases appeared obviously in the phase structure of PC/PP alloys prepared by ERE. Meanwhile, as shown in Fig. 2(a1–a4) and 3(b2, b3, c2 and c3), the dispersed phase size of PC/PP alloys prepared by ERE was smaller than that of the PC/PP alloys prepared by TSE. This was because the size of the dispersed phase decreased, the interface increased and the fusion probability of the dispersed phase increased with the approximation of the proportion, and the elongational flow field could achieve continuous dispersion in a smaller phase size.
Fig. 3(b1, b2, c1 and c2) showed the SEM micrographs of the PC/PP alloys with the mass ratio of 50![[thin space (1/6-em)]](https://www.rsc.org/images/entities/char_2009.gif) :
:![[thin space (1/6-em)]](https://www.rsc.org/images/entities/char_2009.gif) 45 prepared by TSE and ERE after etching by DCM for 60 minutes. As shown in Fig. 3(b1, b2, c1 and c2), a large amount of PC in PC/PP alloys was etched away, and the remaining PP phase contained the PC dispersed phase.
45 prepared by TSE and ERE after etching by DCM for 60 minutes. As shown in Fig. 3(b1, b2, c1 and c2), a large amount of PC in PC/PP alloys was etched away, and the remaining PP phase contained the PC dispersed phase.
Being a classical blending process equipment, TSE could provide a procedure dominated by the shear flow field. Compared to the TSE, ERE could provide a procedure dominated by the elongational flow field. The difference in the processing force field also lead to the difference in the two-phase structure of PC/PP alloys.
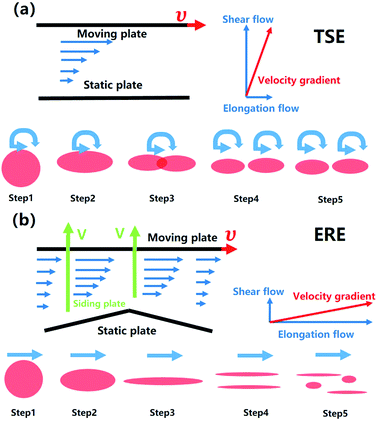
Fig. 4 depicted the mechanism of the 2-plate model in the shear flow field and the 3-plate model in the elongational flow field. Fig. 4(a) was the model for the TSE dominated by the shear flow field. Under the drag effect of the moving plate, the velocity gradient direction of the shear force field was perpendicular to the moving direction and the material mainly suffered from the effect of shear deformation. The dispersed phase was gradually elongated and fractured under the shear flow field, which made the size of the dispersed phase to decrease gradually. When the size of the dispersed phase decreased to a certain size, the shear stress could not continue to act, and the final shapes of the dispersed phase were fixed to micro ellipsoid and globular.
Meanwhile, Fig. 4(b) showed the 3-plate model for the ERE dominated by the elongational flow field. Because the occupying space of PC/PP alloys was periodically changed under the synergy of the moving plate and the sliding plate, PC/PP alloys mainly underwent pulsed volume deformation, and the velocity gradient of the elongation flow field was the same as the direction of motion, which could effectively reduce the size of the dispersed phase. At the same time, the elongation flow field made PC/PP alloys to continuously undergo the process of stretching and fracturing under the process of periodical volume deformation provided by ERE, which could lead to the formation of the sea-island-fiber two phase structure including the ellipsoidal dispersed phase, strip dispersed phase and continuous phase.
3.2 Effect of ERE on the size of the dispersed phase of PC/PP alloys
In addition to the shape, the size of the dispersed phase also had an important influence on the properties of the alloys. As mentioned above, the morphology of the dispersed phase mainly included fibrous, ellipsoid and spherical. The size of the fibrous dispersed phase was difficult to measure, but the size of the ellipsoidal and spherical dispersed phases could be characterized by equivalent diameter. The average equivalent diameters of more than 100 dispersed phases of each area were randomly selected for statistical analysis. As shown in Fig. 5, compared to the TSE prepared PC/PP alloys, the average equivalent diameter of the dispersed phase in ERE prepared PC/PP alloys decreased by 44%, 57%, 69%, 26% with an increasing content of PP in the alloys. The equivalent diameter distribution of dispersed phases was concentrated in the range of 0–3 μm, which was much smaller than that of the TSE prepared PC/PP alloys. At the same time, the difference became more obvious when the contents of two components started to be approximate. These also confirmed that the elongational flow field provided by ERE could provide the material with a stronger ability to resist the agglomeration of dispersed phases, thus obtaining a more uniform two-phase structure with a smaller size of the dispersed phase.283.3 Mechanical property analysis
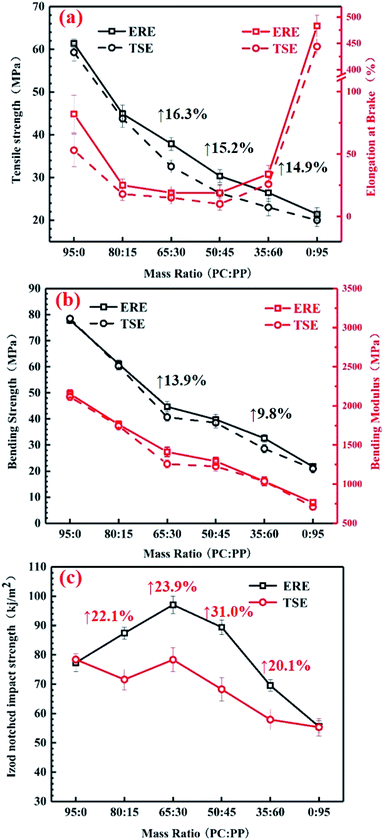
Fig. 6 showed the results of the mechanical properties of PC/PP alloys prepared by ERE and TSE. As shown in Fig. 6(a), the tensile strength of PC/PP alloys decreased with the increase in the PP content, and the elongation at the break of PC/PP alloys decreased at first and then increased with the increase in the PP content. As shown in Fig. 6(b), the bending strength and modulus of PC/PP alloys decreased with the increase in the PP content. As mentioned above, compared to the TSE prepared PC/PP alloys, the average equivalent diameter of the dispersed phase in the ERE prepared PC/PP alloys was smaller, and the particle size distribution was narrower, avoiding the large size dispersed phase to act as a defect point of the material. Therefore, the tensile and bending properties of the ERE prepared PC/PP alloys were higher for the same formulation. When the mass ratio of PC![[thin space (1/6-em)]](https://www.rsc.org/images/entities/char_2009.gif) :
:![[thin space (1/6-em)]](https://www.rsc.org/images/entities/char_2009.gif) PP was 65
PP was 65![[thin space (1/6-em)]](https://www.rsc.org/images/entities/char_2009.gif) :
:![[thin space (1/6-em)]](https://www.rsc.org/images/entities/char_2009.gif) 30, the tensile and bending strength increased by 16.3% and 13.9%, respectively. Fig. 6(c) was the notch lzod impact strength on PC/PP alloys prepared by ERE and TSE. As shown in Fig. 6(c), the notch lzod impact strength of PC/PP alloys increased first and then decreased with the increase in the PP content. When the mass ratio of PC
30, the tensile and bending strength increased by 16.3% and 13.9%, respectively. Fig. 6(c) was the notch lzod impact strength on PC/PP alloys prepared by ERE and TSE. As shown in Fig. 6(c), the notch lzod impact strength of PC/PP alloys increased first and then decreased with the increase in the PP content. When the mass ratio of PC![[thin space (1/6-em)]](https://www.rsc.org/images/entities/char_2009.gif) :
:![[thin space (1/6-em)]](https://www.rsc.org/images/entities/char_2009.gif) PP was 50
PP was 50![[thin space (1/6-em)]](https://www.rsc.org/images/entities/char_2009.gif) :
:![[thin space (1/6-em)]](https://www.rsc.org/images/entities/char_2009.gif) 45, the PC/PP alloy had the highest notch lzod impact strength. The dispersed phase could act as a stress concentrator in alloys and induce craze or shear band to consume energy when subjected to impact force. Moreover, it could also play an important role in terminating the craze instead of developing into destructive cracks, leading to the improvement of the notch lzod impact strength. It could be seen from Fig. 6(c) that the notch lzod impact strength of the ERE prepared PC/PP alloys increased by more than 20% when compared to the TSE prepared PC/PP alloys, with an increase of 31% when the mass ratio of PC/PP was 50
45, the PC/PP alloy had the highest notch lzod impact strength. The dispersed phase could act as a stress concentrator in alloys and induce craze or shear band to consume energy when subjected to impact force. Moreover, it could also play an important role in terminating the craze instead of developing into destructive cracks, leading to the improvement of the notch lzod impact strength. It could be seen from Fig. 6(c) that the notch lzod impact strength of the ERE prepared PC/PP alloys increased by more than 20% when compared to the TSE prepared PC/PP alloys, with an increase of 31% when the mass ratio of PC/PP was 50![[thin space (1/6-em)]](https://www.rsc.org/images/entities/char_2009.gif) :
:![[thin space (1/6-em)]](https://www.rsc.org/images/entities/char_2009.gif) 45.
45.
 | ||
| Fig. 6 Curves of mechanical properties versus mass ratio for PC/PP alloys by ERE and TSE (a) tensile strength and elongation(b) bending strength and modulus (c) notch lzod impact strength. | ||
In summary, compared to TSE, ERE could improve the tensile strength and the blending strength, and especially impact the strength of PC/PP alloys. The samples, prepared by ERE and TSE, with the highest notch lzod impact strength were selected for the morphology analysis. Fig. 7 showed the SEM micrographs of the injection moulded samples of PC/PP alloys (50![[thin space (1/6-em)]](https://www.rsc.org/images/entities/char_2009.gif) :
:![[thin space (1/6-em)]](https://www.rsc.org/images/entities/char_2009.gif) 45) prepared by ERE and TSE. The elongation flow field provided by ERE could not only make the size of the dispersed phase in PC/PP alloys (50
45) prepared by ERE and TSE. The elongation flow field provided by ERE could not only make the size of the dispersed phase in PC/PP alloys (50![[thin space (1/6-em)]](https://www.rsc.org/images/entities/char_2009.gif) :
:![[thin space (1/6-em)]](https://www.rsc.org/images/entities/char_2009.gif) 45) smaller and the distribution narrower, but could also make the partial dispersed phase to show a fibrous morphology, exhibiting a sea-island-fiber structure as mentioned above. Meanwhile, compared to the extruded strips, as shown in Fig. 2(a3 and b3), the morphology of the PC/PP alloys changed after injection moulding. The dispersed phase of injection moulded samples prepared by TSE and ERE was aggregated and the size increased. The shape of the dispersed phase of injection moulded samples prepared by ERE still showed fibrous morphology. It showed that the sea-island-fiber structure of ERE prepared PC/PP alloys was still maintained after the injection moulding.
45) smaller and the distribution narrower, but could also make the partial dispersed phase to show a fibrous morphology, exhibiting a sea-island-fiber structure as mentioned above. Meanwhile, compared to the extruded strips, as shown in Fig. 2(a3 and b3), the morphology of the PC/PP alloys changed after injection moulding. The dispersed phase of injection moulded samples prepared by TSE and ERE was aggregated and the size increased. The shape of the dispersed phase of injection moulded samples prepared by ERE still showed fibrous morphology. It showed that the sea-island-fiber structure of ERE prepared PC/PP alloys was still maintained after the injection moulding.
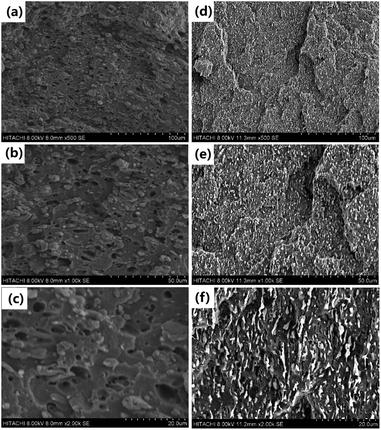 | ||
Fig. 7 SEM micrographs of injection moulded samples of PC/PP alloys (50![[thin space (1/6-em)]](https://www.rsc.org/images/entities/char_2009.gif) : :![[thin space (1/6-em)]](https://www.rsc.org/images/entities/char_2009.gif) 45) prepared by ERE and TSE. (a) ×500-TSE (b) ×1000-TSE (c) ×2000-TSE (d) ×500-ERE (e) ×1000-ERE (f) ×2000-ERE. 45) prepared by ERE and TSE. (a) ×500-TSE (b) ×1000-TSE (c) ×2000-TSE (d) ×500-ERE (e) ×1000-ERE (f) ×2000-ERE. | ||
Fig. 8 depicted the simulated schematic diagram of the fracture path in PC/PP alloys prepared by ERE and TSE under impact force. As shown in Fig. 8, different from the PC/PP alloys prepared by TSE, the sea-island-fiber structure in ERE prepared PC/PP alloys provided a more tortuous crack growing path under impact force.29 Therefore, compared to the traditional sea-island structure, the sea-island-fiber structure could consume more energy, leading to higher notch lzod impact strength of PC/PP alloys.
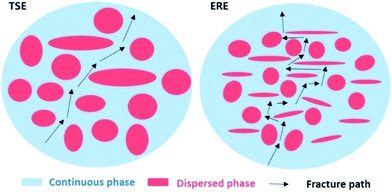 | ||
| Fig. 8 Schematic diagram of the fracture path of PC/PP alloys prepared by ERE and TSE under impact force. | ||
3.4 Dynamic rheological measurements
It is well known that dynamic rheology can indirectly be used to characterize the morphology of polymer alloys. Fig. 9(b) showed the curves of the storage modulus of PC/PP alloys prepared by ERE and TSE versus the scan frequency. As shown in Fig. 9(b), the storage modulus of PC/PP alloys prepared by ERE or TSE increased with increasing PP content in the low-frequency area. In this study, copolymer PP K8003 was used and the elastic phase in it was of a high molecular composition, which contributed to the storage modulus. As shown in Fig. 2, the size of PP as a dispersed phase in the PC matrix increased with the approximation of the PC and PP proportion, which limited the displacement of the dispersed phase,30 and especially the response was more lagging under low-frequency shear conditions, which was represented by a stronger elastic response and an increase in the storage modulus with the increase in the PP proportion. Similarly, as shown in Fig. 9(a), the complex viscosity increased with the PP proportion of PC/PP alloys.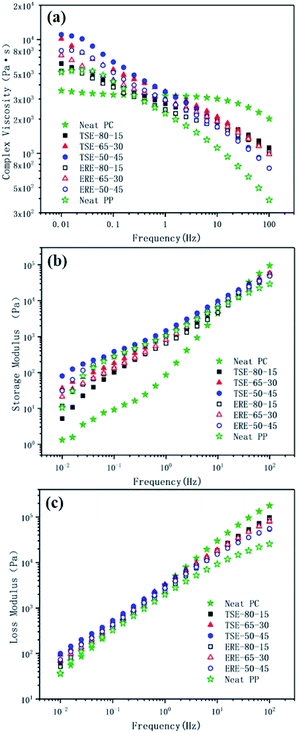 | ||
| Fig. 9 Curves of the dynamics rheology of PC/PP alloys prepared by ERE and TSE. (a) η*–ω curve (b) G′–ω curve (c) G′′–ω curve. | ||
Compared to the TSE, the difference in the storage modulus of the PC/PP alloys prepared by ERE was relatively small in the low-frequency area because the PP dispersed phase had a more uniform particle size distribution and a smaller size of the dispersed phase and more sensitive response in the condition of the low-frequency shear.
Fig. 9(c) showed the curves of the loss modulus of PC/PP alloys prepared by ERE and TSE versus the scan frequency. As shown in Fig. 9(c), the difference in the loss modulus between PC/PP alloys prepared by ERE and TSE was small and the loss modulus increased with an increase in the scan frequency, which meant that the plasticity of PC/PP alloys prepared by ERE and TSE was basically the same.
3.5 DSC properties
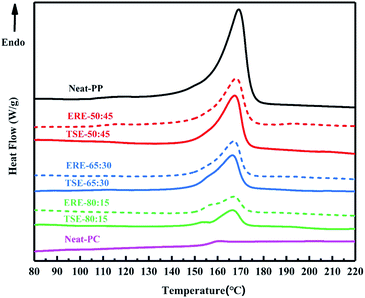
Fig. 10 showed the DSC curves of PC/PP alloys prepared by ERE and TSE. In the process of testing, the first heating curve was selected to preserve the thermal history of the samples. As shown in Fig. 10, neat-PP had a melting peak at 169.8 °C, and the glass transition temperature of neat-PC was 151.6 °C. With the increase in the PP content of the alloys, the melting peak of the alloys increased gradually. When the ratio of PC![[thin space (1/6-em)]](https://www.rsc.org/images/entities/char_2009.gif) :
:![[thin space (1/6-em)]](https://www.rsc.org/images/entities/char_2009.gif) PP was 80
PP was 80![[thin space (1/6-em)]](https://www.rsc.org/images/entities/char_2009.gif) :
:![[thin space (1/6-em)]](https://www.rsc.org/images/entities/char_2009.gif) 15, the two peaks were still not fully fused. With the increase in the PP content, the heat absorbed by the PP melt became higher and higher, and gradually changed from double peaks to a single peak. Compared to the PC/PP prepared by TSE, the fusion speed of the PC/PP alloy prepared by ERE was higher. When the ratio of PC
15, the two peaks were still not fully fused. With the increase in the PP content, the heat absorbed by the PP melt became higher and higher, and gradually changed from double peaks to a single peak. Compared to the PC/PP prepared by TSE, the fusion speed of the PC/PP alloy prepared by ERE was higher. When the ratio of PC![[thin space (1/6-em)]](https://www.rsc.org/images/entities/char_2009.gif) :
:![[thin space (1/6-em)]](https://www.rsc.org/images/entities/char_2009.gif) PP was 80
PP was 80![[thin space (1/6-em)]](https://www.rsc.org/images/entities/char_2009.gif) :
:![[thin space (1/6-em)]](https://www.rsc.org/images/entities/char_2009.gif) 15, the two peaks of the alloy prepared by ERE had a tendency to fuse, while the alloy prepared by TSE had a higher degree of separation. When the ratio of PC
15, the two peaks of the alloy prepared by ERE had a tendency to fuse, while the alloy prepared by TSE had a higher degree of separation. When the ratio of PC![[thin space (1/6-em)]](https://www.rsc.org/images/entities/char_2009.gif) :
:![[thin space (1/6-em)]](https://www.rsc.org/images/entities/char_2009.gif) PP was 65
PP was 65![[thin space (1/6-em)]](https://www.rsc.org/images/entities/char_2009.gif) :
:![[thin space (1/6-em)]](https://www.rsc.org/images/entities/char_2009.gif) 30, ERE-65
30, ERE-65![[thin space (1/6-em)]](https://www.rsc.org/images/entities/char_2009.gif) :
:![[thin space (1/6-em)]](https://www.rsc.org/images/entities/char_2009.gif) 30 showed basically a single peak, while TSE-65
30 showed basically a single peak, while TSE-65![[thin space (1/6-em)]](https://www.rsc.org/images/entities/char_2009.gif) :
:![[thin space (1/6-em)]](https://www.rsc.org/images/entities/char_2009.gif) 30 still had two peaks.
30 still had two peaks.
4. Conclusions
In this study, PC/PP alloys with different contents of PP were prepared by ERE and TSE. SEM results showed that compared to TSE, ERE could provide PC/PP alloys with a smaller dispersed phase size, a more uniform dispersed phase distribution, and a “sea-island-fiber” two-phase three-morphology structure. The results of mechanical tests showed that PC/PP alloys prepared by ERE could have better mechanical properties. The results of the dynamic rheology showed that the complex viscosity and the storage modulus of PC/PP alloys prepared by ERE were lower than those of the PC/PP alloys prepared by TSE under a low frequency shear. The fusing of the melting peak of PP and the glass transition step of PC in the DSC also confirmed that ERE could provide PC/PP alloys with a more uniform dispersed phase. It could be concluded that PC/PP alloys with good compatibility could be obtained by using ERE.Conflicts of interest
There are no conflicts to declare.References
- S. H. Jeon, W. C. Choi and T. H. Park, et al., Int. J. Precis. Eng. Manuf., 2012, 13, 85–96 CrossRef.
- Y. Yang, M. K. Li and J. W. Ai, Eng. Plast. Appl., 2019, 2, 110–115 Search PubMed.
- Y. Li, B. Yin and J. Lan, et al., Polym. Mater. Sci. Eng., 2010, 4, 55–58 Search PubMed.
- B. Li, Study on PC/PP Blends and Their Nano-CaCO3 Composites, Master Thesis, Wuhan University of Technology, 2015.
- K. S. Jang, J. Appl. Polym. Sci., 2019, 136(9), 47110 CrossRef.
- A. Arefazar, J. Macromol. Sci., Part B: Phys., 2014, 53, 1103–1115 CrossRef.
- B. D. Favis and J. P. Chalifoux, Polymer, 1988, 29, 1761–1767 CrossRef CAS.
- B. D. Favis and D. Therrien, Polymer, 1991, 32, 1474–1481 CrossRef CAS.
- C. Lavallée, M. Carmel and L. A. Utracki, Polym. Eng. Sci., 1992, 32, 1716–1726 CrossRef.
- C. Li, G. Tian and Y. Zhang, et al., Polym. Test., 2002, 21(8), 919–926 CrossRef CAS.
- S. M. Kim, H. J. Park, E. J. Lee, S. G. Lee and K. Y. Lee, Polymer, 2018, 42, 620–626 CAS.
- H. G. Guo, J. Sheng and S. G. Zhao, Polym. Mater. Sci. Eng., 2005, 21, 216–219 CAS.
- K. Wang, C. Zhou and W. Yu, J. Appl. Polym. Sci., 2002, 85, 92–103 CrossRef CAS.
- L. Manas-Zloczower, Mixing and Compounding of Polymers: Theory and Practice, Hanser Publications, 2009, ISBN-13: 978-1569904244 Search PubMed.
- Z. Tadmor, Ind. Eng. Chem. Fundam., 1976, 15, 346–348 CrossRef CAS.
- J. P. Qu, A method and a device for plasticizing and transporting polymer material based on elongation rheology, EP, WO2009094815 A1, 2009.
- C. Meng and J. P. Qu, J. Polym. Eng., 2018, 38, 427–435 CAS.
- J. P. Qu, H. Z. Chen and S. R. Liu, et al., J. Appl. Polym. Sci., 2013, 128, 3576–3585 CrossRef CAS.
- J. P. Qu, G. Z. Zhang and X. C. Yin. Eccentric rotor volume pulse deformation plasticizing transporting method, China patent 201410206552.8, 2014.
- Y. H. Feng, Y. Gao and J. Chen, et al., Polym. Int., 2019, 68, 862–870 CrossRef CAS.
- C. L. Cao, X. C. Chen and J. X. Wang, et al., J. Polym. Res., 2017, 12, 1–9 Search PubMed.
- D. Yuan, T. Wu and R. Y. Chen, et al., J. Macromol. Sci., Part B: Phys., 2018, 1–41 Search PubMed.
- T. Wu, Y. Tong and F. Qiu, et al., Polym. Adv. Technol., 2018, 29(1), 41–51 CrossRef CAS.
- H. Zhang, J. Huang and L. Yang, et al., RSC Adv., 2015, 5, 4639–4647 RSC.
- X. Zhang, Y. Tan and R. Chen, et al., Polym. Adv. Technol., 2018, 1–11 Search PubMed.
- J. S. Wen, M. K. Yang and D. J. Fan, et al., Adv. Polym. Technol., 2018, 2, 1–13 Search PubMed.
- S. Dai, L. Ye and G. H. Hu, J. Appl. Polym. Sci., 2012, 126(3), 1165–1173 CrossRef CAS.
- G. Z. Zhang, T. Wu and W. Y. Lin, et al., Compos. Sci. Technol., 2017, 145, 157–164 CrossRef CAS.
- T. Wu, D. Z. Wang and J. P. Qu, et al., Adv. Ind. Eng. Polym. Res., 2019, 2, 93–101 Search PubMed.
- F. Su, J. Yan and H. X. Huang, J. Appl. Polym. Sci., 2011, 119, 1230–1238 CrossRef CAS.
| This journal is © The Royal Society of Chemistry 2019 |

