 Open Access Article
Creative Commons Attribution 3.0 Unported Licence
Thermal and structural properties, and molecular dynamics in organic–inorganic hybrid perovskite (C2H5NH3)2ZnCl4
Ae Ran Lim *ab
*ab
aAnalytical Laboratory of Advanced Ferroelectric Crystals, Jeonju University, Jeonju 55069, South Korea. E-mail: aeranlim@hanmail.net; arlim@jj.ac.kr
bDepartment of Science Education, Jeonju University, Jeonju 55069, South Korea
First published on 21st November 2019
Abstract
The thermal and structural properties and molecular dynamics of layered perovskite-type (C2H5NH3)2ZnCl4 are investigated by differential scanning calorimetry, thermogravimetric analysis, and magic angle spinning nuclear magnetic resonance spectroscopy. The thermal properties and phase transitions are studied. Additionally, the Bloembergen–Purcell–Pound (BPP) curves for the 1H spin–lattice relaxation time T1ρ in the C2H5NH3 cation and for the 13C T1ρ in C2H5 are shown to have minima as a function of inverse temperature. This observation implies that these curves represent the rotational motions of 1H and 13C in the C2H5NH3 cation. The activation energies for 1H and 13C in the C2H5NH3 cation are obtained; the molecular motion of 1H is enhanced at the C-end and N-end of the organic cation, and that at the carbons of the main chain is not as free as that for protons at the C-end and N-end.
I. Introduction
Hybrid organic–inorganic compounds allow for the possibility of combining the properties of organic and inorganic materials at the molecular level.1–4 This class of hybrid materials is very broad and offers a wide set of different structures, properties, and potential applications.5–12 A new type of layered perovskite multiferroic, (C2H5NH3)2CuCl4, as a metal organic compound was found by Kundys et al.6 Multiferroics refer to materials that simultaneously have two or more of the following properties: spontaneous ferroelectricity, ferromagnetism, or ferroelasticity.13 (C2H5NH3)2CuCl4 crystallizes in a layered perovskite structure consisting of nearly isolated layers of corner-sharing ZnCl6 octahedra, and the interlayer distance is approximately 10 Å, where the layers are separated by two layers of ethylammonium cations (C2H5NH3)+.14 The NH3 polar heads of the chains are linked to the chlorine ions of the ZnCl6 octahedra by three hydrogen bonds N–H⋯Cl. The organic chains are joined by weak hydrogen bonds from the NH3 groups to the Cl ions. One interesting series is the metal–organic hybrids of chemical formula such as (C2H5NH3)2ZnCl4 with perovskite-type transition metal salts. A study of the electrical, dielectric, and optical properties of (C2H5NH3)2ZnCl4 was reported by Mohamed et al.15 They found that (C2H5NH3)2ZnCl4 is a layered perovskite-type compound that undergoes five phase transitions at 231 K, 234 K, 237 K, 247 K, and 312 K as determined by differential scanning calorimetry (DSC).15 The intensities of the endotherm peaks at 231 K, 237 K, and 312 K are very weak and perhaps correspond to second-order transformations. Tello16 reported a ferroelastoelectric phase transition at 243.3 K by optical and X-ray measurements with a group theoretical analysis. The phase transitions in this crystal are mostly connected to changes in the arrangement of the alkylammonium chains. The crystal structure of (C2H5NH3)2ZnCl4 at room temperature is orthorhombic. Fig. 1 reveals that its atomic arrangement can be described by an alternation of the organic and inorganic entities in the bc plane. This compound is characterized by two simple hydrogen bonds N–H⋯Cl linking the organic (C2H5NH3)+ cation to the (ZnCl4)2− tetrahedral anions.17 This compound is crystallized in the orthorhombic system with a space group of Pna21 at room temperature, and the lattice parameters are a = 10.043 Å, b = 17.594 Å, c = 7.397 Å, and molecules per unit cell, Z = 4.18 The Zn atoms in (C2H5NH3)2ZnCl4 are tetrahedrally coordinated, while the Cu atoms in (C2H5NH3)2CuCl4 are octahedrally coordinated. Although the chemical composition of the Zn and Cu compounds is similar, the coordination of the metal atom is different.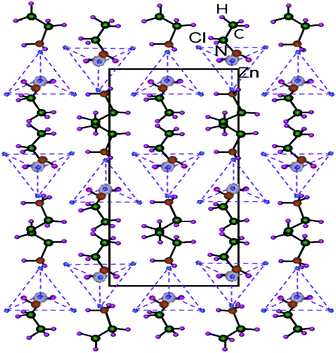 | ||
| Fig. 1 Orthorhombic structure of a (C2H5NH3)2ZnCl4 crystal for bc-plane at room temperature.18 | ||
The structural geometry and molecular dynamics of the organic molecules within the layered hybrid structure are important for determining the influence of temperature on the evolution of structural phase transitions in the perovskite structure. Physical properties in particular depend on the characteristics of the metallic anion and the organic cation. Until now, the physical properties of (C2H5NH3)2ZnCl4 have been reported by a few research groups, whereas the thermal properties and molecular dynamics have not been studied.
The goal of this work is to analyze the crystal growth, thermodynamic properties, and structural dynamics of a (C2H5NH3)2ZnCl4 single crystal. The analysis is based on DSC, thermogravimetric analysis (TGA), and magic angle spinning nuclear magnetic resonance (MAS NMR). We measured the line widths, chemical shifts, and spin–lattice relaxation times (T1ρ) in the rotating frame using 1H MAS NMR, 13C cross-polarization (CP)/MAS NMR, and 14N static NMR as a function of temperature. The molecular dynamics of the (C2H5NH3) cation were investigated near the phase transition temperatures, and we discussed the activation energies for the molecular dynamics of C2H5 and NH3 in the (C2H5NH3)+ cation. Furthermore, we have compared the molecular motions of (C2H5NH3)2ZnCl4 obtained here and those of the previously reported (C2H5NH3)2CuCl4.
II. Experimental methods
Crystals of (C2H5NH3)2ZnCl4 were prepared by dissolving stoichiometric amounts of the starting materials, commercial CH3CH2NH2·HCl (ethylamine hydrochloride, Aldrich 98%) and ZnCl2, in water. Single crystals were grown by a slow evaporation of the aqueous solution at room temperature. The obtained crystals were colorless and hexagonal in shape.The thermal stability was checked by means of TGA and optical polarizing microscopy. The TGA curve at a heating rate of 10 °C min−1 was measured under N2 atmosphere, and the mass of the powdered sample used in the TGA experiment was 6.63 mg. The phase transitions were performed by DSC in the temperature range of 300–670 K with 10 °C min−1 heating rates.
The line widths, chemical shifts, and T1ρ values for (C2H5NH3)2ZnCl4 were obtained by 1H MAS NMR and 13C CP/MAS NMR at Larmor frequencies of ω0/2π = 400.13 and 100.62 MHz, respectively, using a Bruker 400 MHz NMR spectrometer at the Korea Basic Science Institute, Western Seoul Center. Powdered samples were placed within a 4 mm CP/MAS probe, and the MAS rate for 1H and 13C measurements, to minimize spinning sideband overlap, was set to 10 kHz. The 1H T1ρ values were determined using a π/2 − t sequence by varying the duration of spin-locking pulses. 13C T1ρ values were measured by varying the duration of the spin-locking pulse applied after the CP preparation period. The width of the π/2 pulse used for measuring T1ρ for 1H and 13C was 3.7 μs, with the spin-locking field set at 67.56 kHz. The chemical shifts and T1ρ were measured over a temperature range of 180–430 K.
In addition, the 14N NMR spectra of the (C2H5NH3)2ZnCl4 single crystals in the laboratory frame were measured using a Unity INOVA 600 NMR spectrometer at the same facility. The static magnetic field was 14.1 T and the Larmor frequency was set to ω0/2π = 43.345 MHz. The 14N NMR experiments were conducted using a solid-echo (π/2–t–π/2–t) pulse sequence. The width of the π/2 pulse was 4 μs.
III. Experimental results
Fig. 2 shows the simultaneous TGA and DSC curves for the (C2H5NH3)2ZnCl4 single crystal. A drastic weight loss onset occurred at 460 K (=Td), which is attributed to the beginning of the evaporation of C2H5NH2 and HCl due to partial thermal decomposition. The sample lost weight sharply between 500 K and 670 K, with a corresponding weight loss of 48%, which agrees almost exactly with the content of the organic component (45.53%) of C2H5NH3Cl in (C2H5NH3)2ZnCl4. DSC studies on the perovskite were undertaken to demonstrate structural transitions below the melting/decomposition point. In the DSC curve, the endotherm peaks at 320 K, 376 K, and 438 K correspond to the phase transitions. The (C2H5NH3)2ZnCl4 undergoes phase transitions at 438 K, 376 K, and 320 K, which are denoted as the TC1, TC2, and TC3 with decreasing temperature. As the temperature increases, the crystal is constantly colorless and transparent (300 K, 400 K, 450 K), and then it starts melting near 460 K. The crystal is melted near 475 K, as shown in the inset in Fig. 2.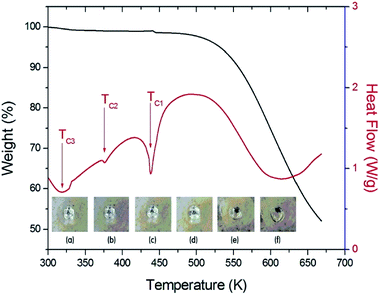 | ||
| Fig. 2 TGA and DSC curves of (C2H5NH3)2ZnCl4 crystal (inset: changes of a (C2H5NH3)2ZnCl4 crystal according to the temperature: (a) 300 K, (b) 400 K, (c) 450 K, (d) 460 K, (e) 470 K, and (f) 475 K). | ||
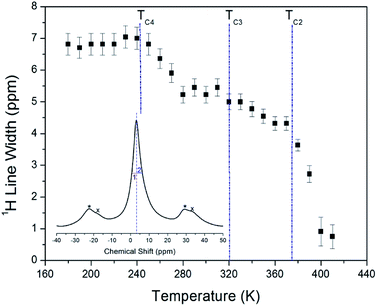
The 1H NMR spectra at a frequency of 400.13 MHz were obtained by MAS NMR. The 1H spectrum recorded at 300 K is shown in the inset in Fig. 3. The observed resonance line has an asymmetric shape, as the full-width at half-maximum (FWHM) values on the left side (symbol 1) and right side (symbol 2) are not the same. The asymmetric line shape is attributed to the two overlapping lines for C2H5 and NH3. Additionally, the FWHM line width narrows significantly with increasing temperature, as shown in Fig. 3. Note that there is no abrupt change in the line width near TC3 and TC4, whereas near TC2 it is abruptly decreased. Here, the TC4 (=247 K) is the previously reported phase transition temperature.16
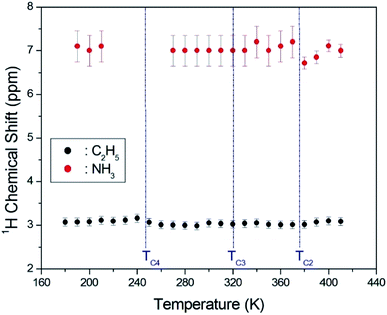
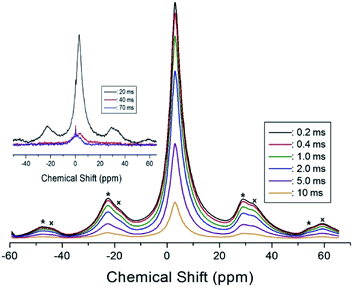
The asymmetric line shape in the inset in Fig. 3 is attributed to the C2H5 and NH3 overlapping lines. Thus, the overlapping peak is very broad. However, the spinning sidebands of the two types are evident in Fig. 3. Therefore, the peaks for C2H5 and NH3 by distance of sidebands can be distinguished. The spinning sidebands for C2H5 were marked with asterisks, while those for NH3 were marked with crosses. The peak of the lower chemical shift was attributed to 1H in C2H5, while that of the higher chemical shift was attributed to 1H in NH3. The spectrum at 300 K consisted of two peaks at chemical shifts of δ = 3.05 ppm and δ = 7 ppm, which were assigned to the 1H in the ethyl group C2H5 and the ammonium group NH3, respectively. The 1H chemical shifts for methyl and ammonium groups were nearly constant with temperature, as shown in Fig. 4.
In order to obtain the 1H relaxation time values, the magnetization recovery curves as a function of delay time were measured at several temperatures for (C2H5NH3)2ZnCl4. The magnetization recovery curves for various delay times for 1H at 300 K are shown in Fig. 5. All traces obtained can be described by the single-exponential function19,20
| P(t)/P0 = exp(−t/T1ρ), | (1) |
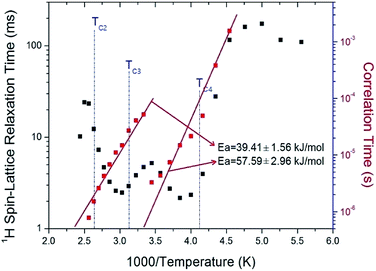 | ||
| Fig. 6 1H spin–lattice relaxation times T1ρ in the rotating frame and correlation time of (C2H5NH3)2ZnCl4 as a function of inverse temperature. | ||
The T1ρ values of protons in the (C2H5NH3)2ZnCl4 are almost continuous near TC3 and TC4, and these values are on the order of a few milliseconds. The T1ρ values abruptly decreased with temperature in the region approaching TC2. The relaxation time for the 1H nucleus has minimum values of 2.17 ms and 2.48 ms at 260 K and 330 K, respectively. This feature of T1ρ indicates distinct molecular motions. The T1ρ values are related to the corresponding values of the rotational correlation time, τC, which is a direct measure of the rate of molecular motion. For the spin–lattice relaxation time in the rotating frame, the experimental value of T1ρ can be expressed in terms of the correlation time τC for the molecular motion as suggested by the Bloembergen–Purcell–Pound (BPP) theory:21,22
| T1ρ−1 = (N/20)(γH γCħ/rH–C3)2{4f(ω1) + f(ωH − ωC) + 3f(ωC) + 6f(ωH + ωC) + 6f(ωH)}; f(ω1) = τC/(1 + ω12τC2), f(ωH − ωC) = τC/[1 + (ωH − ωC)2τC2], f(ωC) = τC/(1 + ωC2τC2), f(ωH + ωC) = τC/[1 + (ωH + ωC)2τC2], f(ωH) = τC/(1 + ωH2τC2). | (2) |
τC = τ0![[thin space (1/6-em)]](https://www.rsc.org/images/entities/char_2009.gif) exp(−Ea/RT), exp(−Ea/RT),
| (3) |
![[thin space (1/6-em)]](https://www.rsc.org/images/entities/char_2009.gif) τC vs. 1000/T curve shown in Fig. 6; we obtained Ea = 39.41 ± 1.56 kJ mol−1 and Ea = 57.59 ± 2.96 kJ mol−1 for high and low temperatures, respectively. Here, T1ρ and Ea for 1H are averaged for all hydrogens in the (C2H5NH3) cation. The rotational motion for protons at the end of the organic cation is more activated at the low temperature than at the high temperature.
τC vs. 1000/T curve shown in Fig. 6; we obtained Ea = 39.41 ± 1.56 kJ mol−1 and Ea = 57.59 ± 2.96 kJ mol−1 for high and low temperatures, respectively. Here, T1ρ and Ea for 1H are averaged for all hydrogens in the (C2H5NH3) cation. The rotational motion for protons at the end of the organic cation is more activated at the low temperature than at the high temperature.
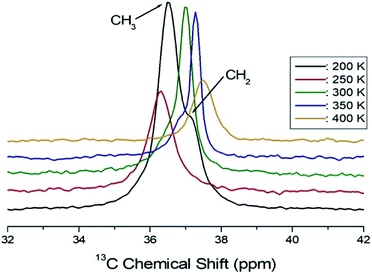
Structural analysis of the 13C in C2H5 was also performed using 13C CP/MAS NMR. The 13C MAS NMR spectrum for (C2H5NH3)2ZnCl4 is shown in Fig. 7 as a function of temperature. The overlapped two signals in the spectrum for CH3 and CH2 in C2H5 are shown in Fig. 7. The resonance line has an asymmetric shape, similar to the 1H line shape. At 200 K, the chemical shifts of δ = 36.51 ppm and δ = 37.12 ppm with respect to tetramethysilane (TMS) are assigned to CH3 and CH2, respectively. The chemical shifts above 250 K were only continuous changes, whereas there was an abrupt change near 250 K. The change in the chemical shift is associated with a structural phase transition occurring at this temperature.
The nuclear magnetization was also measured as a function of delay time in order to obtain the 13C T1ρ values. The signal intensity of the nuclear magnetization recovery curves for 13C is described by a single exponential function of eqn (1) at all temperatures. The 13C T1ρ values for C2H5 in (C2H5NH3)2ZnCl4 are plotted as a function of inverse temperature in Fig. 8. The 13C T1ρ values near the phase-transition temperatures TC3 and TC4 are approximately continuous, whereas the T1ρ near TC2 is abruptly decreased, similar to the 1H T1ρ. The T1ρ value for carbon at room temperature is 13.65 ms. The T1ρ curve below TC2 can be reproduced by BPP theory, and the BPP curve shows a minimum of 6.30 ms at 260 K. The correlation time for the rotational motion of C2H5 is obtained, and the activation energy from the log![[thin space (1/6-em)]](https://www.rsc.org/images/entities/char_2009.gif) τC vs. 1000/T curve shown in Fig. 8; we obtained Ea = 21.13 ± 1.27 kJ mol−1.
τC vs. 1000/T curve shown in Fig. 8; we obtained Ea = 21.13 ± 1.27 kJ mol−1.
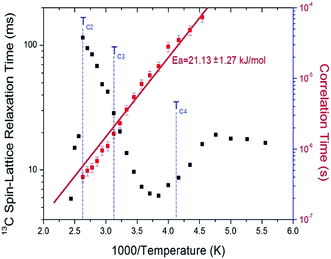 | ||
| Fig. 8 13C spin–lattice relaxation times T1ρ in the rotating frame and correlation time of (C2H5NH3)2ZnCl4 as a function of inverse temperature. | ||
In order to obtain information concerning the phase transition near 247 K (=TC4), the NMR spectrum of 14N (I = 1) in the laboratory frame was obtained. Two resonance signals with respect to NH4Cl were expected from the quadrupole interactions of the 14N nucleus. The 14N NMR spectra in (C2H5NH3)2ZnCl4 single crystals between 220 K and 290 K are plotted in Fig. 9. The number of resonance lines varies near 243 K; the 14N signals below 240 K show two resonance lines denoted by symbol 1, whereas those above 240 K show four resonance lines denoted by symbols 1 and 2. These four signals are attributed to the N(1) and N(2) sites in the physically inequivalent NH3 (1) and NH3 (2) ions, respectively. The abrupt splitting of the 14N NMR line is related to the phase transition at 247 K. This splitting of the 14N resonance signals is nearly constant with temperature. However, the 14N NMR spectrum above 300 K could not be detected due to a low intensity.
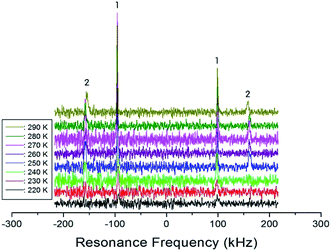 | ||
| Fig. 9 The resonance frequency of 14N NMR spectra in (C2H5NH3)2ZnCl4 single crystal between 220 K and 290 K. | ||
IV. Conclusion
We discussed the molecular motions of cations of Zn-based hybrid materials based on NMR studies. The present work is devoted to the crystal growth, DSC, TGA, and NMR spectroscopy of the (C2H5NH3)2ZnCl4 compound. The thermal stability at different temperatures was considered. The cation dynamics in a layered perovskite-type (C2H5NH3)2ZnCl4 single crystal were investigated as a function of temperature by 1H MAS NMR, 13C CP/MAS NMR, and 14N static NMR experiments. There was no jump in T1ρ across the phase transition at TC3 and TC4, while T1ρ showed a slight jump at TC2. To obtain detailed information about the cation dynamics of this crystal, the spin–lattice relaxation time T1ρ in the rotating frame for both 1H and 13C were obtained, revealing that these atoms undergo rotational motions. The BPP curves for the 1H T1ρ in C2H5NH3 cation and for the 13C T1ρ in C2H5 were shown to have minima as a function of inverse temperature. This implies that these curves represent the rotational motions of 1H and 13C. The activation energy for 1H in the C2H5NH3 cation is Ea = 39.41 kJ mol−1 above 290 K and 57.59 kJ mol−1 below 290 K, whereas that for 13C in the C2H5NH3 cation is 21.13 kJ mol−1. Furthermore, the carbon dynamics of C2H5 undergo rotation slower than protons. This implies that molecular motion is enhanced at the carbon-end and nitrogen-end of the organic cation, whereas molecular motion is not free at the main chain carbons of the organic cation.Moreover, we compared the phase transition temperatures and molecular motions of the previously reported (C2H5NH3)2CuCl4 (ref. 23) and those of (C2H5NH3)2ZnCl4 studied here. The difference between these compounds is only the inorganic cation. (C2H5NH3)2ZnCl4 and (C2H5NH3)2CuCl4 are characterized by five (231, 234, 237, 247, and 312 K) and four (236, 330, 357, and 371 K) phase transitions, respectively. Furthermore, the molecular motions affecting the spin–lattice relaxation time T1ρ in (C2H5NH3)2ZnCl4 are very different from those for (C2H5NH3)2CuCl4. The activation energies obtained from T1ρ by the 1H and 13C measurements for the two compounds are summarized in Table 1. The Ea for 1H in (C2H5NH3)2ZnCl4 are the values at high temperatures above 290 K and the low temperatures below 290 K, respectively. In the case of (C2H5NH3)2CuCl4, Ea for each C2H5 and NH3 is shown at a temperature range from 180 K to 240 K.23 The values of Ea obtained from the 1H measurements of (C2H5NH3)2ZnCl4 are larger than those of (C2H5NH3)2CuCl4, whereas those obtained from the 13C measurments are similar. These results indicate that the activation energies obtained from the 1H measurements for the H–Cl–Zn bond in (C2H5NH3)2ZnCl4 without the paramagnetic ions is larger than that for the H–Cl–Cu bond in (C2H5NH3)2CuCl4 including paramagnetic ions. These differences are due to the differences in the electronic structure of the Zn2+ and Cu2+ ions, particularly, the d electrons, which screen the nuclear charge from the motion of the outer electrons. Zn2+ has filled d shell, whereas Cu2+ has one s electron outside the closed d shell. It is also likely due to several other factors, such as different coordination of the metal atom, different lattice constants, and hydrogen bonding strength. This suggests that the differences in the chemical properties of metal ions are responsible for the variations in the characteristics of the phase transitions and molecular motions in these crystals. This study can motivate us to find a solution for improving the material features as well as solar cell performance using lead-free perovskites based on Zn or Cu in market-competitive optoelectronic materials for photovoltaics (PV) and light emitting diodes (LED) applications.3,24,25
| (C2H5NH3)2ZnCl4 | (C2H5NH3)2CuCl4 (ref. 23) | |
|---|---|---|
| 1H | 39.41 ± 1.56 (for all hydrogen above 290 K) | 12.19 ± 1.30 (for C2H5 below 240 K) |
| 1H | 57.59 ± 2.96 (for all hydrogen below 290 K) | 8.33 ± 0.50 (for NH3 below 240 K) |
| 13C | 21.13 ± 1.27 (for C2H5) | 21.35 ± 0.45 (for CH3) |
| 13C | 19.72 ± 1.76 (for CH2) |
Conflicts of interest
There are no conflicts to declare.Acknowledgements
This research was supported by the Basic Science Research program through the National Research Foundation of Korea (NRF), funded by the Ministry of Education (2018R1D1A1B07041593).References
- O. M. Yaghi, G. Li and H. Li, Nature, 1995, 378, 703 CrossRef CAS.
- D. B. Mitzi, J. Chem. Soc., Dalton Trans., 2001, 48, 1 RSC.
- J. A. Aramburu, P. G. Fernandez, N. R. Mathiesen, J. M. G. Lastra and M. Moreno, J. Phys. Chem. C, 2018, 122, 5071 CrossRef CAS.
- C. N. R. Rao, A. K. Cheetham and A. Thirumurugan, J. Phys.: Condens. Matter, 2008, 20, 83202 CrossRef.
- F. Chiarella, A. Zappettini, P. Ferro, T. Besagni, F. Licci, A. Cassinese, M. Barra, R. Vaglio and C. Aruta, Cryst. Res. Technol., 2005, 40, 1028 CrossRef CAS.
- B. Kundys, A. Lappas, M. Viret, V. Kapustianyk, V. Rudyk, S. Semak, Ch. Simon and I. Bakaimi, Phys. Rev. B, 2010, 81, 224434 CrossRef.
- P. Zolfaghari, G. A. de Wijs and R. A. de Groot, J. Phys.: Condens. Matter, 2013, 25, 295502 CrossRef CAS PubMed.
- C. B. Mohamed, K. Karoui, F. Jomni, K. Guidara and A. B. Rhaiem, J. Mol. Struct., 2015, 1082, 38 CrossRef CAS.
- E. Suprayoga, A. A. Nugroho, A. O. Polyakov, T. T. M. Palstra and I. Watanabe, J. Phys.: Conf. Ser., 2014, 551, 12054 CrossRef.
- R. Yadav, D. Swain, P. P. Kundu, H. S. Nair, C. Narayana and S. Elizabeth, Phys. Chem. Chem. Phys., 2015, 17, 12207 RSC.
- R. Lefi, F. B. Naser and H. Guermazi, J. Alloys Compd., 2017, 696, 1244 CrossRef CAS.
- F. B. Nasr, R. Lefi and H. Guermazi, J. Mol. Struct., 2018, 1165, 236 CrossRef.
- H. Schmid, Ferroelectrics, 1994, 162, 317 CrossRef.
- J. Ding, H. Li, L. Wen, X. Kang, H. Li and J. Zhang, J. Magn. Magn. Mater., 2013, 346, 91 CrossRef CAS.
- C. B. Mohamed, K. Karoui, M. Tabellout and A. B. Rhaiem, J. Alloys Compd., 2016, 688, 407 CrossRef.
- M. J. Tello, A. Lopez-Echarri, J. Zubillaga, I. Ruiz-Larrea, F. J. Zuniga, G. Madariaga and A. Gomez-Cuevas, J. Phys.: Condens. Matter, 1994, 6, 6751 CrossRef CAS.
- C. B. Mohamed, K. Karoui and A. B. Rhaiem, Phase Transitions, 2018, 91, 1162 CrossRef.
- C. B. Mohamed, K. Karoui, A. Bulou and A. B. Rhaiem, Physica E, 2017, 87, 141 CrossRef.
- J. L. Koenig, Spectroscopy of Polymers, Elsevier, New York, 1999 Search PubMed.
- A. R. Lim, RSC Adv., 2018, 8, 18656 RSC.
- A. Abragam, The Principles of Nuclear Magnetism, Oxford University press, Oxford, 1961 Search PubMed.
- J. Mcbrierty and K. J. Packer, Nuclear Magnetic Resonance in Solid Polymers, Cambridge University Press, Cambridge, 1993 Search PubMed.
- A. R. Lim and Y. L. Joo, RSC Adv., 2018, 8, 34110 RSC.
- Q. Chen, N. D. Marco, Y. Yang, T.-B. Song, C.-C. Chen, H. Zhao, Z. Hong, H. Zhou and Y. Yang, Nano Today, 2015, 10, 355 CrossRef CAS.
- A. M. Elseman, A. E. Shalan, S. Sajid, M. M. Rashad, A. M. Hassan and M. Li, ACS Appl. Mater. Interfaces, 2018, 10, 11699 CrossRef CAS PubMed.
| This journal is © The Royal Society of Chemistry 2019 |

