
 Open Access Article
 This Open Access Article is licensed under a Creative Commons Attribution-Non Commercial 3.0 Unported Licence
Comprehensive evaluation of the composition of Mingshan Laochuancha green tea and demonstration of hypolipidemic activity in a zebrafish obesity model†
Yue Xiao ab,
Yanping Wuab,
Kai Zhong*ab and
Hong Gaoab
ab,
Yanping Wuab,
Kai Zhong*ab and
Hong Gaoab
aCollege of Biomass Science and Engineering, Healthy Food Evaluation Research Center, Sichuan University, Chengdu 610065, China. E-mail: eric211@163.com; Tel: +86-028-85405236
bKey Laboratory of Food Science and Technology of Ministry of Education of Sichuan Province, Sichuan University, Chengdu 610065, China
First published on 13th December 2019
Abstract
Laochuancha is an ancient tea plant originating from the Mingshan district of Ya'an city, Sichuan province, China, which is used to produce tea products with excellent quality. Mingshan Laochuancha green tea (MLGT) is a type of green tea manufactured from Laochuancha tea leaves. Currently, not much is known regarding the chemical compositions of MLGT and its bioactivity. Herein, the present study explores, for the first time, the chemical compositions and hypolipidemic activity of MLGT. It was observed that K was the most abundant element of 26.58 mg g−1, and contents of toxic As, Cd, Cr and Pb elements were all below concentration limits. Alcohols (55.65%) were the main volatiles, and numerous volatiles with chestnut-like aroma were detected. Total content of 21 amino acids was 28.61 mg g−1, and amino acids with velvety-like and umami taste totally accounted for 65.39%. The high content of amino acids and low ratio of polyphenols to total amino acids were attributed to strong umami and mellow taste of MLGT. Moreover, catechins and alkaloids were abundant in MLGT, where EGCG (85.82 mg g−1) and caffeine (33.78 mg g−1) were at highest content. Analyses of chemical compositions revealed excellent quality of MLGT. Correspondingly, MLGT showed potent hypolipidemic activity, and water extract of MLGT at 200 μg mL−1 significantly reduced lipid level to 43.06% of high-fat zebrafish. Results firstly revealed the quality characteristics of MLGT and provided further insights into bioactivity of Laochuancha.
1. Introduction
The tea plant, Camellia sinensis (L.) O. Kuntze, family Theaceae, is a small perennial evergreen and cross-pollinated plant.1 According to historical records, tea plants are originated from southwest China, Sichuan, Yunnan, and Guizhou provinces.2–4 Many ancient tea plants are distributed in these provenances of tea plants, and they are important genetic resources for breeding of new improved tea cultivars. Among them, Laochuancha (Camellia sinensis (L.) O. Kuntze. var. sinensis), also known as Wozicha, is the main type of original ancient tea plant in Mingshan district, Ya'an city, Sichuan province in China, where is a famous tea-producing area and is one of the best-preserved areas of ancient tea plants. Laochuancha is mainly distributed at mountains with altitudes of 800–1300 m in Mingshan district (Fig. 1). It retains many genes of ancient tea plants, and is a living fossil for inheriting excellent quality of Sichuan teas.5 Compared to improved tea cultivars, Laochuancha has many advantages. It can grow in extreme cold and drought areas and have better resistance to pests and plant pathogens. Since Laochuancha is distributed and cultivated at mountains with high altitudes, there are few diseases and insect pests in Laochuancha, as well as no chemical pesticides needed for it, which makes Laochuancha much safer.5 In addition, Laochuancha tastes better than improved tea cultivars, because it has a long dormant period and germinates late, which results in abundant accumulated substances in fresh tea leaves of Laochuancha, such as high content of amino acids.5 Meanwhile, the low yield of Laochuancha caused the gradual substitution of Laochuancha by improved tea cultivars with high yield in the last twenty years. However, Laochuancha is getting more and more attention for the pursuit of excellent-quality tea products by tea lovers in recent years.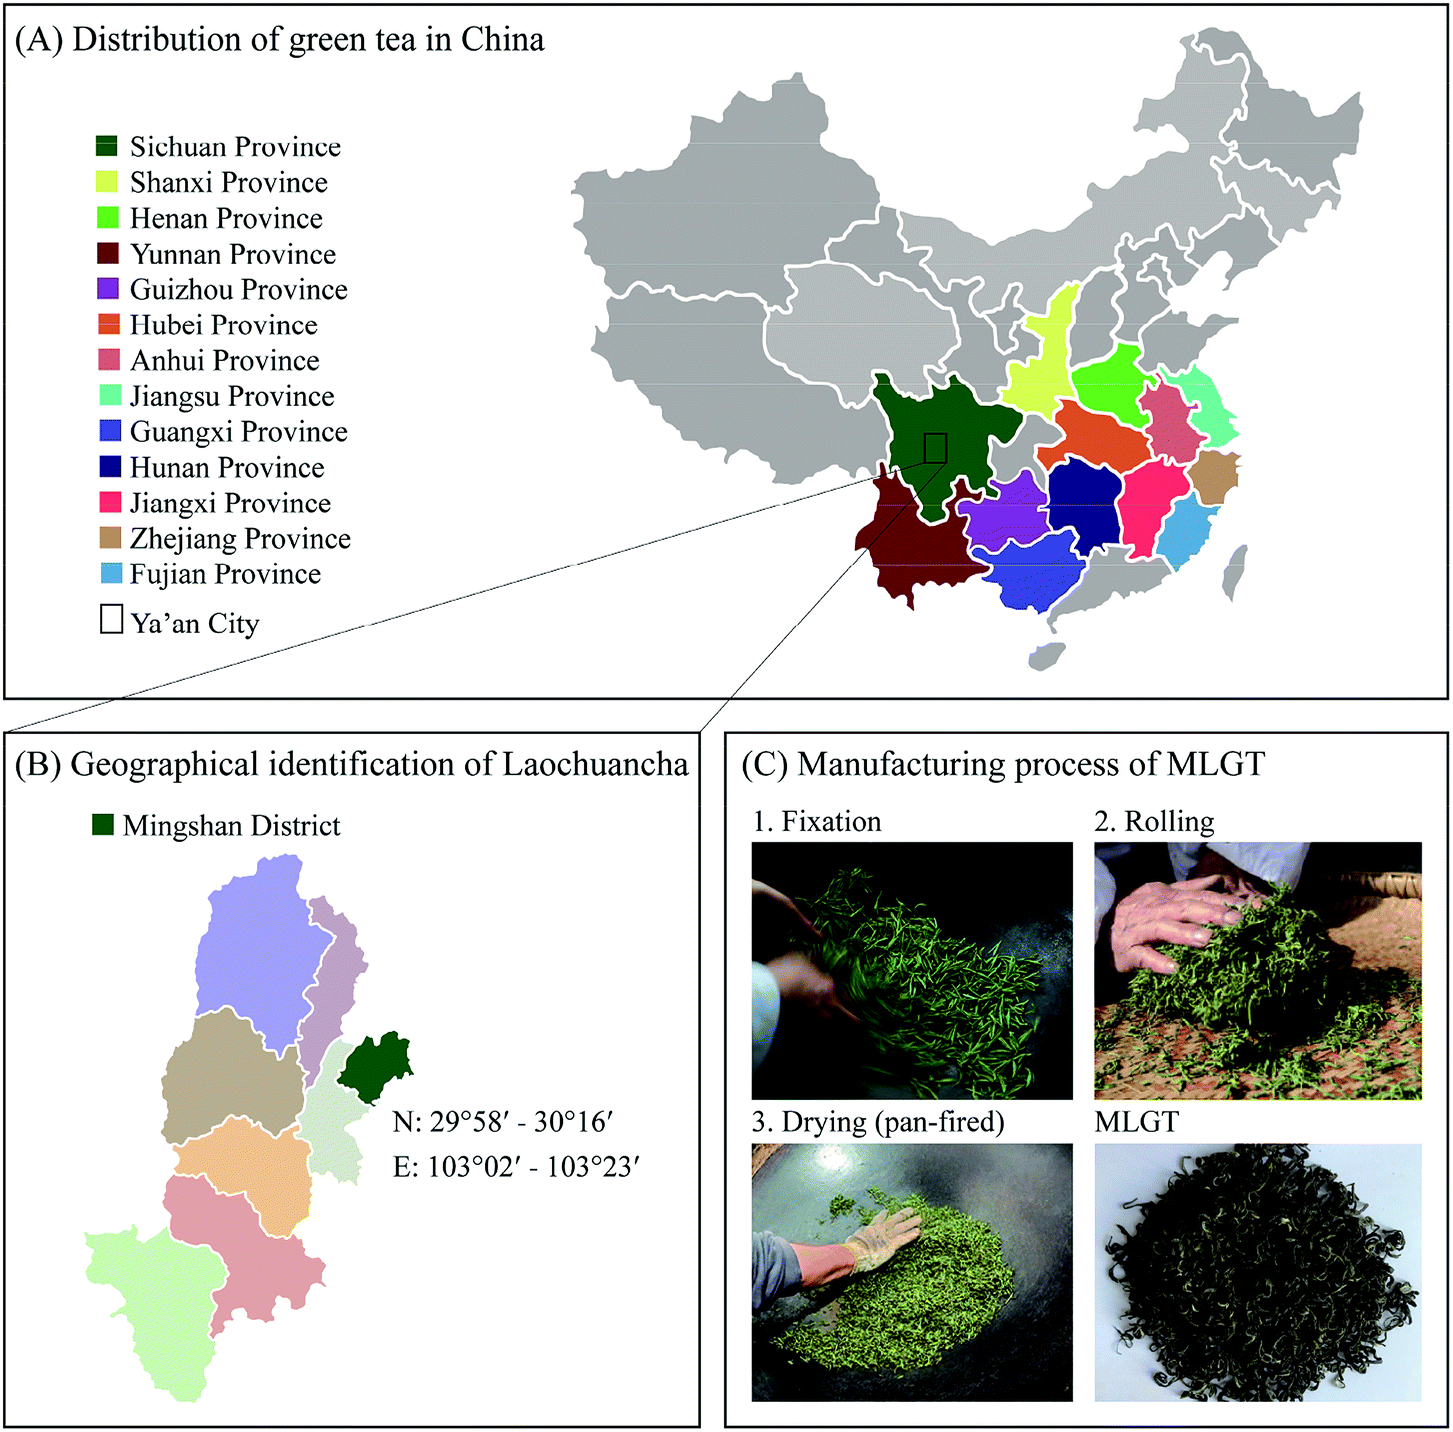 | ||
| Fig. 1 Related information of Mingshan Laochuancha green tea (MLGT). (A) Distribution of green tea in China. (B) Location of Laochuancha tea plant in Ya'an City. (C) Manufacturing process of MLGT. | ||
Mingshan Laochuancha green tea (MLGT) is a type of green tea, which is manufactured from Laochuancha tea leaves through fixation, rolling, and drying processes (Fig. 1). Numerous chemical components in green tea are strongly associated with its quality, such as catechins, purine alkaloids, volatile compounds, and amino acids. The contents of these compounds are variable due to different tea cultivars, growth environments (climate, soil, and altitude), harvesting seasons, and manufacturing processes.6,7 Previous studies are mainly focused on tea products manufactured from tea leaves of improved tea cultivars, and little is known regarding the Laochuancha tea products. However, as a valuable tea resource, it is necessary and scientifically significant to investigate the chemical components and quality characteristics of Laochuancha and the corresponding tea products.
Notably, the Food and Agriculture Organization reported that global consumption of tea has gradually increased, which is partly due to the increased consumer health consciousness.8 It is observed that regular consumption of tea has many potential health-promoting benefits, such as anticancer, anti-inflammatory, lipid-lowering, and cardiovascular protective effects.9–11 The prevalence of overweight and obesity has steadily increased worldwide in the past few decades. To better prevent overweight and obesity, researchers have increasingly focused on natural products with lipid-lowering activity since the available therapeutic methods for obesity treatment have a number of side effects.12
Zebrafish (Danio rerio) is vertebrate and a well-known model organism to study human disease, for their organs and tissues are similar to those of humans in terms of both structure and function.13,14 Compared to rodents, zebrafish has many advantages, such as rapid development, a short life cycle, ease of genetic manipulation, economic potential for use in breeding and testing, and transparent body during early stages of development.11,13,14 In addition, zebrafish has been reported to be an excellent model for lipid metabolism, and a useful animal model for the analysis of anti-obesity effects of natural products in a shorter time compared with rodents.14–17 Previous researches, which studied the effect of high-fat diet on the body fat accumulation in zebrafish, concluded that zebrafish is a suitable animal model in research into obesity induced by a diet rich in fat,14 as well as supported the validity of studying the effects of green tea extract in diet-induced obese zebrafish.11,14 Hence, in the present study, the chemical compositions of MLGT were investigated for the first time and its health benefit, the hypolipidemic bioactivity, was evaluated by using the diet-induced obese zebrafish. The results can lay a foundation for the popularization of MLGT and provide insights into ancient tea plants, especial of Laochuancha.
2. Materials and methods
2.1. Materials and chemicals
Fresh tea leaves of Laochuancha, of which the age is over thirty years, were manually picked from tea plantation farms located in the Anshan village, Mingshan district (geographical coordinates: 103.25° E, 30.20° N; Google map). To ensure the quality of Mingshan Laochuancha green tea (MLGT), fresh tea leaves used to manufacture MLGT were only taken a bud with a leaf and were only picked from March to April. The MLGT samples (n = 3) used in the present study were manufactured by the local tea factory, Lijia tea factory, located in Group 4, Anshan village, in March 2019, and were sampled at 10 day intervals. The production processes were conducted according to the roasted green tea processing techniques outlined in the Sichuan provincial standard DB51/T 722-2007. Briefly, fresh tea leaves of Laochuancha were firstly spread to reduce the moisture content to 68–72%; and fixed to inactivate enzymes; rolled for the first time; pan-fired to reduce the moisture content to 35–40%; re-rolled; pan-fired to reduce the moisture content to 10–12%; and final-panned to increase the aroma of green tea and lower the moisture content to 4–6%. Finished MLGT formed a tight, thin, curved strip-type appearance with white pekoe (Fig. 1). Voucher specimens of MLGT were deposited at the Key Laboratory of Food Science and Technology of Ministry of Education of Sichuan Province, Sichuan University. The dried MLGT samples were ground using a model BO-150P1 grinder (Boou Hardware Product Co. Ltd., Zhejiang, China) and were sifted through the 80 meshes per inch before chemical analysis.Gallic acid (GA), catechin (C), epicatechin (EC), epigallocatechin (EGC), epicatechin gallate (ECG), epigallocatechin gallate (EGCG), caffeine, theobromine and theophylline standards of HPLC grade and simvastatin were purchased from Sigma-Aldrich Co. (St. Louis, MO, USA). The 10 mg L−1 of multi-element standard mixture (Li, Be, Na, Mg, Al, K, Ca, V, Cr, Mn, Fe, Co, Ni, Cu, Zn, Ga, As, Se, Rb, Sr, Ag, Cd, Cs, Ba, Tl, Pb and U), internal standard mixture (In and Bi) and 1 μg L−1 of tuning solution (Ce, Co, Li, Mg, Tl and Y) were purchased from Agilent Technologies Inc. (California, USA). Amino acid standard solution and L-theanine (Thea) were obtained from membraPure GmbH (Berlin, Germany) and Shanghai Jinsui Biotechnology Co. Ltd. (Shanghai, China), respectively. Egg yolk (S30910, BR grade) was purchased from Shanghai Yuanye Biotechnology Co. Ltd. (Shanghai, China). And oil red O solution (ORO) was obtained from Beijing Solarbio Science & Technology Co. Ltd. (Beijing, China). All other chemicals and reagents used were of analytical or chromatographic grade.
2.2. Analysis of mineral elements
The inductively coupled plasma mass spectrometry (ICP-MS) was utilized for the determination of mineral elements in MLGT based on a previous report.18 All used Teflon digestion vessels and glassware were immersed in 10% HNO3 overnight and rinsed with ultrapure water beforehand. For sample preparation, 0.25 g of ground tea sample was decomposed with 5 mL of concentrated HNO3 and 1 mL of 30% H2O2 in a microwave digestion system (MARS6, CEM, USA). The digestion was conducted at 120 °C for 10 min, 160 °C for 10 min and 180 °C for 10 min, and the cooled digestion solution was diluted to 10 mL with ultrapure water and used for ICP-MS analysis (7700x ICP-MS, Agilent, USA). The operating conditions were as follows: RF generator, 1550 W and 10 MHz; reflected power, less than 20 W; argon flow rate, 10 L min−1; auxiliary gas flow rate, 1 L min−1; nebulizer gas flow rate, 1 L min−1; sample uptake rate, 0.3 rps; spray chamber, quartz, double pass and kept at 2 °C; number of replicates, 3; integration time, 0.3 s; internal standards, 115In and 209Bi. Different concentrations of certified standards were determined with the same method and content of each mineral element in tea sample was quantified through the regression curve of corresponding standard element.2.3. Analysis of volatile compounds by HS-SPME/GC-MS
The headspace solid-phase microextraction (HS-SPME) followed by gas chromatography-mass spectrometry (GC-MS) was used for the analysis of volatile compounds in MLGT. For HS-SPME, 1.0 g of ground sample was accurately weighted into a 20 mL sealed headspace vial and brewed by 5 mL of boiling water to equilibrate at 60 °C for 30 min. Next, a SPME fiber coated with 50 μm DVB/CAR/PDMS (Supelco, Sigma Aldrich, St. Louis, Mo., USA) was exposed to the headspace for 30 min at 60 °C to extract volatiles and finally thermally desorbed at 240 °C for 5 min in the GC injector. The analysis of volatiles was conducted on a Shimadzu GC-MS instrument (GCMS-QP2010 SE, Shimadzu, Japan) at following conditions: DB-5MS column (30 m × 0.25 mm × 0.25 μm); purified helium at a rate of 1.0 mL min−1; splitless injection; GC oven temperature programmed as 40 °C for 3 min, increased to 85 °C at 3 °C min−1 and maintained for 3 min, raised to 160 °C at 3 °C min−1, finally increased to 240 °C at 10 °C min−1 and held for 5 min; transfer line temperature, 280 °C; EI ionization mode; ion source temperature, 230 °C; mass scan range, 35–400 amu; ionization voltage, 70 eV. Identification of volatiles was carried out by comparison of mass spectra with the NIST14s library and their Kovats' retention indices (RI). The retention indices were obtained by injecting 1 μL of n-alkane mixture (C7 to C24, Sigma-Aldrich) under the same conditions. The relative contents of volatiles were calculated by peak area normalization, and results were expressed as the ratio of single constituent area to total area.192.4. Determination of free amino acids
A previous report was referred to extract free amino acids in MLGT with minor modifications.20 Briefly, 50 mL of boiling water was mixed with 1.0 g of ground tea sample and brewed at 100 °C for 30 min. Afterwards, cooled tea infusion was diluted to 50 mL with ultrapure water to avoid water loss, and sample solution was ready for analysis by the model A300 automatic amino analyzer (MembraPure GmbH, Germany) when filtered through a 0.22 μm PES membrane.2.5. Analysis of total phenols, flavonoids and carbohydrates
For phenols and flavonoids determination, sample preparation was conducted by mixing 1.0 g of ground tea with 20 mL of 70% (v/v) methanol and extracted at room temperature for 15 min by ultrasonic treatment.21 Tea infusion was centrifuged at 10![[thin space (1/6-em)]](https://www.rsc.org/images/entities/char_2009.gif) 000 rpm for 15 min and supernatant was used for analysis. Meanwhile, supernatant filtered through a 0.22 μm nylon membrane was used for subsequent HPLC analysis. Total content of phenols was determined with Folin-Ciocalteu method using gallic acid as a standard and expressed as GA equivalent (mg GA per g tea).22 A modified spectrophotometric method was applied to analyze the total content of flavonoids and rutin was used as a standard.23 The most widely used phenol-sulfuric method was performed for determination of carbohydrate concentration in tea infusion, prepared by extracting in boiling water for 30 min, and quantified as glucose equivalent.24
000 rpm for 15 min and supernatant was used for analysis. Meanwhile, supernatant filtered through a 0.22 μm nylon membrane was used for subsequent HPLC analysis. Total content of phenols was determined with Folin-Ciocalteu method using gallic acid as a standard and expressed as GA equivalent (mg GA per g tea).22 A modified spectrophotometric method was applied to analyze the total content of flavonoids and rutin was used as a standard.23 The most widely used phenol-sulfuric method was performed for determination of carbohydrate concentration in tea infusion, prepared by extracting in boiling water for 30 min, and quantified as glucose equivalent.24
2.6. HPLC analysis of gallic acid, catechins and purine alkaloids
The experiment was performed on a Thermo Ultimate 3000 HPLC system coupled with an Ultimate 3000 diode array detector (Thermo Fisher Scientific, USA). The chromatographic separation was performed on an Inertsil ODS-4 column (4.6 mm × 250 mm × 5 μm; GL-science Inc., Tokyo, Japan), using ultrapure water–0.1% formic acid solution (eluent A) and methanol (eluent B) as mobile phases at a flow rate of 0.8 mL min−1. The column temperature was maintained at 30 °C. Two mobile phases were programmed as follows: 0–5 min, 5–22% B; 5–20 min, 22% B; 20–35 min, 22–24% B; 35–45 min, 24–25% B; 45–50 min, 25–40% B; 50–60 min, 40–45% B. The injection volume was 10 μL. Chromeleon Chromatography Data System software 7.0 was used for instrument control, data acquisition, and data analysis. The chromatographic peaks of these nine compounds (GA, C, EC, EGC, ECG, EGCG, theobromine, theophylline, and caffeine) were confirmed by comparing their retention time and UV-Vis absorbance spectra with those of the authentic standards. Quantification of these compounds was conducted by the integration of the peak using the external standard method. Calibration curves of these nine compounds were obtained at a detection wavelength of 280 nm over different concentrations, of which the calibration curves were shown in Fig. S1 (ESI†).2.7. Experiment with electronic tongue
Before electronic tongue test, tea infusion was prepared by brewing 5.0 g of tea leaves with 250 mL of freshly boiling ultrapure water for 5 min at room temperature. Tea leaves were then filtered out and tea infusion cooled down to room temperature was used for analysis.25 A TS-5000Z taste sensor system (Intelligent Sensor Technology, Inc., Japan) was used for the measurement of electrical potential corresponding to the taste intensity of tea infusion. The system was composed of three parts: detection instrument, sensor array, and operating computer. Five types of taste sensors, including AAE (umami), CT0 (saltiness), CA0 (sourness), C00 (bitterness), and AE1 (astringency), were used and automatically conducted at 25 °C in the present study. For each sample, 80 mL of tea infusion were poured into a 120 mL beaker for detection and continued for 120 s to ensure the sensors acquired enough taste information. Meanwhile, sample aftertaste test time was continued for 30 s. The sensors were rinsed in ultrapure water to reach stable state and prepared for the detection of next sample.2.8. Hypolipidemic activity of MLGT in a zebrafish model
The water extract of MLGT was used to test for hypolipidemic activity of MLGT. Briefly, 5 g of each MLGT sample was accurately weighed and mixed, then was brewed with 1.5 L of boiling water for 30 min in a boiling water bath. The solution was filtrated and the filtrate was concentrated and freeze-dried to obtain MLGT water extract,26 of which the content of main phenolic compounds and purine alkaloids was shown in Table S1 (ESI†). All wild-type AB-line zebrafish were obtained from Sichuan University (Sichuan, China) and bred and maintained normally (temperature, 28 °C; pH 7.2–7.4; 14 h on and 10 h off light cycle). Embryos were collected by natural mating of several pairs of strong adult zebrafish and hatched in fresh fish water at 28 °C. Larvae zebrafish at 5 days post-fertilization (d.p.f) were used to evaluate the hypolipidemic activity of MLGT. Briefly, larvae at 5 d.p.f were fed with 0.1% (m/v) egg yolk as high-fat diet (HFD) for 48 h to develop hyperlipidemia model. Hyperlipidemia zebrafish were randomly divided into seven groups and treated with different concentrations of MLGT water extract (50, 100, 200, 300 μg mL−1), 0.1 μM simvastatin, 0.1% (v/v) DMSO and fresh fish water for 48 h. Meanwhile, larvae zebrafish which were kept in clean fish water all the time were set as the control group. Zebrafish were placed in the 6-well cell culture plates at a density of 15 zebrafish in 4 mL of solution per group for treatment.16,17 Finally, all zebrafish were fixed with 4% paraformaldehyde at 4 °C overnight and dehydrated by 60% isopropanol for 30 min after three washes of 1× phosphate-buffered saline (PBS). In order to compare lipid levels in different experimental groups, ORO staining was conducted. Dehydrated zebrafish were dyed by 0.3% ORO solution in dark at room temperature for 3 h and washed with 60% isopropanol three times to wipe off redundant ORO. After three washes of 1× PBS, all zebrafish were ready for microscopic observation (M205 FA, Leica, Germany), and ten zebrafish from each group were randomly selected for ORO image acquisition.16 The quantification results of lipid level correlated to microphotographs were normalized to the integral optical density (IOD) values with the Image-pro plus 6.0 software. The animal experiment was performed according to the guidelines of the Animal Care and Use Committee of Sichuan University (Chengdu, Sichuan, China) and approved by the institutional review board of the Medical Faculty at the West China Hospital, Sichuan University.2.9. Statistical analysis
The SPSS version 22.0 software (SPSS, Chicago, IL, USA) was used for statistical analysis. All results are presented as means ± standard deviations. One-way ANOVA followed by Duncan's multiple-range test was applied for multiple comparisons, and p < 0.05 indicated statistical significance.3. Results
3.1. Contents of mineral elements in MLGT
Since cultivation conditions (such as soil and environment contaminants) are closely related to tea quality and safety, the minerals and heavy metals in MLGT were analyzed. A total of 27 elements were quantified and results are listed in Table 1. Among macro-elements, K was the most abundant element of 26.58 mg g−1 followed by Mg (2.13 mg g−1), Ca (463.30 μg g−1) and Na (202.40 μg g−1). Three main micro-elements were Mn, Fe and Zn of 796.43 μg g−1, 192.57 μg g−1, and 58.12 μg g−1, respectively. It is widely accepted that As, Cd, Cr and Pb are toxic contaminants in food and control of their levels is essential to ensure food safety. According to Chinese national standards (GB 2762-2017, NY 659-2003), concentration limits of As, Cd, Cr and Pb in tea are respectively set to 2 μg g−1, 1 μg g−1, 5 μg g−1 and 5 μg g−1. Very low concentrations were found for As, Cd, Cr and Pb in MLGT, of which the contents were 0.13 μg g−1, 0.06 μg g−1, 1.17 μg g−1 and 0.94 μg g−1, respectively, and were all far below the corresponding limit values. Meanwhile, according to the concentration limit of Cu in National Agriculture Industry Standard for Green Food-Tea (NY/T 288-2018), it was found that the content of Cu in MLGT was below the limit value of 30 μg g−1. The results revealed the good quality and safety of MLGT in view of toxic elements.| Elements | Arb | Contentsa (μg g−1) |
|---|---|---|
| a All data were expressed as mean ± SD (n = 3) and on a basis of dry weight of tea leaves.b Ar, relative atomic mass of element.c The unit was mg g−1. | ||
| Li | 7 | 0.22 ± 0.03 |
| Be | 9 | 0.02 ± 0.00 |
| Na | 23 | 202.40 ± 19.02 |
| Mg | 24 | 2.13 ± 0.08c |
| Al | 27 | 365.49 ± 11.98 |
| K | 39 | 26.58 ± 0.97c |
| Ca | 44 | 463.30 ± 13.00 |
| V | 51 | 0.24 ± 0.01 |
| Cr | 52 | 1.17 ± 0.15 |
| Mn | 55 | 796.43 ± 30.60 |
| Fe | 56 | 192.57 ± 3.09 |
| Co | 59 | 0.53 ± 0.02 |
| Ni | 60 | 10.27 ± 0.49 |
| Cu | 63 | 29.66 ± 0.78 |
| Zn | 66 | 58.12 ± 1.64 |
| Ga | 69 | 2.29 ± 0.16 |
| As | 75 | 0.13 ± 0.02 |
| Se | 78 | 0.08 ± 0.01 |
| Rb | 85 | 59.36 ± 5.24 |
| Sr | 88 | 4.33 ± 0.16 |
| Ag | 107 | 0.01 ± 0.00 |
| Cd | 111 | 0.06 ± 0.00 |
| Cs | 133 | 0.17 ± 0.00 |
| Ba | 137 | 10.69 ± 0.29 |
| Tl | 205 | 0.03 ± 0.00 |
| Pb | 208 | 0.94 ± 0.03 |
| U | 238 | 0.01 ± 0.00 |
3.2. Volatile compounds in MLGT
Volatile compounds in MLGT were analyzed by widely used HS-SPME/GC-MS method, and total ion chromatogram (TIC) is presented in Fig. 2A. A total of 74 volatile compounds were detected and their relative percentage contents (%) are summarized in Table S2.† Among these identified components, alcohols (55.65%), unsaturated hydrocarbons (13.20%), and aldehydes (9.82%) were the major volatile compounds, which are showed in Fig. 2B. The most abundant alcohols were linalool (floral, lavender-like),27–29 geraniol (floral, rosy),28–30 hotrienol (hyacinth-like),29 octanol (chemical, metal, burnt),28,29 and linalool oxides (floral),28,29 of which the contents were 20.03%, 9.34%, 5.63%, 4.51%, and 6.14%, respectively (Fig. 2C). There were 19 unsaturated hydrocarbons, where the D-limonene (fruity, citrus-like, mint-like)27,29 and germacrene D (woody, spicy)29 were the main components. The abundance of D-limonene (5.49%) and germacrene D (2.04%) endowed MLGT with characteristic lemon-like and woody aroma. By contrast, a total of 13 saturated hydrocarbons were identified, and patchoulane and 4-methyldecane were the most abundant volatiles (Fig. 2D). As shown in Fig. 2E, the 1-ethyl-2-formylpyrrole (tea pyrrole) with characteristic odor of green tea was particularly identified in MLGT, of which the content was 1.70%. Two main ketones were observed to be 4-methyl-3-penten-2-one (sweet, chemical)29 and sulcatone (pepper-like, mushroom)29 of 4.31% and 2.78%, respectively. In addition, nonanal (3.20%), heptanal (2.88%), and safranal (1.10%) were identified as main aldehydes in MLGT sample.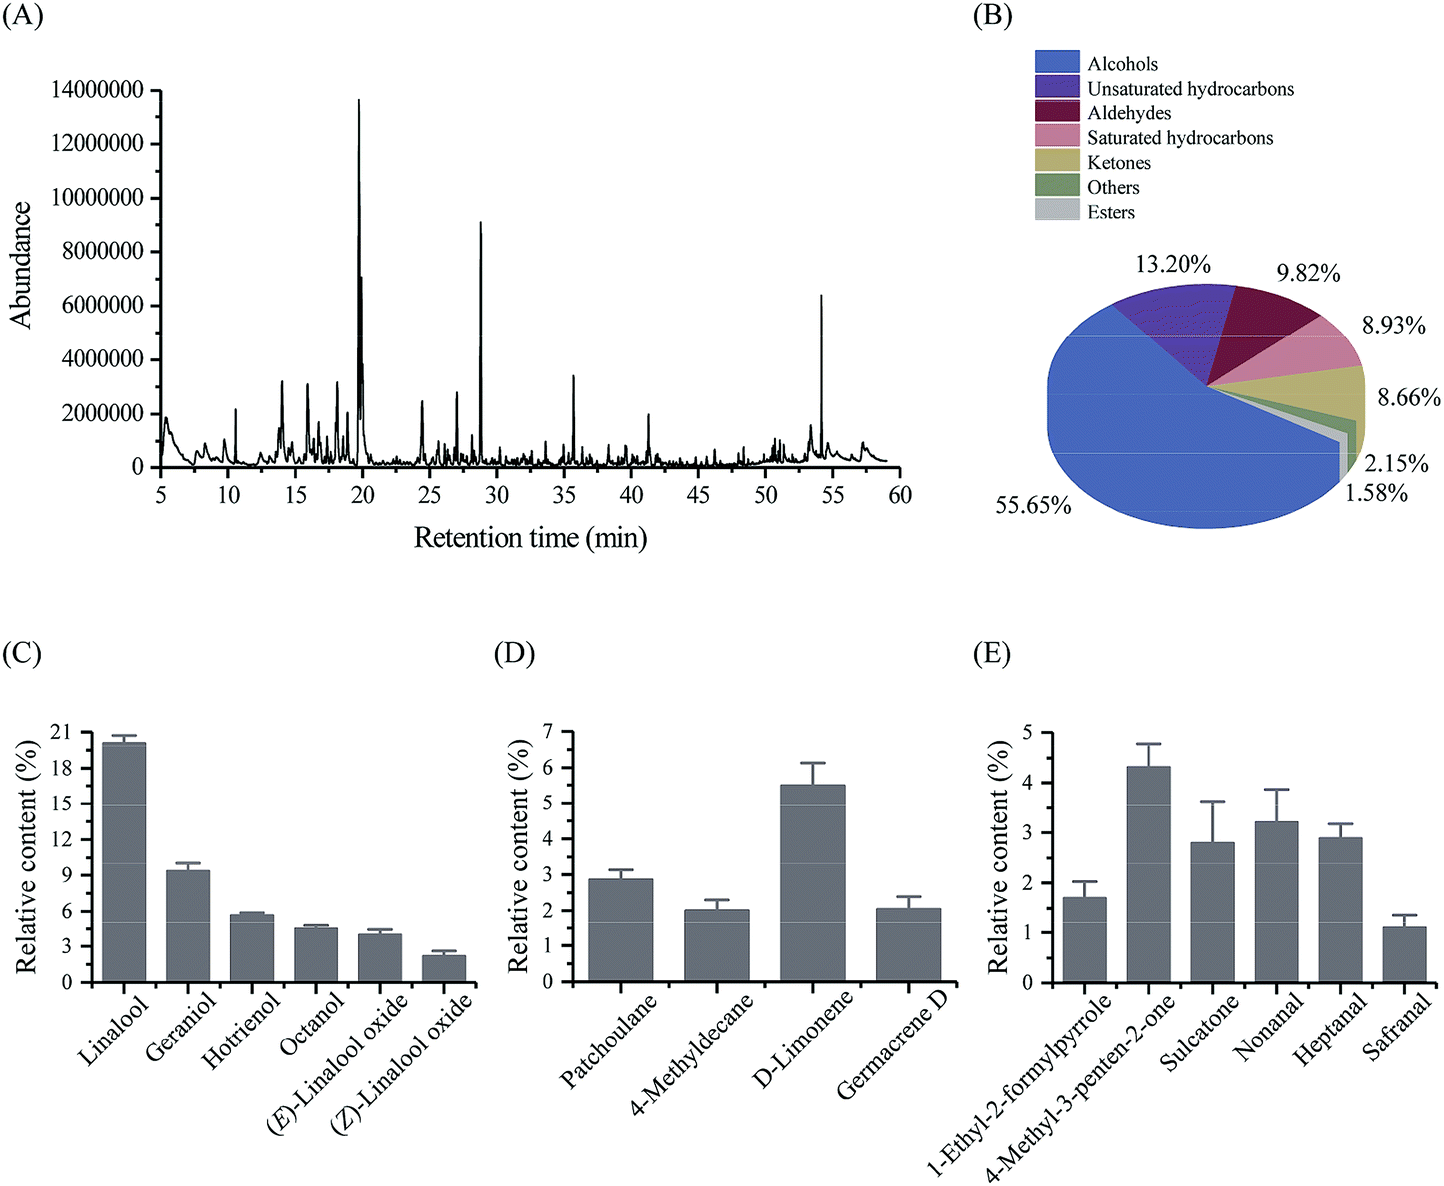 | ||
| Fig. 2 Analysis of volatile compounds in Mingshan Laochuancha green tea by HS-SPME/GC-MS (n = 3). (A) Total ion chromatogram of tea sample. (B) Different types of volatile compounds and their contents. (C) Top six volatiles belonging to alcohols. (D) Main hydrocarbons with content more than 1.0%. (E) A specific volatile compound (1-ethyl-2-formylpyrrole) and main ketones and aldehydes with content more than 1.0% in tea sample. | ||
3.3. Contents of amino acids
Generally, the unique umami taste of green tea is mainly due to the amino acids. As summarized in Table 2, a total of 21 amino acids, including 8 essential amino acids, 11 non-essential amino acids, and 2 non-protein amino acids, were detected. Total content of free amino acids in MLGT was 28.61 mg g−1, where the total contents of essential amino acids and non-essential amino acids were 4.00 mg g−1 and 12.29 mg g−1, respectively. Thea was the most abundant amino acid, of which the content was 12.11 mg g−1, accounting for 42.33% of total amino acids. However, the content of GABA was 205.95 μg g−1. It was found that Glu, Asp, Asn, and Arg were relatively abundant and their contents were 3.27 mg g−1, 3.12 mg g−1, 2.24 mg g−1, and 1.59 mg g−1, respectively. According to previous reports, Ala, Gly, Pro, Ser, Orn and Thr are sweet-tasting amino acids, while Leu, Phe, Tyr, Ile, Val and Trp are bitter-tasting compounds. GABA and Thea are compounds imparting mouth-drying sensation and velvety-like astringency, whereas Asp and Glu are mainly responsible for umami taste of tea.31,32 Total content of sweet-tasting amino acids was 1.85 mg g−1, which accounted for 6.48% of total amino acids, while content of bitter-tasting amino acids was 3.25 mg g−1 and accounted for 11.36%. The proportions of amino acids with velvety-like astringency and umami taste in total amino acids were 43.05% (12.32 mg g−1) and 22.34% (6.39 mg g−1), respectively. Taken together, high content of amino acids and abundance of flavor amino acids endowed MLGT with characteristic velvety-like and umami taste.| No. | AAsb | Contentsa (μg g−1) | Types |
|---|---|---|---|
| a All data were expressed as mean ± SD (n = 3) and on a basis of dry weight of tea leaves.b AAs, amino acids.c TEAA, total content of essential amino acids.d TNEAAs, total content of non-essential amino acids.e The unit was mg g−1. | |||
| 1 | Phe | 982.08 ± 19.77 | Essential AAs |
| 2 | Leu | 640.68 ± 10.05 | |
| 3 | Lys | 601.86 ± 11.09 | |
| 4 | Val | 569.70 ± 17.72 | |
| 5 | Thr | 503.28 ± 7.13 | |
| 6 | Ile | 417.02 ± 7.29 | |
| 7 | Trp | 267.11 ± 7.73 | |
| 8 | Met | 19.97 ± 1.27 | |
| TEAAsc | 4.00 ± 0.05e | ||
| 9 | Glu | 3.27 ± 0.13e | Non-essential AAs |
| 10 | Asp | 3.12 ± 0.04e | |
| 11 | Asn | 2.24 ± 0.08e | |
| 12 | Arg | 1.59 ± 0.03e | |
| 13 | Ser | 631.33 ± 10.69 | |
| 14 | Pro | 436.79 ± 12.81 | |
| 15 | Tyr | 373.16 ± 7.05 | |
| 16 | Ala | 226.73 ± 4.92 | |
| 17 | His | 219.39 ± 7.96 | |
| 18 | Cys | 128.39 ± 10.57 | |
| 19 | Gly | 55.89 ± 8.06 | |
| TNEAAsd | 12.29 ± 0.22e | ||
| 20 | Thea | 12.11 ± 0.21e | Non-protein AAs |
| 21 | GABA | 205.95 ± 9.39 | |
| Total | 28.61 ± 0.40e | ||
3.4. Contents of phenols, flavonoids, carbohydrates, gallic acid, catechins and purine alkaloids
The physiological and pharmacological activities and quality characteristics of teas are found to be closely associated with their chemical constituents, such as catechins, caffeine, polyphenols/flavonoids, carbohydrates, and amino acids.33 The total contents of phenols, flavonoids, and carbohydrates in MLGT were 188.41 mg g−1, 168.09 mg g−1, and 57.53 mg g−1, respectively. Five main catechins, three purine alkaloids and gallic acid were effectively separated and detected in tea samples (Fig. S2, ESI†). As shown in Fig. 3, catechins and purine alkaloids were abundant in MLGT, of which the total contents were 132.50 mg g−1 and 39.32 mg g−1, respectively. Among five catechins, EGCG had the highest content of 85.82 mg g−1 whereas contents of C, EGC, EC, and ECG were all comparatively lower. It was observed that contents of C, EGC, EC, and ECG were 1.96 mg g−1, 4.45 mg g−1, 9.66 mg g−1, and 30.60 mg g−1, respectively. The results indicated that gallated catechins were much more abundant that non-gallated catechins. In addition, the content of GA was 8.37 mg g−1. It has been reported that theobromine, theophylline, and caffeine are three predominant purine alkaloids in tea. Caffeine was found to be the most abundant alkaloid in MLGT, of which the content was 33.78 mg g−1. By contrast, theobromine and theophylline possessed relatively lower contents of 1.69 mg g−1 and 3.84 mg g−1, respectively.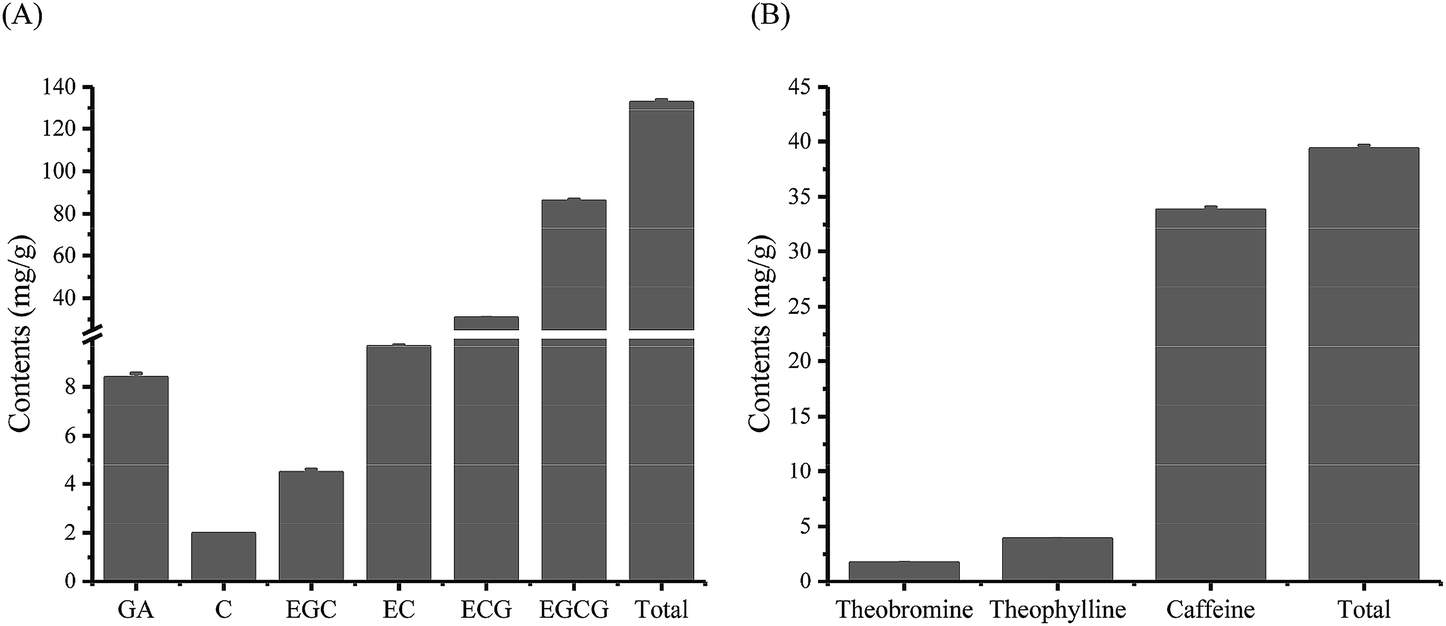 | ||
| Fig. 3 Contents of gallic acid and five main catechins (A) and three purine alkaloids (B) in Mingshan Laochuancha green tea (n = 3). In (A) total represents the total content of C, EGC, EC, ECG, and EGCG. | ||
3.5. Taste information of tea collected by electronic tongue
Taste characteristics of MLGT were detected using electronic tongue. Experimental data of different taste indicators, including sourness, bitterness, astringency, umami, richness, saltiness, aftertaste of bitterness, and aftertaste of astringency were presented in Fig. 4 and Table S3.† Interpretively, data of all taste indicators were obtained using reference solution as standard, and richness indicator shows the persistence of umami. It was found that values of sourness, bitterness and astringency were all less than those of reference solution. Therefore, it indicated that sourness, bitterness and astringency were not tasted in tea solution. In contrast, values of aftertaste of bitterness, aftertaste of astringency, umami, richness, and saltiness were greater than those of reference solution. Especially, values of umami, richness, and saltiness were observed at a higher degree. The results showed that MLGT had strong umami taste but little astringent and bitter taste.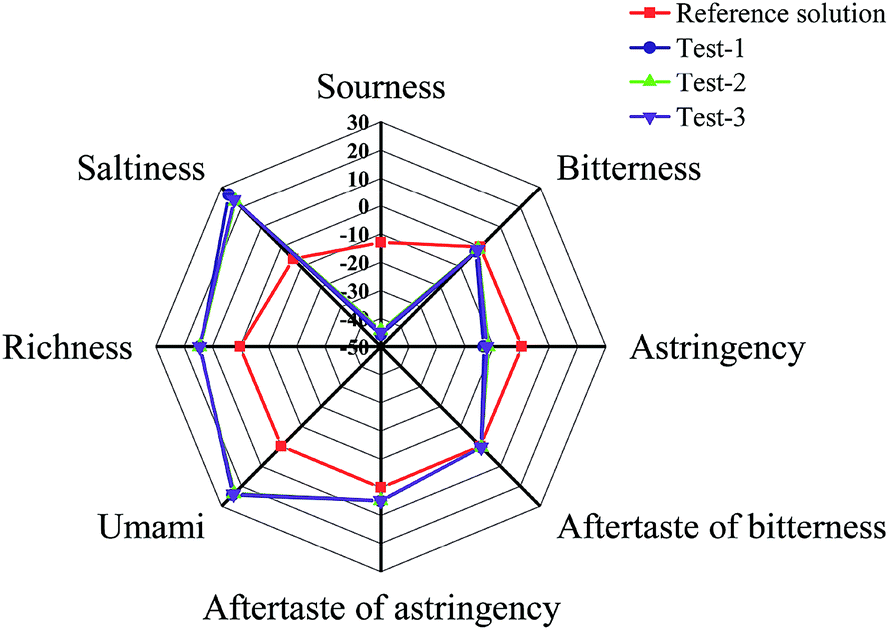 | ||
| Fig. 4 Different taste data of Mingshan Laochuancha green tea detected by electronic tongue. Reference solution compositions: 30 mmol L−1 KCl and 0.3 mmol L−1 tartaric acid. Test-1, test-2 and test-3 were three parallel tests of green tea water solution. | ||
3.6. Hypolipidemic activity of MLGT in high-fat zebrafish
To evaluate the hypolipidemic activity of MLGT, high-fat zebrafish were exposed to different concentrations of MLGT water extract. As shown in Fig. 5, lipids in gut and blood vessels were abundant in HFD zebrafish compared with control zebrafish, which were not treated with high-fat diet. Correspondingly, lipid content in HFD zebrafish, which was quantified as 100%, was significantly higher than that in control group (2.70%). It was observed that MLGT significantly lowered the lipid level of HFD zebrafish. After 48 hour treatment, MLGT reduced lipid levels to 78.14%, 62.19%, 43.06%, and 46.39% of HFD group at concentrations of 50 μg mL−1, 100 μg mL−1, 200 μg mL−1, and 300 μg mL−1, respectively. The water extract at 200 μg mL−1 showed the most potent hypolipidemic activity. Simvastatin, an HMG-CoA reductase inhibitor, is commonly used as an effective hypolipidemic drug in clinical treatment. In the present study, simvastatin was selected as a comparative agent. It was observed that simvastatin reduced the lipid level to 41.89% of HFD group at 0.1 μM. Intriguingly, the hypolipidemic activities of MLGT water extract at 200 μg mL−1 and 300 μg mL−1 were comparable with that of 0.1 μM simvastatin. By contrast, DMSO, which was used to dissolve simvastatin, was observed to have no effect on lipid content at final concentration of 0.1% (v/v). The results indicated that MLGT had strong hypolipidemic bioactivity.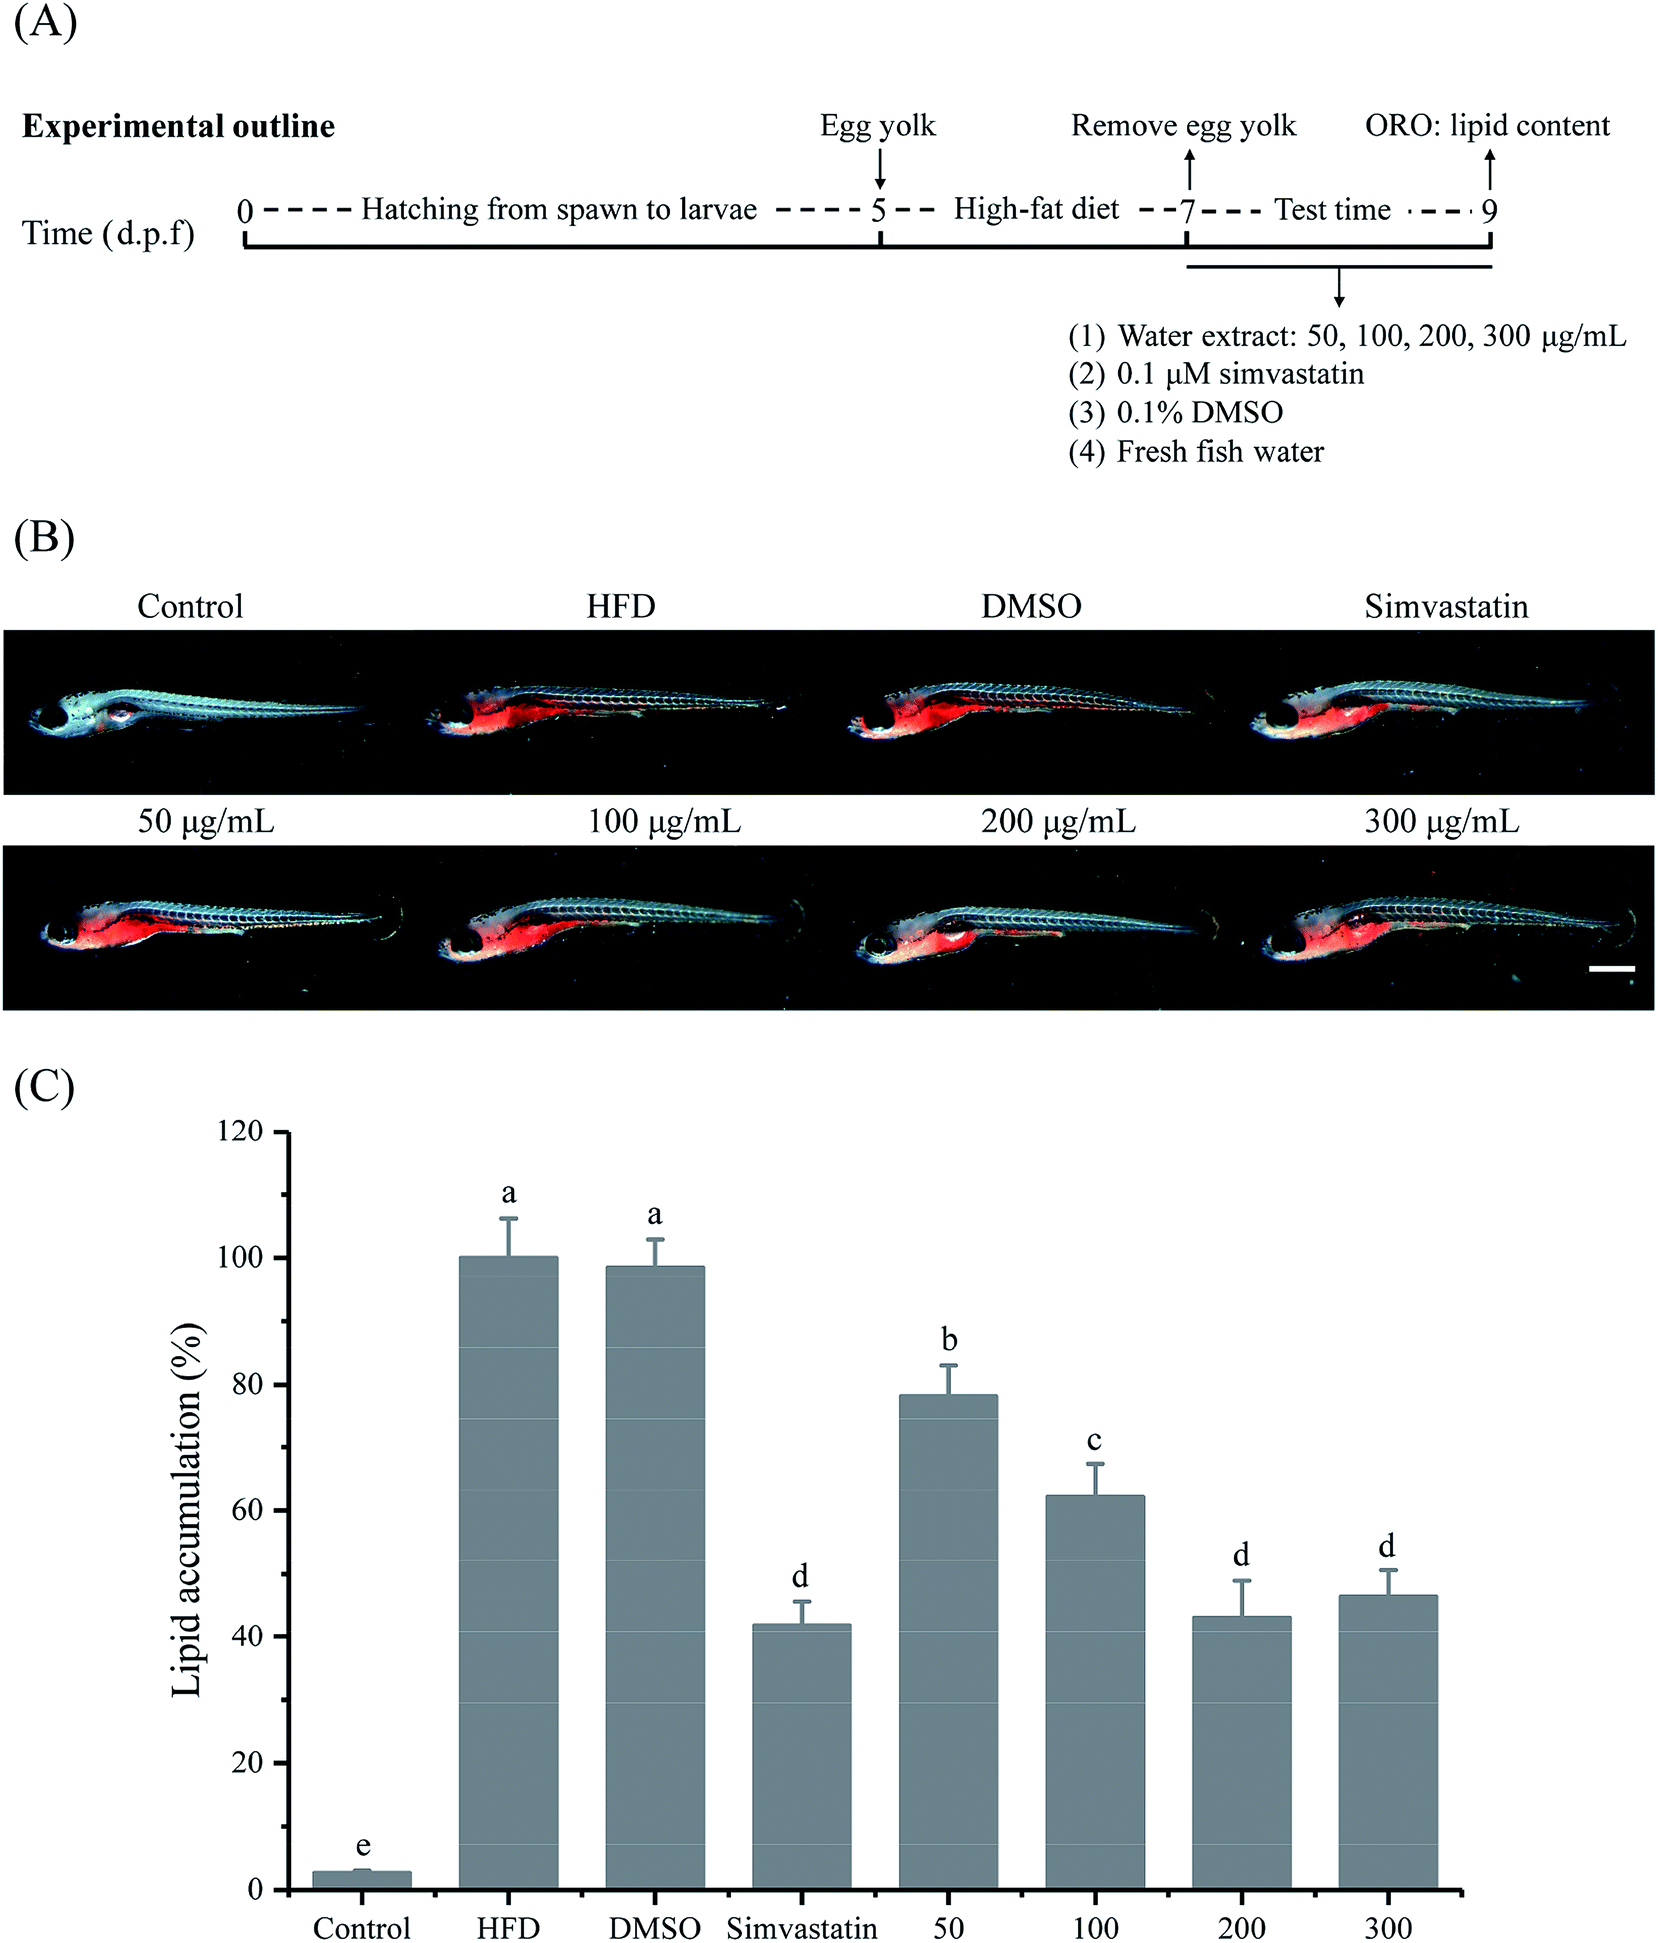 | ||
| Fig. 5 Hypolipidemic activity of Mingshan Laochuancha green tea in high-fat induced zebrafish. (A) Experimental outline of zebrafish model. (B) Zebrafish stained with oil red O and visualized under a microscope. (C) Relative lipid accumulation quantified with Image-pro plus software, and different lowercases showed significant difference at p < 0.05 (n = 10). HFD, high-fat diet zebrafish. DMSO, vehicle control at 0.1% (v/v). Simvastatin, positive control at 0.1 μM. Concentrations of MLGT water extract were set at 50, 100, 200, and 300 μg mL−1, respectively. Scale bar, 500 μm. | ||
4. Discussion
Nowadays, green tea is consumed by more and more people and the health benefits are partly attributed to its popularization. Since most of these consumed teas are produced by improved tea cultivars, few studies were focused on ancient tea plants and corresponding tea products. In this study, a special green tea manufactured by Laochuancha tea leaves was systematically studied. Mineral elements in teas have been reported in a number of papers, aiming to investigate the safety and distinction of different tea varieties and geographical origins.2,34–37 Individual and combined metal exposure can generate obvious harm to human health, such as cancers, mental retardation, behavioral abnormalities, low fertility and altered metabolism. Moreover, the ability to generate reactive oxygen species (ROS), depletion of glutathione and bonding to sulfhydryl groups of toxic metals are reported to be the main mechanisms underlying their toxicities to biological systems.38 Toxic As, Cd, Cr and Pb elements in MLGT were all below the concentration limits of Chinese national standards, showing the safety of MLGT with respect to health hazards of heavy metals. Brzezicha-Cirocka et al. monitored 41 types of green tea from India, Japan and China, and found that Cd ranged from 0.03 μg g−1 to 0.1 μg g−1, Cr ranged from 0.3 μg g−1 to 3.4 μg g−1, and Pb ranged from 0.09 μg g−1 to 15.0 μg g−1.34 Moreover, elements Cd and Pb were too low to be detected in five different tea clones of C. assamica variety,1 and As, Cd, Cr and Pb were all at low concentrations in tea leaves from Guizhou province.2 In addition, Troisi et al. estimated the average daily intake of metals and indicated no risk of non-cancerous health effects of tea consumption.37 From these reports, it is suggested that Mingshan Laochuancha green tea is safe to drink. It is interesting to note that K was the richest element in previous reported teas. The specific incorporation within a binding ligand of tea leaves,35 tea pruning and addition of K fertilizers to the soils,1 might attribute to the high concentration of K. Additional, accumulating evidences have shown that green tea might be a rich source and accumulator of Mn,2,34 and this might be a reason for high content of Mn in MLGT.Volatile compounds contribute significantly to the tea aroma, which is one of the most important sensory properties, and has great influence on the quality and consumer acceptance of tea. An ample amount of studies have showed that tea aroma is influenced by many factors, such as tea cultivars, processing methods, tea types, geographical origins, and quality grades.27,39–41 It is commonly accepted that chestnut-like aroma is not only the typical aroma characteristic of some famous Chinese green teas, but also regarded as an important indicator of excellent-quality green teas.27 Currently, gas chromatography-olfactometry (GC-O) and odor activity value (OAV) are extensively combined to investigate and identify key aroma-active compounds in teas.27,42 According to GC-O and OAV results, heptanal, benzaldehyde, linalool, and β-ionone are reported to be the most definite odorants attributed to the chestnut-like aroma of green tea,27 which were predominantly identified in MLGT. In addition, other volatiles, such as hexanal, octanal, benzene acetaldehyde, nonanal, decanal, β-cyclocitral, (E)-2-nonenal, D-limonene, α-cubebene, and linalool oxides, regarded as aroma-active compounds responsible for chestnut-like aroma, were also identified in MLGT. High content of volatile compounds with chestnut-like aroma in MLGT indicated its good quality in terms of tea aroma. Fresh tea leaves only contain a little amount of aroma compounds in free form, and most aroma molecules in finished teas are formed during processing.39 Volatile compounds stored in glycoside-bonded form in tea leaves can be hydrolyzed either enzymatically (glycosidase) or non-enzymatically (thermal treatment). Many alcoholic volatiles are mainly found in tea leaves as glycoside-bonded molecules, which are reported to be hydrolyzed during withering and rolling stages to alcoholic volatiles in free form, such as linalool, (Z)-3-hexenol, geraniol, and linalool oxides,30 and this might be attributed to the abundance of alcohols in MLGT. It has been concluded that major aroma molecules are generated from their precursors, which are mainly divided into carotenoids, lipids, glycosides, and amino acids/carbohydrates. A lot of volatile compounds in green tea are generated from fatty acids (34%) and amino acids/carbohydrates (29%), during oxidation/degradation of fatty acids and Maillard reactions, respectively.39
It has been demonstrated that price and quality of tea are closely correlated with its contents of total nitrogen, free amino acids and theanine.33,43 Previous studies reported that total contents of amino acids in different green teas are ranged from 8370 μg g−1 to 46800 μg g−1,33,44 and are mostly fluctuated around the average content of 26890 μg g−1.44 It was observed that total content of amino acid in MLGT was comparatively abundant by comparison with reported results. In addition to Thea, Glu (830–3300 μg g−1), Asp (770–4940 μg g−1), Asn (140–8820 μg g−1), and Arg (120–3080 μg g−1) have been reported to be abundant in green teas.33,43 These types of amino acids are similarly detected in MLGT, of which the contents are relatively high in contrast to previous reports. Thea has generally recognized to be safe by Food and Drug Administration, and used as a dietary supplement for its health-promoting benefits, such as neuroprotective, relaxing, immune system-modulated, and antitumor effects.9,45 Content of Thea in MLGT is consistent with reported studies, which indicate that Thea constitutes between 0.2% and 2% of tea dry weight and accounts for approximately 50% of total amino acids.9,33 GABA is an important inhibitory neurotransmitter in the mammalian central nervous system with various physiological functions, of which the contents are changed in different green tea samples. In the report of Zhao et al., contents of GABA in green teas from different areas are ranged from 39 μg g−1 to 401 μg g−1 (mean content: 182 μg g−1),46 whereas its contents are below 105.40 μg g−1 in another report.47 Compared with the reported results, GABA in MLGT was relatively abundant of 205.95 μg g−1. Taken together, the abundance of amino acids, especially Thea, GABA, Glu and Asp, imparts MLGT with velvety-like and umami taste, and this might be a main reason illustrating that MLGT tastes better compared with improved tea cultivars. The results were consistent with electronic tongue data, showing MLGT had strong umami taste. High concentration of polyphenols, especially catechins, makes tea infusion strongly bitter and astringent, and is negatively related to the quality of green tea.44 However, it was observed that bitterness and astringency were not tasted in MLGT tea solution, and only little aftertaste of astringency and bitterness was tasted by electronic tongue, while a high content of total phenols was determined in MLGT. The finding might be explained by the low ratio of polyphenols to total amino acids (PP/AA) in MLGT (PP/AA = 6.59), which is considered as an index reflecting the balance of free amino acids and polyphenols, two key components contributing to mellowness and astringency of green tea, respectively.44 As Wang and Ruan reported, green teas with high total quality score had lower ratios of PP/AA ranged from 5.53 to 8.11.44 Therefore, it was suggested that high content of amino acids and low ratio of PP/AA might be mainly attributed to the strong umami and velvety-like taste but little astringent and bitter taste of MLGT infusion.
There is no doubt that the health-promoting benefits of tea are closely related to its functional components, such as polyphenols, purine alkaloids, amino acids, and polysaccharides.12,45,48 Prior studies have demonstrated that the health effects of green tea are mainly attributed to polyphenols, especially the catechins, of which the content is the highest in polyphenolic compounds.11,49 It was observed that total content of C, EGC, EC, ECG, and EGCG was 132.50 mg g−1 in MLGT, which is much higher than that in the report of Zhang et al. (56.92 mg g−1),50 and the report of Yi et al. (99.26 mg g−1).51 Although there are some differences in the total content of these five major catechins, EGCG is observed to be the most abundant catechin. Therefore, we assume that the potent hypolipidemic activity of MLGT might be a result of its abundant catechins, especially EGCG. Previous studies have shown that green tea can significantly decrease the body weight of diet-induced obesity (DIO) animals and suppress their body and visceral fat accumulation.10,11 The underlying mechanisms are suggested to be related to the significantly increased expression of lipid metabolism genes (ACOX1, ACADM, and PPARA) in liver and suppressed expression of adipose SOCS3 by green tea extract in DIO zebrafish.11 In addition, it has been observed that green tea can increase the AMPK phosphorylation and decrease the fatty acid synthase level and its mRNA expression in rats.10 Excessive dietary fat intake is associated with increased risk of overweight and obesity, which can result in numerous chronic diseases, such as cardiovascular diseases, diabetes, and certain types of cancer. Therefore, effective control of dietary fat intake and absorption is considered to be a way to prevent obesity and relevant diseases, and regulation of cholesterol absorption has been increasingly studied nowadays, aiming to lower blood cholesterol levels.52 EGCG has been reported to significantly reduce the cholesterol absorption by 21% and intestinal fat absorption by 3%, as well as increase their fecal excretion in rats. Meanwhile, micellar solubility of cholesterol is gradually decreased with increasing EGCG concentrations. Therefore, cholesterol-lowering activity of EGCG, the most abundant catechin in green tea, is suggested to be due to the inhibition of intestinal cholesterol absorption by reducing micellar solubilization of cholesterol.53 Similarly, in the report of Bose et al., 16 week EGCG treatment has significantly decreased body weight and visceral fat weight whereas the fecal lipids are increased. Meanwhile, EGCG attenuates insulin resistance, plasma cholesterol, and monocyte chemoattractant protein concentrations in high-fat mice, and also decreases liver weight, triglycerides, and plasma alanine aminotransferase concentrations.49 These reports indicate that green tea and EGCG are effective in lowering lipid levels, and the results are consistent with the observed hypolipidemic activity of MLGT. By contrast, Liu et al., who have studied the anorexigenic and anti-obesity effects of EGCG, caffeine, and their combinations in mice, find that body weight of all experimental mice is significantly decreased compared with control group. However, EGCG single treatment has no effect on food intake since caffeine single treatment or combinations of EGCG and caffeine have dramatically suppressed food intake. Especially, combination of 0.1% EGCG and 0.1% caffeine has the most remarkable suppression of body weight, fat accumulation, and anorexigenic effects, which are suggested to be due to the suppression of gastral actions by GLP-1 and upregulation of POMC in the hypothalamic appetite center.48 Taken together, we hypothesize that abundant EGCG and caffeine in MLGT contribute to its potent lipid-lowering effect. However, the detailed underlying mechanisms of hypolipidemic bioactivity of MLGT need further investigations.
5. Conclusions
In this study, chemical compositions and hypolipidemic bioactivity of a special Mingshan Laochuancha green tea were systematically investigated for the first time. It is observed that macro-elements, K, Mg, Ca, and Na, are abundant in MLGT, while main micro-elements are Mn, Fe, and Zn. Contents of four toxic elements, As, Cd, Cr, and Pb, are all below the concentration limits, certifying the safety of MLGT. Among identified volatiles, alcohols, unsaturated hydrocarbons and aldehydes are abundant. Compounds with chestnut-like aroma, such as heptanal, benzaldehyde, linalool, linalool oxides, β-ionone, and D-limonene, are predominantly identified in MLGT. Analyses of amino acids and electronic tongue illustrate that MLGT has strong umami and velvety-like taste but little astringent and bitter taste, which might result from high contents of free amino acids, especially the Thea, Asp, Glu, and GABA. In addition, MLGT has significantly inhibited the fat accumulation in high-fat induced zebrafish, and showed the most effective hypolipidemic activity at 200 μg mL−1, which might be due to abundant catechins and purine alkaloids in MLGT, especially EGCG and caffeine.Conflicts of interest
The authors declare no conflict of interest currently.Acknowledgements
This work was supported by grants from the National Natural Science Foundation of China (No. 31701574).Notes and references
- M. Yemane, B. S. Chandravanshi and T. Wondimu, Food Chem., 2008, 107, 1236–1243 CAS.
- J. Zhang, R. Yang, R. Chen, Y. C. Li, Y. Peng and C. Liu, Molecules, 2018, 23, 3013 CrossRef PubMed.
- J. D. Kottawa-Arachchi, M. T. K. Gunasekare and M. A. B. Ranatunga, Genet. Resour. Crop Evol., 2019, 66, 259–273 CrossRef CAS.
- L. Chen, Z.-X. Zhou and Y.-J. Yang, Euphytica, 2007, 154, 239–248 CrossRef CAS.
- X.-p. Luo, F.-s. Wang and D.-w. Luo, West China, 2017, 7, 12–14 Search PubMed.
- H. Jiang, F. Yu, L. Qin, N. Zhang, Q. Cao, W. Schwab, D. Li and C. Song, J. Food Compos. Anal., 2019, 77, 28–38 CrossRef CAS.
- H. Su, W. Wu, X. Wan and J. Ning, Food Sci. Nutr., 2019, 7, 2167–2175 CrossRef CAS PubMed.
- F. a. A. Organization, available online at http://www.fao.org/economic/est/est-commodities/tea/tea-meetings/tea23/en/, 2018.
- R. Cooper, Int. J. Food Sci. Nutr., 2012, 63, 90–97 CrossRef CAS PubMed.
- H. C. Huang and J. K. Lin, Food Funct., 2012, 3, 170–177 RSC.
- T. Tainaka, Y. Shimada, J. Kuroyanagi, Y. Nishimura, S. Meguro, Y. Takema and T. Tanaka, Nutr. Metab., 2012, 9, 73 CrossRef PubMed.
- Y. Xu, M. Zhang, T. Wu, S. D. Dai, J. L. Xu and Z. K. Zhou, Food Funct., 2015, 6, 297–304 Search PubMed.
- M. J. den Broeder, M. J. B. Moester, J. H. Kamstra, P. H. Cenijn, V. Davidoiu, L. M. Kamminga, F. Ariese, J. F. de Boer and J. Legler, Int. J. Mol. Sci., 2017, 18, 894 CrossRef PubMed.
- S. Meguro, T. Hasumura and T. Hase, PLoS One, 2015, 10, e0120142 CrossRef PubMed.
- T. Tainaka, Y. Shimada, J. Kuroyanagi, L. Q. Zang, T. Oka, Y. Nishimura, N. Nishimura and T. Tanaka, Nutr. Metab., 2011, 8, 88 CrossRef CAS PubMed.
- J. Zhou, Y.-Q. Xu, S.-Y. Guo and C.-Q. Li, J. Pharmacol. Toxicol. Methods, 2015, 72, 47–52 CrossRef CAS PubMed.
- H. Wei, S. Yue, S. Z. Zhang and L. Lu, Polymers, 2018, 10, 492 CrossRef PubMed.
- M.-Y. Li, Y. Xiao, K. Zhong, J.-R. Bai, Y.-P. Wu, J.-Q. Zhang and H. Gao, Int. J. Food Prop., 2019, 22, 878–889 CrossRef CAS.
- S. Lv, Y. Wu, C. Li, Y. Xu, L. Liu and Q. Meng, J. Agric. Food Chem., 2014, 62, 1810–1818 CrossRef CAS PubMed.
- Y. Zhu, Y. Luo, P. Wang, M. Zhao, L. Li, X. Hu and F. Chen, Food Chem., 2016, 194, 643–649 CrossRef CAS PubMed.
- Z. Xin, S. Ma, D. Ren, W. Liu, B. Han, Y. Zhang, J. Xiao, L. Yi and B. Deng, Food Chem., 2018, 266, 534–544 CrossRef CAS PubMed.
- Y. S. Velioglu, G. Mazza, L. Gao and B. D. Oomah, J. Agric. Food Chem., 1998, 46, 4113–4117 CrossRef CAS.
- A. A. L. Ordoñez, J. D. Gomez, M. A. Vattuone and M. I. Isla, Food Chem., 2006, 97, 452–458 CrossRef.
- M. DuBois, K. A. Gilles, J. K. Hamilton, P. A. Rebers and F. Smith, Anal. Chem., 1956, 28, 350–356 CrossRef CAS.
- M. Xu, J. Wang and L. Zhu, Food Chem., 2019, 289, 482–489 CrossRef CAS PubMed.
- G. Chen, M. Xie, Z. Dai, P. Wan, H. Ye, X. Zeng and Y. Sun, Mol. Nutr. Food Res., 2018, 62, 1700485 CrossRef PubMed.
- Y. Zhu, H.-P. Lv, C.-Y. Shao, S. Kang, Y. Zhang, L. Guo, W.-D. Dai, J.-F. Tan, Q.-H. Peng and Z. Lin, Food Res. Int., 2018, 108, 74–82 CrossRef CAS PubMed.
- Z. Xiao, H. Wang, Y. Niu, Q. Liu, J. Zhu, H. Chen and N. Ma, Flavour Fragrance J., 2017, 32, 265–276 CrossRef CAS.
- T. Acree and H. Arn, available online at http://www.flavornet.org/index.html.
- Z. Yang, S. Baldermann and N. Watanabe, Food Res. Int., 2013, 53, 585–599 CrossRef CAS.
- S. Scharbert and T. Hofmann, J. Agric. Food Chem., 2005, 53, 5377–5384 CrossRef CAS PubMed.
- J. Solms, J. Agric. Food Chem., 1969, 17, 686–688 CrossRef CAS.
- R. Horanni and U. H. Engelhardt, J. Food Compos. Anal., 2013, 31, 94–100 CrossRef CAS.
- J. Brzezicha-Cirocka, M. Grembecka and P. Szefer, Environ. Monit. Assess., 2016, 188, 183 CrossRef PubMed.
- A. Kumar, A. G. C. Nair, A. V. R. Reddy and A. N. Garg, Food Chem., 2005, 89, 441–448 CrossRef CAS.
- P. L. Fernández-Cáceres, M. J. Martín, F. Pablos and A. G. González, J. Agric. Food Chem., 2001, 49, 4775–4779 CrossRef PubMed.
- J. Troisi, S. Richards, S. Symes, V. Ferretti, A. Di Maio, A. Amoresano, B. Daniele, F. Aliberti, M. Guida, M. Trifuoggi and O. De Castro, Food Chem., 2019, 288, 193–200 CrossRef CAS PubMed.
- X. Wu, S. J. Cobbina, G. Mao, H. Xu, Z. Zhang and L. Yang, Environ. Sci. Pollut. Res., 2016, 23, 8244–8259 CrossRef CAS PubMed.
- Z. Feng, Y. Li, M. Li, Y. Wang, L. Zhang, X. Wan and X. Yang, Food Chem., 2019, 285, 347–354 CrossRef CAS PubMed.
- W. He, X. Hu, L. Zhao, X. Liao, Y. Zhang, M. Zhang and J. Wu, Food Res. Int., 2009, 42, 1462–1467 CrossRef.
- H. R. Tan, H. Lau, S. Q. Liu, L. P. Tan, S. Sakumoto, B. Lassabliere, K.-C. Leong, J. Sun and B. Yu, LWT--Food Sci. Technol., 2019, 108, 221–232 CrossRef CAS.
- X. Gong, Y. Han, J. Zhu, L. Hong, D. Zhu, J. Liu, X. Zhang, Y. Niu and Z. Xiao, Int. J. Food Prop., 2017, 20, S1107–S1121 CrossRef CAS.
- A. Alcázar, O. Ballesteros, J. M. Jurado, F. Pablos, M. J. Martín, J. L. Vilches and A. Navalón, J. Agric. Food Chem., 2007, 55, 5960–5965 CrossRef PubMed.
- K. Wang and J. Ruan, Int. J. Food Sci. Technol., 2009, 44, 2476–2484 CrossRef CAS.
- J. Williams, D. Sergi, A. J. McKune, E. N. Georgousopoulou, D. D. Mellor and N. Naumovski, Phytother. Res., 2019, 33, 571–583 CrossRef PubMed.
- M. Zhao, Y. Ma, Z.-z. Wei, W.-x. Yuan, Y.-l. Li, C.-h. Zhang, X.-t. Xue and H.-j. Zhou, J. Agric. Food Chem., 2011, 59, 3641–3648 CrossRef CAS PubMed.
- K.-Y. Syu, C.-L. Lin, H.-C. Huang and J.-K. Lin, J. Agric. Food Chem., 2008, 56, 7637–7643 CrossRef CAS PubMed.
- L. Liu and K. Sayama, J. Funct. Foods, 2018, 47, 156–162 CrossRef CAS.
- M. Bose, J. D. Lambert, J. Ju, K. R. Reuhl, S. A. Shapses and C. S. Yang, J. Nutr., 2008, 138, 1677–1683 CrossRef CAS PubMed.
- L. Zhang, N. Li, Z.-Z. Ma and P.-F. Tu, J. Agric. Food Chem., 2011, 59, 8754–8760 CrossRef CAS PubMed.
- T. Yi, L. Zhu, W.-L. Peng, X.-C. He, H.-L. Chen, J. Li, T. Yu, Z.-T. Liang, Z.-Z. Zhao and H.-B. Chen, LWT--Food Sci. Technol., 2015, 62, 194–201 CrossRef CAS.
- E. Ros, Atherosclerosis, 2000, 151, 357–379 CrossRef CAS PubMed.
- D. G. Raederstorff, M. F. Schlachter, V. Elste and P. Weber, J. Nutr. Biochem., 2003, 14, 326–332 CrossRef CAS PubMed.
Footnote |
| † Electronic supplementary information (ESI) available. See DOI: 10.1039/c9ra07655g |
| This journal is © The Royal Society of Chemistry 2019 |