DOI:
10.1039/C9RA07642E
(Paper)
RSC Adv., 2019,
9, 39133-39142
Observation of the transition state of domain wall displacement and GMI effect of FINEMET/graphene composite ribbons†
Received
20th September 2019
, Accepted 18th November 2019
First published on 28th November 2019
Abstract
In this paper, the morphology, structure, and magnetic properties of FINEMET/graphene composite ribbons are systematically studied by SEM, Raman and static methods (hysteresis loops) and the dynamic method (giant magneto-impedance effect, GMI) respectively. It is revealed that with the increase of the number of graphene layers, the GMI effect of the FINEMET/graphene composite ribbons decreases, and the anisotropy field and the relaxation frequency of domain wall displacement of FINEMET/graphene composite ribbons increases. The result also confirmed that graphene does regulate the magnetic properties of FINEMET ribbon. Therefore, a comprehensive analysis of the influence of graphene on the magnetic properties of FINEMET ribbon is of important guiding significance in industrial applications.
1. Introduction
The giant magneto-impedance effect and graphene have attracted more and more attention from researchers because of their excellent application prospects. Due to the high sensitivity, low saturation magnetic field, low power loss and small hysteresis of the FINEMET ribbon, it is considered as an attractive candidate for making the magnetic sensors based on the giant magneto-impedance (GMI) effect.1–3 When there is a conductive or magnetically material around the soft magnetic material, the properties of the materials will be changed due to the interactions between them. Therefore, magnetic performance of soft magnetic materials is strongly correlated with the surrounding coating layer beside them, which can be precisely identified by the GMI effect. Many researchers have previously studied the effects of nickel-zinc ferrite,4 copper oxide,5 silicon dioxide6 and copper,7 carbon materials8 on the GMI effect of soft magnetic materials. Recently, some researchers have turned their attention to how to combine graphene with soft magnetic materials to study their structure, magnetic properties, sensitivity and other scientific problems and produce some meaningful research. For example, Zhen Yang et al. studied the GMI effect of tortuous-shaped Co-based amorphous ribbon coated with graphene and reported that the 13.1% MI ratio enhancement was observed by spin coating graphene on the Co-based amorphous ribbon.9 L. Jamilpanah et al. found that deposition of graphene oxide (GO) on the surface of Co68.15Fe4.35Si12.5B15 ribbon is performed using an EPD method to evaluate the MI response.10 The results indicated that the MI ratio of Co-based ribbon deposited GO with 4 and 8 min increased 10% and 30% respectively. Yi Zhang studied the magneto-impedance effect of Fe75.5Cu1Nb3Si13.5B7 ribbon covered by in situ grown vertical graphene sheets.11 The results indicated that at certain frequency, the magneto impedance effect of a one side graphene covered sample shows enlargement, but the both sides covered sample shows the reverse tendency. The above researchers studied the change of GMI effect of soft magnetic materials from the perspective of thickness and morphology. Besides, magnetic power loss is also an important question for an electronic device in practical applications. Praveena studied the relaxation frequency and lower power losses in Zn2+ substituted ferrites.12 In general, magnetic loss refers to eddy currents, hysteresis, and loss due to magnetization relaxation or magnetic aftereffects that are associated with magnetization or magnetization reversal processes. In the high frequency band, (the frequency is approximately equal to 106–108 Hz), mainly due to the resonance or relaxation of the domain. In the ultra-high frequency band (frequency is approximately equal to 108–1010 Hz), it mainly belongs to natural resonance. However, few researchers have systematically studied the morphology, impedance ratio, the relaxation frequency of domain wall displacement and sensitivity of the FINEMET ribbon coated with graphene prepared by CVD method. In this paper, the magnetic properties of FINEMET/graphene composite ribbons are studied by static method and the dynamic method. Our experiment results are exactly the opposite of that of other research groups. The results demonstrate the correctness of other groups and enrich the mechanism research of FINEMET/graphene composite ribbons in the field of GMI effect.
2. Experimental method
A. Preparation of graphene and FINEMET ribbon
The Fe-based amorphous ribbons were prepared by rapid quenching technique and cut to 20 mm (width 0.6 mm and thickness 33 μm). The wheel linear speed is 20 m s−1. Then, it is annealed for 20 minutes to become FINEMET ribbon at the pressure of 9.8 × 10⁻⁵ Pa and 540 °C. The FINEMET ribbon has two different surfaces: the free side surface and wheel-side surface with different roughness respectively. Graphene is obtained by traditional CVD method. Specifically, the copper foil was cut into 2 × 2 cm2 square sheets, placed in a quartz tube. The hydrogen gas (10 sccm) was injected under low pressure (1 Pa) conditions when the temperature was raised to 1050 °C within 90 minutes. Then, CH4 (15 sccm) was injected and held for 45 minutes to grow graphene on the copper foil. At last, the graphene is transferred to the free surface of the FINEMET ribbon layer by layer, and then the FINEMET/graphene composite ribbons are annealed for 30 min at 400 °C under low pressure conditions (3 Pa) and hydrogen atmosphere (10 sccm).
B. Sample characterization
The magneto-impedance was measured by using the impedance analyzer (HP4294A). The amplitude value was 10 mA and the frequency of the ac current were 100 Hz to 100 MHz, respectively. The relative change of magneto-impedance, i.e. the MI ratio, was defined as.| |
 | (1) |
| |
 | (2) |
where Z(Hex) and Z(Hmax) are the impedance values of the samples in the external field and in the maximum magnetic field, and Hmax = 90 Oe.
The hysteresis loops of FINEMET/graphene composite ribbons were tested by the Lake-shore 7404 vibrating sample magnetometer (VSM), with the magnetic field parallel to the longitudinal axis. The surface roughness and morphology of FINEMET/graphene composite ribbons were observed using atomic force microscope (AFM) system supported by Workshop Company and S-4800 scanning electron microscope (SEM), respectively. Raman analysis of FINEMET/graphene composite ribbons was obtained with a laser Raman spectrometer, the instrument model number is Renishaw inVia Reflex. All the measurements were performed at room temperature (Table 1).
Table 1 The comparison of sensitivity between GMI materials and other materials
| Magnetic sensor type |
Materials |
Sensitivity (%/Oe) |
| Superconducting quantum interferometer (SQUID) |
GaAs/InAs43 |
10−10 to 10−4 |
| Giant magnetoresistive sensor (GMR-S) |
MnIr/CoFeB/Cu/CoFeB44 |
10−6 to 10−2 |
| NiO/NiFeCo/Cu/NiFeCo/C45 |
| Fluxgate sensor (FG-S) |
Co66Fe4Ni1B14Si1546 |
10−5 to 10−1 |
| FeNiCo47 |
| Hall effect magnetic sensor (HE-S) |
NiFe/Cu/IrMn48 |
1–106 |
| MnBiTe49 |
| Magneto-optical sensor (MO-S) |
LiNbO350 |
1–106 |
| Au/NiFe51 |
| Ag/CeYIG52 |
| Inductive sensor |
CoFeB53 |
10−6 to 10−2 |
| Giant magnetoimpedance sensor (GMI-S) |
NiFe/Cu54 |
10−2–102 |
| Py/Ti/Cu/Ti/Py55 |
| CoFeSiBCr56 |
| Nanocrystalline ribbon57 |
3. Results and discussion
3.1 Morphology characterization of FINEMET/graphene composite ribbons
Fig. 1(a–h) was the morphology diagram of FINEMET/graphene composite ribbons. In Fig. 1, as the number of graphene layers increased, the surface of FINEMET/graphene composite ribbons became rougher with many defects, such as cracks, wrinkles, and pores. The AFM diagram of the FINEMET/graphene composite ribbons also showed the same feature in Fig. S1.† Since the surface of FINEMET/graphene composite ribbons is getting rougher, the greater obstacle received during the movement, and the greater the energy loss resulted in an increase of resistivity. Besides, the appearance of above phenomenon also confirmed the existence of stress. The eddy-current losses were also affected by stress since the effective resistivity of sample increases with internal stress.13
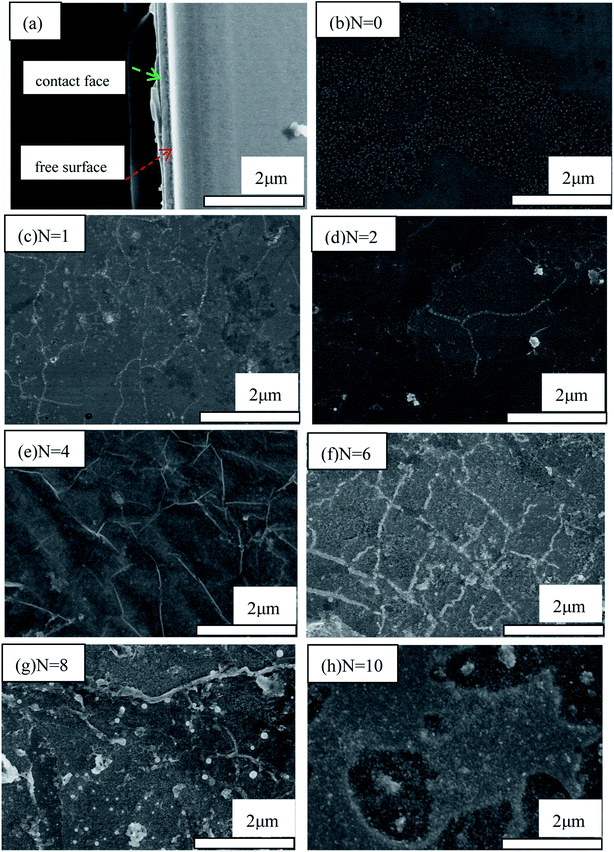 |
| | Fig. 1 SEM microscopic images of (a) section image of FINEMET/graphene composite ribbons (b) FINEMET ribbon and (c–h) FINEMET ribbon with N graphene layer (N = 1, 2, 4, 6, 8, 10). | |
3.2 Raman characterization of graphene–FINEMET ribbon
Fig. 2(a–g) was Raman characterization of the FINEMET ribbon and FINEMET/graphene composite ribbons. As shown in Fig. 2(a), the FINEMET ribbon had three characteristic peaks at the wavenumbers of 300 cm−1, 800 cm−1, and 2450 cm−1 position. As shown in Fig. 2(b) that the FINEMET ribbon coated with a graphene layer showed the characteristics peak in A (A = 300 cm−1, 800 cm−1, and 2450 cm−1) and B (B = 1350 cm−1, 1580 cm−1 and 2700 cm−1) position. The A and B represented the characteristic peaks of FINEMET ribbon and graphene, respectively. At the same time, a characteristic peak of the C (C represent the characteristic peak of Si–H and Si–H2) appeared around 2000 cm−1. The reason for the emergence of the C peak was hydrogen annealing caused new chemical bonds between graphene layer and the FINEMET ribbon, such as Si–H and Si–H2 bond.14 There were three main effects for the FINEMET/graphene composite ribbons during the hydrogen annealing process:15–19 the first was to remove contaminants (PMMA, etc.), the second was to saturate the surface metal dangling bonds, and the third was to form hydrogen bonds and Si–H bonds to increase adhesion between the FINEMET ribbon and graphene.
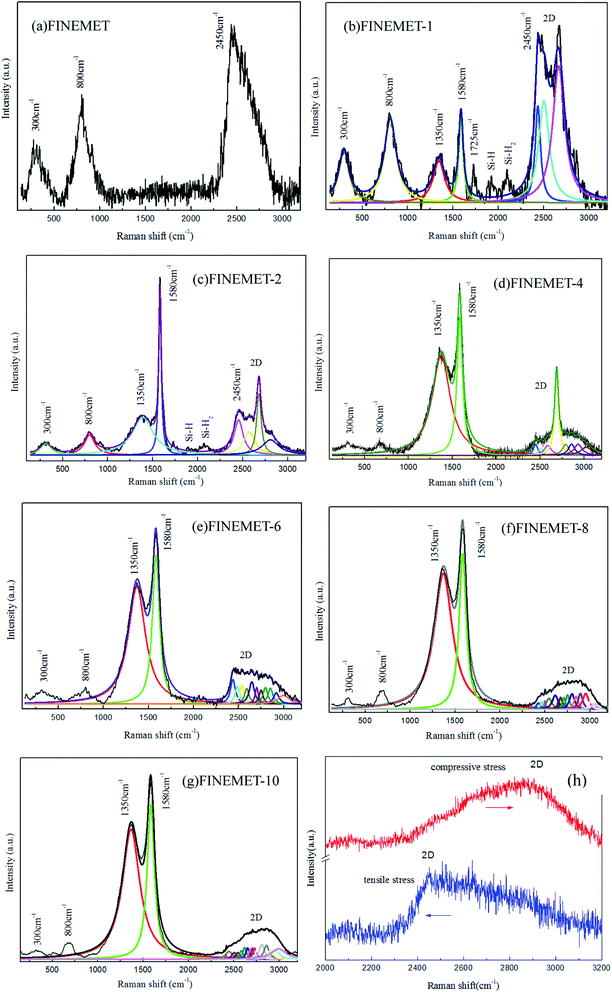 |
| | Fig. 2 (a–g) Raman spectrum of FINEMET/graphene composite ribbons and (h) red shift and blue shift of FINEMET/graphene composite ribbons under different stress. | |
At the same time, the 2D (2700 cm−1) peak of graphene are sensitive to the stress, which referred to the two-phonon Raman resonance peak.20–22 As shown in Fig. 2(h), when the graphene subjected to the stress, the 2D peak would change.23 Specifically, the 2D characteristic peak of graphene had a small low wavenumber displacement and a high wave number displacement when it was received the tensile stress and compressive stress respectively.24–26 The reason was attributed to the change in the carbon–carbon bond. The Lorentz fitting of the characteristic peak of the FINEMET/graphene composite ribbons were shown in Fig. 2(b–g). The 2D peak of the single-layer graphene has a perfect single the Lorentz peak type, which can be divided into two sub-peaks. Similarly, the 2D peak of two layers of graphene has four Lorenz sub-peaks, and so on. By analogy, the 4, 6, 8, and 10 layers of graphene contained 2D peaks with 4, 8, 12, 16, and 20 Lorentz sub-peaks, respectively.
3.3 Relaxation frequency of FINEMET/graphene composite ribbons
Fig. 3(a) was an impedance diagram of FINEMET/graphene composite ribbons. From the Fig. 3(a), the impedance curve was a single peak at low frequencies (400 kHz). This was due to the domain wall displacement of FINEMET/graphene ribbon. At intermediate frequencies (800 kHz), the impedance curve presented three peaks, because of the intermediate process from the domain wall displacement to the magnetic moment rotation of FINEMET/graphene ribbon.27 At high frequencies (4 MHz), the impedance curve was a double peak, which was related to the moment rotation process of FINEMET/graphene composite ribbons. Fig. 3(b) was a diagram of the relaxation frequency of the domain wall displacement of the FINEMET/graphene composite ribbon with the increase of the number of graphene layers. From the Fig. 3(b), it was observed that with the increase of the number of graphene layers, the relaxation frequency of the domain wall displacement of the FINEMET/graphene composite ribbon gradually increased. The reason was explained by the equation of the dynamics of the domain wall.28| |
 | (3) |
where a represents the response coefficient of elastic force, β represents damping coefficient,| |
 | (4) |
μ0 represents vacuum permeability. Ms represents saturated magnetization intensity, ρ represents the resistivity of materials. When the magnetic field is H(t) = H0![[thin space (1/6-em)]](https://www.rsc.org/images/entities/char_2009.gif) exp(jωt), solving the eqn (3) and (4) to obtain the expression of the relaxation frequency of domain wall displacement.
exp(jωt), solving the eqn (3) and (4) to obtain the expression of the relaxation frequency of domain wall displacement.| |
 | (5) |
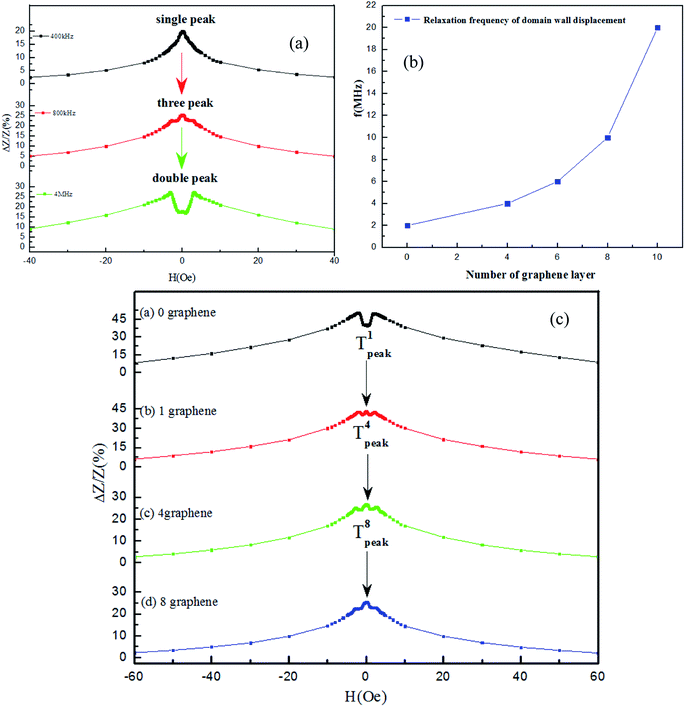 |
| | Fig. 3 (a) Three different state of FINEMET/graphene composite ribbon (b) the relaxation frequency of domain wall displacement dependence graphene layers (N = 0, 4, 6, 8, 10) (c) the transition state of relaxation frequency of domain wall displacement for the FINEMET/graphene composite ribbons at 0.8 MHz N (N = 0, 1, 4, 8). | |
When one more graphene layer was coated on the FINEMET ribbon, as the effective resistivity of FINEMET/graphene composite ribbons increased, the damping coefficient decreased. Hence, the relaxation frequency of domain wall displacement increased. This experimental phenomenon was consistent with the theory of domain wall displacement. Fig. 3(c) was the impedance curves of FINEMET/graphene (N = 0, 1, 4, 8) composite ribbons at the frequency of 0.8 MHz. The impedance curves of FINEMET/graphene composite ribbons at different frequency were shown in Fig. S2.† In Fig. 3(c), the FINEMET/graphene (N = 0) composite ribbons presented double peak in the impedance curve at 0.8 MHz. However, the FINEMET/graphene (N = 1, 4, 8) composite ribbons had a phenomenon of three peaks at same frequency. And also as the number of graphene layers increased, the peaks of the transition state (T1peak ∼ T4peak ∼ T8peak) of domain wall displacement of FINEMET/graphene composite ribbons become more and more obvious and sharp. This confirmed that the relaxation frequency of the domain wall displacement had obviously changed.
3.4 Frequency dependence of GMI for FINEMET/graphene composite ribbons
Fig. 4(a) reflected the dependency between the impedance ratio of FINEMET/graphene composite ribbons and frequency as the number of graphene layers increased. Fig. 4(b) showed the change ratio of impedance of FINEMET/graphene composite ribbons at the characteristic frequency. As shown in Fig. 4(a), with increasing frequency, the GMI ratio increased firstly, reaching a maximum at a characteristic frequency fmax and then decreased for higher frequency. At very low frequency, GMI was relatively small due to the dominant contribution of the induced magneto inductive voltage. In the middle frequency range, the skin effect was dominant, hence a higher GMI was observed. With increasing the frequency, GMI decreased. This was related to the domain wall displacement, which was strongly damped owing to eddy current.29–31 From Fig. 4(b), as the number of graphene layers increased, the impedance ratio of the FINEMET/graphene composite ribbons decreased. One reason was that the current density of the graphene layer and FINEMET ribbon was different. With the increase of frequency, the current density of the graphene layer was greater than that of the FINEMET ribbon, and so the impedance ratio of the FINEMET ribbon would reduce. On the other, the stress exerted by graphene onto the FINEMET ribbon was increasing during the process of graphene transfer and hydrogen annealing, resulting in a worsening of the magnetic properties of the FINEMET ribbon and the change of effective permeability and leading to lower impedance ratio.
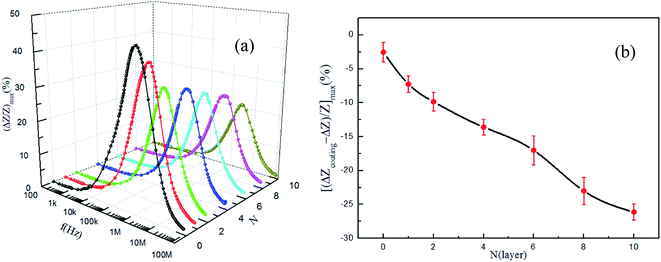 |
| | Fig. 4 (a) The frequency of the GMI ratio (ΔZ/Z)max for the FINEMET/graphene composite ribbons (b) the impedance ratio of FINEMET/graphene composite ribbons at characteristic frequency (N = 0, 1, 2, 4, 6, 8, 10). | |
3.5 Hysteresis loop measurement
Fig. 5(a) showed the dependency relationship between the coercivity of FINEMET/graphene composite ribbons and the number of graphene layers. It could be seen from Fig. 5(a) that as the number of graphene layers increased, the coercivity of FINEMET/graphene composite ribbons increased gradually from 0.068 Oe to 0.391 Oe, which was related to stress change. As the number of graphene layers increasing, the stress generated on the FINEMET ribbon was getting larger, so the coercivity of FINEMET/graphene composite ribbons would get larger and larger. Fig. 5(b) showed a hysteresis loops diagram of FINEMET/graphene composite ribbons. In Fig. 5(b), as the number of graphene layers increased, the saturation magnetization intensity of the FINEMET/graphene composite ribbons gradually decreased from 183.56 emu g−1 to 123.52 emu g−1. The more number of graphene layers, the lower saturation magnetization. In addition, the hysteresis loops of FINEMET/graphene composite ribbons showed an S-shape. It demonstrated that the FINEMET/graphene composite ribbons actually hold a preferential transverse magnetic domain structure and the static magnetization process was dominated by the reversible magnetic moment rotation.
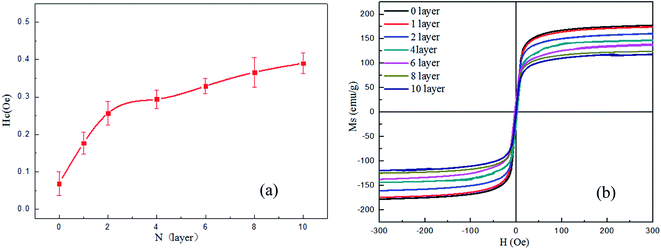 |
| | Fig. 5 (a) The Hc of FINEMET/graphene composite ribbons. (b) Hysteresis loops diagram of FINEMET/graphene composite ribbons. N (=0, 1, 2, 4, 6, 8, 10). | |
3.6 The Hk field dependence of graphene–FINEMET ribbon
Fig. 6(a) showed the changing trend of magnetic anisotropy field of FINEMET/graphene composite ribbons. Fig. 6(b) was the distribution of magnetic anisotropy field of FINEMET/graphene composite ribbons. The anisotropy field Hk have been obtained from the maximum of the second derivative of the hysteresis loops.32,33 It can be seen from Fig. 6(a) that as the number of graphene layers increased, the magnetic anisotropy field of FINEMET/graphene composite ribbons gradually increased. This is because that the FINEMET ribbon will undergo a slight stress effect after the graphene is coated. In our experiment, we mainly consider the influence of stress energy. The increase of magnetic anisotropy field was due to the increase of stress in FINEMET ribbon after coating graphene. The stress energy (Fσ) is given as;34| |
 | (6) |
where λs is the magnetostriction coefficient and σi is the internal stress value, θ is the angle between stress direction and magnetization vector.
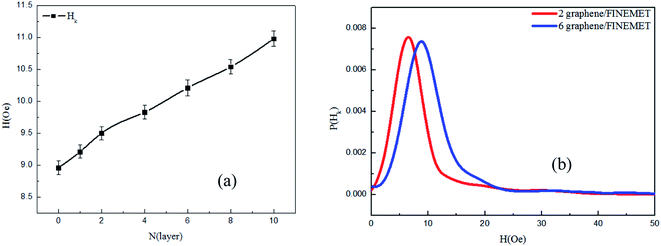 |
| | Fig. 6 (a) The field of Hk dependence of the FINEMET/graphene composite ribbons. (b) The Hk field distribution of FINEMET/graphene composite ribbons N (2, 6). | |
3.7 Mechanism and sensitivity of FINEMET/graphene composite ribbons
Fig. 7 was a comparison of the GMI performance of the preparation of soft magnetic materials. There are mainly three aspects of comparison in Fig. 7. Firstly: preparation method (magnetron sputtering, electroless plating, evaporation, electrodeposition, Taylor–Ulitovsky, EPD, PECVD). Secondly: coating type (ferrite, metal, insulating layer, oxide, carbon material, glass). Thirdly: material structure (wire, ribbon, film). The results of the comparison were that our experimental preparation method, performance changes and coating types were different from other research groups. More importantly, our experimental results are mutually verified and complementary to the results of other research groups. Fig. 8(a–c) showed the decomposition and mechanism diagram of FINEMET/graphene composite ribbons. It can be seen from Fig. 8(c) that as the frequency increased, the current mainly passed through the graphene layer, and the current density through the FINEMET ribbon decreased, resulting in a lower dynamic permeability and thus a lower GMI effect. Meanwhile, as the number of graphene layers increased, the FINEMET/graphene composite ribbons were more difficult to reach saturation, and then the sensitivity rate of FINEMET/graphene composite ribbon got greater. Fig. 8(d) was the trend of sensitivity of FINEMET/graphene composite ribbons. It was shown in Fig. 8(d) that as the number of graphene layers increased, the sensitivity of FINEMET/graphene composite ribbons varied from −0.912 to −5.719. The supporting data were shown in Fig. S2.†
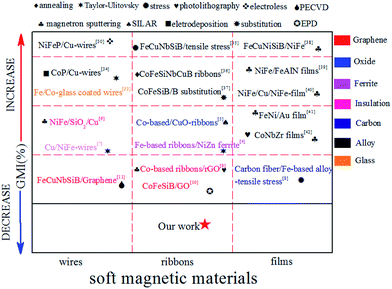 |
| | Fig. 7 Comparison our work with other team4,9,31,35–44 GMI work. | |
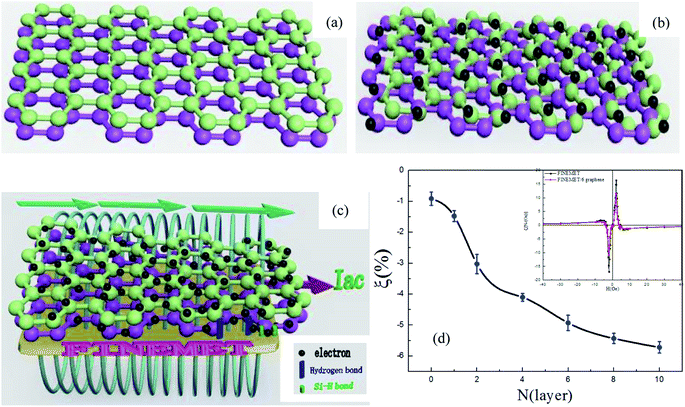 |
| | Fig. 8 Mechanism and decomposition diagram of FINEMET/graphene composite ribbons. (a) Layer by layer graphene film by CVD; (b) electronic motion state of graphene film; (c) the entire mechanism diagram of FINEMET/graphene composite ribbons; (d) sensitivity of FINEMET/graphene composite ribbons at characteristic frequencies N (0, 1, 2, 4, 6, 8, 10). Inset chart is the correspondence between sensitivity and magnetic field of FINEMET ribbon and 6-graphene layer-FINEMET ribbon. | |
4. Conclusion
We fabricated the graphene film by CVD method and then transferred it onto the FINEMET ribbon. It was found that the GMI performance of the FINEMET/graphene composite ribbons decreased with the increase of the number of graphene layers. It was due to the stress of FINEMET/graphene composite ribbons gradually enhanced as the number of graphene layers increase. Besides, we also investigated the change law of the transition state of the domain wall displacement to the rotation of magnetic moment. In addition, as the frequency increases, the current density through the Finemet/graphene composite ribbon decreases, which is also the reason of the GMI ratio reduction. In summary, graphene had regulated the magnetic properties of the FINEMET ribbon, which was an important guiding significance in industrial applications.
Conflicts of interest
There are no conflicts to declare.
Acknowledgements
This work is supported by the National Natural Science Foundation of China (11774091, 11574084 and 51572086). Part of this work is also supported by the Fundamental Research Funds for the Central Universities.
References
- H. L. Pan, X. Li, Q. Zhang, Y. P. Su, J. T. Wang, W. H. Xie and Z. J. Zhao, Investigation of dipolar interaction in FINEMET ribbons through longitudinally driven magneto-impedance effect, J. Magn. Magn. Mater., 2018, 452, 502–506 CrossRef CAS.
- R. Fates and J. Raskin, Linear and non-linear electrical behaviors in graphene ribbon based devices, Journal of Science: Advanced Materials and Devices, 2018, 3(3), 366–370 Search PubMed.
- Y. Zhen, H. H. Wang, X. W. Dong, H. L. Yan, C. Lei and Y. S. luo, Giant magnetoimpedance based immunoassay for cardiac biomarker myoglobin, Anal. Methods, 2017, 9(24), 3636–3642 RSC.
- X. J. Sun, J. L. Du, Z. T. Zhu, J. B. Wang and Q. F. Liu, Enhanced GMI effect in NiZn-ferrite-modified Fe-based amorphous ribbons, Appl. Phys. A: Mater. Sci. Process., 2015, 119(4), 1277–1281 CrossRef CAS.
- A. A. Taysioglu, A. Peksoz, Y. Kaya, N. Derebasi, G. Irez and G. Kaynak, GMI effect in CuO coated Co-based amorphous ribbons, J. Alloys Compd., 2009, 487(1–2), 38–41 CrossRef CAS.
- Q. Zhang, Q. Mao, J. Z. Ruan, Q. J. Wang, X. L. Yang and Z. J. Zhao, Giant magneto-impedance effect of magnetron sputtered Ni80Fe20/SiO2/Cu composite wires, J. Magn. Magn. Mater., 2008, 320(19), 2319–2321 CrossRef CAS.
- M. T. Tung, D. V. A. Dung, N. D. Long and A. T. Le, Effects of Electrolytic Current Density on Structural, Magnetic Properties and GMI Behavior in Electrodeposited Bilayer FeNi/Cu Composite Wires, J. Supercond. Novel Magn., 2012, 25(7), 2499–2505 CrossRef CAS.
- Y. Zhang, T. Gan, J. Dong, Q. F. Liu, J. B. Wang and W. Z. Shi, Enhanced magnetoimpedance effect of carbon fiber/Fe-based alloy coaxial composite by tensile stress, Carbon, 2015, 93, 451–457 CrossRef CAS.
- Y. Zhen, C. Lei, X. C. Sun, Y. Zhou and Y. Liu, Enhanced GMI effect in tortuous-shaped Co-based amorphous ribbons coated with graphene, J. Mater. Sci.: Mater. Electron., 2016, 27(4), 3493–3498 CrossRef.
- L. Jamilpanah, S. Azadian, J. S. Gharehbagh, S. H. Jahromi and Z. Sheykhifard, Electrophoretic deposition of graphene oxide on magnetic ribbon: toward high sensitive and selectable magnetoimpedance response, Appl. Surf. Sci., 2018, 447, 423–429 CrossRef CAS.
- Y. Zhang, C. J. Huang, Z. H. Duan, Q. F. Liu, J. B. Wang and W. Z. Shi, Enhanced magnetoimpedance effect of Fe75.5Cu1Nb3Si13.5B7 ribbon covered by in situ growth vertical graphene sheets, Mater. Lett., 2018, 222, 131–134 CrossRef CAS.
- K. Praveena, H. W. Chen, H. L. Liu, K. Sadhana and S. R. Murthy, Enhanced magnetic domain relaxation frequency and low power losses in Zn2+ substituted manganese ferrites potential for high frequency applications, J. Magn. Magn. Mater., 2016, 420, 129–142 CrossRef CAS.
- E. Shuvaeva, S. Kaloshkin, M. Churyukanova, A. Perminov, I. Khriplivets and A. Mitra, The impact of bending stress on magnetic properties of Finemet type microwires and ribbons, J. Alloys Compd., 2018, 743, 388–393 CrossRef CAS.
- D. W. Boukhvalov, E. Z. Kurmaev, E. Urbanczyk, G. Derz, A. Stolarczyk and W. Simka, Atomic and electronic structure of graphene oxide/Cu interface, Thin Solid Films, 2018, 665, 99–108 CrossRef CAS.
- C. Riedl, C. Coletti, T. Iwasaki, A. A. Zakharov and U. Starke, Quasi-Free-Standing Epitaxial Graphene on SiC Obtained by Hydrogen Intercalation, Phys. Rev. Lett., 2009, 103(24), 246804 CrossRef CAS PubMed.
- C. Maurer, S. Haas, W. Beyer, F. C. Maier, U. Zastrow, M. Hulsbeck, U. Breuer and U. Rau, Application of Raman spectroscopy for depth-dependent evaluation of the hydrogen concentration of amorphous silicon, Thin Solid Films, 2018, 653, 223–228 CrossRef CAS.
- V. A. Volodin and D. I. Koshelev, Quantitative analysis of hydrogen in amorphous silicon using Raman scattering spectroscopy, J. Raman Spectrosc., 2013, 44(12), 1760–1764 CrossRef CAS.
- C. Hu, X. Q. Zhai, L. L. Liu, Y. Zhao, L. Jiang and L. T. Qu, Spontaneous Reduction and Assembly of Graphene oxide into Three-Dimensional Graphene Network on Arbitrary Conductive Substrates, Sci. Rep., 2013, 3(1), 1–10 Search PubMed.
- A. Fox and R. Upamanyu, Thermal conductivity of graphene grain boundaries along arbitrary in-plane directions: a comprehensive molecular dynamics study, J. Appl. Phys., 2019, 125(1), 015101 CrossRef.
- A. C. Ferrari and D. M. Basko, Raman spectroscopy as a versatile tool for studying the properties of graphene, Nat. Nanotechnol., 2013, 8(4), 235–246 CrossRef CAS PubMed.
- A. Eckmann, A. Felten, A. Mishchenko, L. Britnell, R. Krupke, K. S. Novoseov and C. Casiraghi, Probing the Nature of Defects in Graphene by Raman Spectroscopy, Nano Lett., 2012, 12(8), 3925–3930 CrossRef CAS PubMed.
- A. Niilisk, J. Kozlova, H. Alles, J. Aarik and V. Sammelselg, Raman characterization of stacking in multi-layer graphene grown on Ni, Carbon, 2016, 98, 658–665 CrossRef CAS.
- A. C. Manikas, M. G. Pastore Carbone, C. R. Woods, Y. Wang, I. Souli, G. Anagnostopoulos, M. Hadjinicolaou, K. S. Novoselov and C. Galiotis, Stress transfer at the nanoscale on graphene ribbons of regular geometry, Nanoscale, 2019, 11(30), 14354–14361 RSC.
- D. Yoon, Y. W. Son and H. Cheong, Strain-Dependent Splitting of the Double-Resonance Raman Scattering Band in Graphene, Phys. Rev. Lett., 2011, 106(15), 155502 CrossRef PubMed.
- J. Zabel, R. R. Nair, A. Ott, T. Georgiou, A. K. Geim, K. S. Novoselov and C. Casiraghi, Raman. Spectroscopy of Graphene and Bilayer under Biaxial Strain: Bubbles and Balloons, Nano Lett., 2012, 12(2), 617–621 CrossRef CAS PubMed.
- R. Rao, R. Podila, R. Tsuchikawa, J. Katoch, D. Tishler, A. M. Rao and M. Ishigami, Effects of Layer Stacking on the Combination Raman Modes in Graphene, ACS Nano, 2011, 5(3), 1594–1599 CrossRef CAS PubMed.
- A. Rosales-Rivera, V. H. Valencia and P. Pineda-Gómez, Three-peak behavior in giant magnetoimpedance effect in Fe73.5−xCrxNb3Cu1Si13.5B9 amorphous ribbons, Phys. B, 2007, 398(2), 252–255 CrossRef CAS.
- G. Buttino, A. Cecchetti and M. Poppi, Domain wall relaxation frequency and magnetocrystalline anisotropy in Co- and Fe-based nanostructured alloys, J. Magn. Magn. Mater., 2004, 269(1), 70–77 CrossRef CAS.
- L. Xie, X. Li, J. T. Zou, H. L. Pan, W. H. Xie and Z. J. Zhao, Optimized giant magneto-impedance effect in electroless-deposited NiFeP/Cu composite wires, Surf. Coat. Technol., 2018, 334, 158–163 CrossRef CAS.
- M. Phan and H. Peng, Giant magnetoimpedance materials: fundamentals and applications, Prog. Mater. Sci., 2008, 53(2), 323–420 CrossRef.
- J. Devkota, T. Luong, J. S. Liu, H. Shen, F. X. Qin, J. F. Sun, P. Mukherjee, H. Srikanth and M. H. Phan, A soft ferromagnetic multiwire-based inductance coil sensor for sensing applications, J. Appl. Phys., 2014, 116(23), 234504 CrossRef.
- V. Franco, C. F. Conde and A. Conde, Changes in magnetic anisotropy distribution during structural evolution of Fe76Si10.5B9.5Cu1Nb3, J. Magn. Magn. Mater., 1998, 185(3), 353–359 CrossRef CAS.
- V. Franco, C. F. Conde and A. Conde, Effect of stress-induced anisotropy on high frequency magnetoimpedance effect of Fe and Co-rich glass-coated microwires, J. Alloys Compd., 2018, 735, 1818–1825 CrossRef.
- M. T. Tung, L. T. Hang, L. A. Tuan, N. H. Nghi and M. H. Phan, Influence of electrodeposition parameters on the magnetic and magneto-impedance properties of CoP/Cu wires, Phys. B, 2014, 442, 16–20 CrossRef CAS.
- R. K. Nutor, X. J. Xu, X. Z. Fan, X. W. He, X. N. Lu and Y. Z. Fang, Effects of applying tensile stress during annealing on the GMI and induced anisotropy of Fe-Cu-Nb-Si-B alloys, J. Magn. Magn. Mater., 2019, 471, 544–548 CrossRef.
- M. H. Phan, H. X. Peng and M. R. Wisnom, Valve behavior of giant magnetoimpedance in field-annealed Co70Fe5Si15Nb2.2Cu0.8B7 amorphous ribbon, J. Appl. Phys., 2005, 97(10), 10M108 CrossRef.
- M. H. Phan, H. X. Peng, M. R. Wisnom, S. C. Yu and N. Chau, Enhanced GMI effect in a Co70Fe5Si15B10 ribbon due to Cu and Nb substitution for B, Phys. Status Solidi A, 2004, 201(7), 1558–1562 CrossRef CAS.
- Y. Han, X. Li, W. X. Lv, W. H. Xie, Q. Zhao and Z. J. Zhao, Magnetoimpedance effect of FINEMET ribbons coated with Fe20Ni80 permalloy film, J. Alloys Compd., 2016, 678, 494–498 CrossRef CAS.
- Z. Y. Zhong, H. W. Zhang, Y. L. Jing, X. L. Tang and S. liu, Magnetic microstructure and magnetoimpedance effect in NiFe/FeAlN multilayer films, Sens. Actuators, A, 2008, 141(1), 29–33 CrossRef CAS.
- Z. M. Zhou, Y. Zhou and L. Chen, Perpendicular GMI effect in meander NiFe and NiFe/Cu/NiFe film, IEEE Trans. Magn., 2008, 44(10), 2252–2254 CAS.
- D. de Cos, N. Fry, I. Orue, L. V. Panina, A. Garcia-Arribas and J. M. Barandiaran, Very large magnetoimpedance (MI) in FeNi/Au multilayer film systems, Sens. Actuators, A, 2006, 129(1–2), 256–259 CrossRef CAS.
- H. Kikuchi, S. Kamata, T. Nakai, S. Hashi and K. Ishiyama, et al., Influence of demagnetizing field on thin-film GMI magnetic sensor elements with uniaxial magnetic anisotropy, Sens. Actuators, A, 2015, 230, 142–149 CrossRef CAS.
- F. Haas, S. Dickheuer, P. Zellekens, T. Rieger, M. I. Lepsa, H. Lüth, D. Grützmacher and T. Schäpers, Quantum interferometer based on GaAs/InAs core/shell nanowires connected to superconducting contacts, Semicond. Sci. Technol., 2018, 33(6), 64001 CrossRef.
- G. A. Wang, Y. Masuda, T. Kato and S. Iwata, Design and performance of domain wall displacing-type field sensors using a magnetic tunnel junction and a giant magnetoresistive device, J. Phys. D: Appl. Phys., 2010, 43(45), 455001 CrossRef.
- H. Yamane, Highly sensitive giant magnetoresistive sensor consisting of NiO spin-valve element and AC bias current line, J. Magn. Magn. Mater., 1999, 198–199, 128–130 CrossRef CAS.
- S. Zhi, C. Lei, Z. Yang, Z. Feng, L. Guo and Y. Zhou, Effect of Field Annealing Induced Magnetic Anisotropy on the Performance of Meander-Core Orthogonal Fluxgate Sensor, Phys. Status Solidi A, 2018, 215(21), 1800400 CrossRef.
- Y. Watanabe, M. Otsubo, A. Takahashi, T. Yanai, M. Nakano and H. Fukunaga, Temperature Characteristics of a Fluxgate Current Sensor With Fe-Ni-Co Ring Core, IEEE Trans. Magn., 2015, 51(11), 1–4 Search PubMed.
- A. D. Henriksen, G. Rizzi and M. F. Hansen, Planar Hall effect bridge sensors with NiFe/Cu/IrMn stack optimized for self-field magnetic bead detection, J. Appl. Phys., 2016, 119(9), 093910 CrossRef.
- Y. Ni, Z. Zhang, I. C. Nlebedim, R. L. Hadimani and D. C. Jiles, Influence of Mn Concentration on Magnetic Topological Insulator MnxBi2−xTe3Thin-Film Hall-Effect Sensor, IEEE Trans. Magn., 2015, 51(11), 1–4 CAS.
- C. N. Rao, P. Dua, P. Kuchhal, Y. Lu, S. N. Kale and P. Cao, Enhanced sensitivity of magneto-optical sensor using defect induced perovskite metal oxide nanomaterial, J. Alloys Compd., 2019, 797, 896–901 CrossRef CAS.
- M. Moradi, S. M. Mohseni, S. Mahmoodi, D. Rezvani, N. Ansari, S. Chung and J. Åkerman, Au/NiFe magnetoplasmonics: large enhancement of magneto-optical kerr effect for magnetic field sensors and memories, Electron. Mater. Lett., 2015, 11(3), 440–446 CrossRef CAS.
- J. Qin, L. Deng, J. Xie, T. Tang and L. Bi, Highly sensitive sensors based on magneto-optical surface plasmon resonance in Ag/CeYIG heterostructures, AIP Adv., 2015, 5(1), 017118 CrossRef.
- H.-C. Chang, S.-C. Liao, H.-S. Hsieh, J.-H. Wen, C.-H. Lai and W. Fang, Magnetostrictive type inductive sensing pressure sensor, Sens. Actuators, A, 2016, 238, 25–36 CrossRef CAS.
- V. V. Kondalkar, X. Li, I. Park, S. S. Yang and K. Lee, Development of chipless, wireless current sensor system based on giant magnetoimpedance magnetic sensor and surface acoustic wave transponder, Sci. Rep., 2018, 8(1), 1–6 CrossRef CAS PubMed.
- G. L. S. Vilela, J. G. Monsalve, A. R. Rodrigues, A. Azevedo and F. L. A. Machado, Giant magnetoimpedance effect in a thin-film multilayer meander-like sensor, J. Appl. Phys., 2017, 121(12), 124501 CrossRef.
- T. K. Das, A. Mitra, S. K. Mandal, R. K. Roy, P. Banerji and A. K. Panda, Parametric controls on giant magnetoimpedance (GMI) behaviour of CoFeSiBCr amorphous wires for prospective sensor applications, Sens. Actuators, A, 2014, 220, 382–387 CrossRef CAS.
- S. Dwevedi and G. Markandeyulu, Giant magnetoimpedance effect in nanocrystalline ribbons for sensitive magnetic sensors, J. Appl. Phys., 2010, 107(9), 09A328 CrossRef.
Footnote |
| † Electronic supplementary information (ESI) available. See DOI: 10.1039/c9ra07642e |
|
| This journal is © The Royal Society of Chemistry 2019 |
Click here to see how this site uses Cookies. View our privacy policy here.  Open Access Article
 ,
Yenan Song
 * and
Zhenjie Zhao
 *
*


![[thin space (1/6-em)]](https://www.rsc.org/images/entities/char_2009.gif) exp(jωt), solving the eqn (3) and (4) to obtain the expression of the relaxation frequency of domain wall displacement.
exp(jωt), solving the eqn (3) and (4) to obtain the expression of the relaxation frequency of domain wall displacement.


