 Open Access Article
Superconducting properties and non-isothermal crystallization kinetics of a Bi2Sr2CaCu2O8+δ (Bi2212) superconductor prepared by the Pechini sol–gel method
Xingming Zhaoa,
Tianlin Wangb,
Songchol Hongac,
Dalu Suna,
Nan Wanga,
Guksong Chaec and
Yang Qi *a
*a
aDepartment of Materials Physics and Chemistry, School of Materials Science and Engineering, Northeastern University, Shenyang, Liaoning 110819, P. R. China. E-mail: qiyang@imp.neu.edu.cn; Tel: +86-24-83691993
bDepartment of Physics and Biophysics, School of Fundamental Sciences, China Medical University, Shenyang, Liaoning 110122, P. R. China
cInstitute of Nano Science and Physical Engineering, Kim Chaek University of Technology, Pyongyang, Democratic People's Republic of Korea
First published on 31st October 2019
Abstract
Bi2212 superconductors with crystallization treatments at different temperatures were prepared by the Pechini sol–gel method, and their structural, thermal and transport properties were investigated. The X-ray diffraction (XRD) and field emission scanning electron microscopy (FESEM) results revealed the high purity and sheet crystal structures of the prepared samples. The non-isothermal crystallization kinetics and process of the Bi2212 superconductor were characterized and analyzed by differential scanning calorimetry (DSC) and Jeziorny and Mo methods, respectively. The results showed that both the Jeziorny and Mo methods were well suitable for describing the non-isothermal crystallization process of the Bi2212 superconductor prepared by the Pechini sol–gel method. The Avrami exponent (n = 2) confirmed the two-dimensional sheet growth mechanism of the Bi2212 superconductor. In addition, the non-isothermal crystallization kinetic parameter Zc increased with the increase in cooling rate. The crystallization parameter F(T) also increased with the increase in crystallinity, and the F(T) values were calculated to be 4.79 and 42.66 when the crystallinity values were 20% and 90%, respectively, indicating that for the Bi2212 superconductor, it was harder to crystallize at relatively larger crystallinity. Furthermore, the transport properties of the samples were greatly improved after the cooling crystallization process. Sample J3 had the highest onset of the superconducting transition T(c,onset) of 80.1 K, which was higher than the 73.1 K value determined for sample J0. Also, sample J2 had the best zero resistivity superconducting transition temperature T(c,zero) value of 70.1 K, which was higher than the value of 63.2 K for sample J0. The maximum calculated Jc value was 7.62 × 10⁴ A cm−2 at 2 K for sample J2, which was higher than the 4.70 × 10⁴ A cm−2 value determined for J0.
1. Introduction
Bi-based (BSCCO) superconductors have become one of the most distinctive series of high-temperature superconductors in copper-based superconductors owing to their intrinsic characteristics such as a complex layered crystal structure, rare earth element-free composition, oxygen content in a non-stoichiometric ratio, disordered distribution of cations and intrinsic defects of stacking faults.1–3 The general formula of the BSCCO superconductors can be expressed as Bi2Sr2Can−1CunO2n+4+δ (n = 1–3), i.e., Bi2Sr2CuO6+δ (Bi2201 phase, n = 1), Bi2Sr2CaCu2O8+δ (Bi2212 phase, n = 2) and Bi2Sr2Ca2Cu3O10+δ (Bi2223 phase, n = 3). Compared with the Bi2201 phase, both the Bi2212 and Bi2223 phases have a higher superconducting transition temperature (Tc), which can realize a breakthrough in high-temperature superconductors without rare earth elements above the liquid nitrogen temperature.4,5 However, compared with the Bi2212 phase, the pure phase or single crystal of the Bi2223 phase with Tc of 110 K is difficult to prepare, which makes the fine structure of the crystal difficult to determine. Consequently, the Bi2212 superconductor has been extensively studied due to its relatively easy preparation and stable crystal structure.6–9 The Bi2212 superconductor, a typical multi-component compound, is a potential material for manufacturing magnetic shields, current leads and other superconducting devices.10 Recently, many studies have been focused on the improvement of phase purity and transport performance of the Bi2212 superconductor. The preparation methods of the Bi2212 superconductor mainly include the solid state-reaction method,11 sol–gel method12 and glass ceramic (melt quenching) method.13 Research on the dynamics of the BSCCO superconductors is very important for understanding the nucleation and crystal growth mechanism, which plays a key role in the preparation of high-quality materials.The non-isothermal crystallization process is a crystallization process under a changing temperature field, which is significant for the preparation of ceramic materials. The crystallization behavior is closely related to the properties of the materials and compared to the isothermal crystallization process, the non-isothermal crystallization process is closer to the actual production process, which has more research significance due to its easier experimental achievement and more theoretical information.14,15 However, the process of non-isothermal crystallization kinetics is complex. At present, there are many kinds of theoretical and data processing methods such as the Ozawa method,16 Jeziorny method,17 Kissinger method18 and Mo method.19 These methods are mainly based on the Avrami equation and each has certain scopes and limitations. The crystallization kinetics of the BSCCO systems have been studied by differential thermal analysis (DTA), differential scanning calorimetry (DSC) and thermogravimetry (TG), and the crystallization activation energy, Avrami exponents and average oxidation rate of these systems have been calculated.20–23 A. Arslan et al. studied the crystallization kinetics of the BSCCO ceramics using Sn substitution for Cu sites by the non-isothermal DTA method and found that the change in the Avrami parameter, n, decreased as the level of doping increased, whereas the activation energy, E, was calculated by the Kissinger method.24 O. Ozturk et al. studied the nucleation and crystallization kinetics of the BSCCO glass-ceramic material, where Bi was partially replaced by Ru.25 BSCCO superconductors in these studies were prepared by the solid-state reaction and melt quenching methods, which have the disadvantages of a long time, high temperature and high energy consumption. By contrast, BSCCO superconductors with fine crystallization can be obtained using the sol–gel method at lower temperatures and shorter times due to the high chemical activity, dispersion distribution, short diffusion distance and easy phase formation of precursors.26,27 Compared to the traditional sol–gel method, the Pechini sol–gel method further optimizes the sol system and improves the superconducting performance. The Pechini sol–gel method has been widely applied to synthesize hundreds of oxides with high phase purity such as Y2O3 and ZrO2 and perovskite-structured materials such as LaCoO3 and Bi2Sr2CaCu2O8+δ.10 However, the nucleation and crystallization of the Bi2212 superconductor prepared by the Pechini sol–gel method are rarely reported.
In this paper, the non-isothermal crystallization behavior of a Bi2212 superconductor prepared by the Pechini sol–gel method was studied by the DSC method. The experimental data were processed by the Jeziorny and Mo methods to provide theoretical guidance and design the practical process in order to obtain the high-performance Bi2212 superconductor.
2. Experimental
Analytical reagents Bi(NO3)3·5H2O (7.761 g), Sr(NO3)2 (3.386 g), Ca(NO3)2·4H2O (1.889 g) and Cu(NO3)2·3H2O (3.866 g) were used as reactants in the molar ratio of Bi![[thin space (1/6-em)]](https://www.rsc.org/images/entities/char_2009.gif) :
:![[thin space (1/6-em)]](https://www.rsc.org/images/entities/char_2009.gif) Sr
Sr![[thin space (1/6-em)]](https://www.rsc.org/images/entities/char_2009.gif) :
:![[thin space (1/6-em)]](https://www.rsc.org/images/entities/char_2009.gif) Ca
Ca![[thin space (1/6-em)]](https://www.rsc.org/images/entities/char_2009.gif) :
:![[thin space (1/6-em)]](https://www.rsc.org/images/entities/char_2009.gif) Cu = 2
Cu = 2![[thin space (1/6-em)]](https://www.rsc.org/images/entities/char_2009.gif) :
:![[thin space (1/6-em)]](https://www.rsc.org/images/entities/char_2009.gif) 2
2![[thin space (1/6-em)]](https://www.rsc.org/images/entities/char_2009.gif) :
:![[thin space (1/6-em)]](https://www.rsc.org/images/entities/char_2009.gif) 1
1![[thin space (1/6-em)]](https://www.rsc.org/images/entities/char_2009.gif) :
:![[thin space (1/6-em)]](https://www.rsc.org/images/entities/char_2009.gif) 2, and ethylenediamine tetraacetic acid (EDTA, 16.369 g, the molar ratio of EDTA to metal ions was 1
2, and ethylenediamine tetraacetic acid (EDTA, 16.369 g, the molar ratio of EDTA to metal ions was 1![[thin space (1/6-em)]](https://www.rsc.org/images/entities/char_2009.gif) :
:![[thin space (1/6-em)]](https://www.rsc.org/images/entities/char_2009.gif) 1) was adopted as the chelating agent. In the mixing process, the nitrates were dissolved in 50 ml nitric acid solution. EDTA was dissolved in 25 ml ammonia water, and then the two solutions were mixed to obtain a blue transparent solution. The pH value of the solution was maintained at about 7. Afterwards, 3 wt% 15 ml hydroxyethyl cellulose (HEC) solution was added into the above solution and stirred to obtain the precursor solution. The gel was obtained through heating the solution at 90 °C for 1.5 h and then at 110 °C for 1 h. Finally, the gel was heated, and with the increased temperature, the gel spontaneously burned to form dark brown fluffy precursor powders. The precursor powders were sintered at 850 °C for 3 h to obtain black Bi2212 superconducting powders. The raw powders were carefully grounded as original material for thermogravimetric analysis. The DSC curves of the thermal decomposition process were measured by a STA 449 F3 synchronous thermal analyzer manufactured by NETZSCH, Germany. The experimental atmosphere was air, the temperature range was 600–900 °C and the sample mass was 4 mg. The cooling rates (Φ) were 5 °C min−1, 10 °C min−1, 15 °C min−1 and 20 °C min−1, respectively.
1) was adopted as the chelating agent. In the mixing process, the nitrates were dissolved in 50 ml nitric acid solution. EDTA was dissolved in 25 ml ammonia water, and then the two solutions were mixed to obtain a blue transparent solution. The pH value of the solution was maintained at about 7. Afterwards, 3 wt% 15 ml hydroxyethyl cellulose (HEC) solution was added into the above solution and stirred to obtain the precursor solution. The gel was obtained through heating the solution at 90 °C for 1.5 h and then at 110 °C for 1 h. Finally, the gel was heated, and with the increased temperature, the gel spontaneously burned to form dark brown fluffy precursor powders. The precursor powders were sintered at 850 °C for 3 h to obtain black Bi2212 superconducting powders. The raw powders were carefully grounded as original material for thermogravimetric analysis. The DSC curves of the thermal decomposition process were measured by a STA 449 F3 synchronous thermal analyzer manufactured by NETZSCH, Germany. The experimental atmosphere was air, the temperature range was 600–900 °C and the sample mass was 4 mg. The cooling rates (Φ) were 5 °C min−1, 10 °C min−1, 15 °C min−1 and 20 °C min−1, respectively.
The prepared Bi2212 raw powders were pressed into small pieces at 300 Ma pressure, and then heated at 850 °C, 870 °C, 875 °C and 880 °C for 20 min, respectively. The cooled crystal samples obtained at a cooling rates of 5 °C min−1 labeled as J0, J1, J2, and J3, respectively. Finally, samples J0–J3 were simultaneously annealed at 820 °C for 2 h. The crystal structure and phase composition of the samples were characterized by a X-ray diffractometer (XRD, Rigaku-D/max-A) using Cu-Kα radiation with 2θ ranging from 3° to 60°. The surface morphologies of the samples were examined by field emission scanning electron microscopy (FESEM, Ultra Plus). The elemental quantitative analysis of samples was analyzed by field emission electron probe microanalyzer (FE-EPMA, JXA-8530F). The temperature dependence of the resistance (R–T) was determined by a Quantum Design Physical Property Measurement System (PPMS, Dynacoo1-9) with 9 T magnetic field. The magnetic hysteresis (M–H) and the magnetization vs. temperature (M–T) in field-cooling (FC) were measured in 100 Oe by a superconducting quantum interference device magnetometer (MPMS3) with 7 T magnetic field, and the direction of the magnetic field was parallel to the length of the samples.
3. Results and discussion
3.1 X-ray diffraction investigations
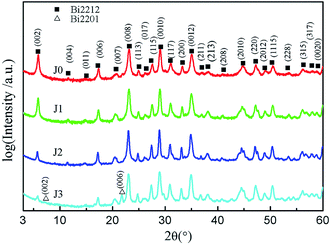
Fig. 1 exhibits the XRD patterns of samples J0–J3, which shows Bi2212 single phase for samples J0, J1 and J2, whilst a small amount of Bi2201 phase for sample J3. Most of the strong diffraction peaks are (00l) peaks, which implies that the electrical transport measurement mainly reflects the ab surface resistance characteristics of the Bi2212 superconductor. This is because, the growth rate of the ab plane is 1000 times that of the c-axis when Bi2212 grains grow. Therefore, when sheet structure Bi2212 grains with various orientations are extruded by external force, these sheet structures are liable to c-axis orientation. Compared with sample J0, the full width at half maxima (FWHM) of samples J1 and J2 decreases and their grain size increases, which indicates an improved crystallization. Due to the high sintering temperature, a part of the Bi2212 phase of sample J3 is decomposed into Bi2201 phase, which results in the degradation of crystallization. Detailed crystallographic properties of all samples are listed in Table 1.| Samples ID | (002) FWHM (°) | Grain size (nm) | (115) FWHM (°) | Grain size (nm) |
|---|---|---|---|---|
| J0 | 0.279 | 30.6 | 0.310 | 27.9 |
| J1 | 0.262 | 32.9 | 0.272 | 32.3 |
| J2 | 0.239 | 36.6 | 0.235 | 38.5 |
| J3 | 0.282 | 30.2 | 0.278 | 31.5 |
3.2 FESEM and FE-EPMA investigations
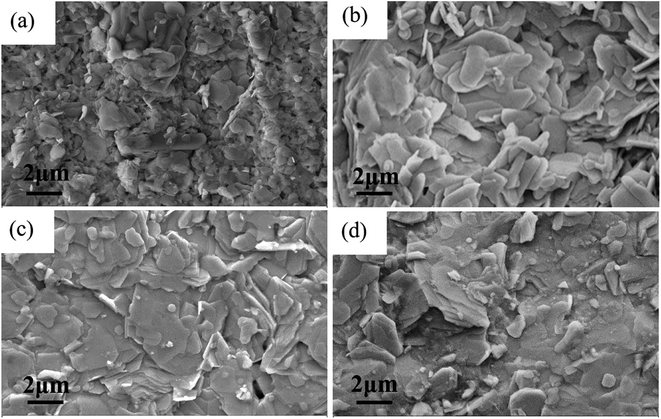
The FESEM images of the samples are shown in Fig. 2. The grains of samples J0–J3 are typical sheet structures, which are characterized by the anisotropic growth of Bi2212 crystal. This is consistent with the two-dimensional growth mechanism obtained by kinetic analysis as will be discussed later. Compared with sample J0, the number of grain boundaries of samples J1 and J2 and sample J3 is reduced after the crystallization treatment and samples J1–J3 have a better compactness. Table 2 lists the composition analysis of the samples by FE-EPMA. It can be seen that the Sr and Ca element components have slightly decreased with the increasing temperature, but the integrity of the Bi2212 phase is still maintained.| Samples ID | Bi (at%) | Sr (at%) | Ca (at%) | Cu (at%) | Proportion |
|---|---|---|---|---|---|
| J0 | 11.16 | 11.11 | 5.25 | 10.54 | 2.12![[thin space (1/6-em)]](https://www.rsc.org/images/entities/char_2009.gif) : :![[thin space (1/6-em)]](https://www.rsc.org/images/entities/char_2009.gif) 2.11 2.11![[thin space (1/6-em)]](https://www.rsc.org/images/entities/char_2009.gif) : :![[thin space (1/6-em)]](https://www.rsc.org/images/entities/char_2009.gif) 1.00 1.00![[thin space (1/6-em)]](https://www.rsc.org/images/entities/char_2009.gif) : :![[thin space (1/6-em)]](https://www.rsc.org/images/entities/char_2009.gif) 2 2 |
| J1 | 12.38 | 10.64 | 5.47 | 11.56 | 2.14![[thin space (1/6-em)]](https://www.rsc.org/images/entities/char_2009.gif) : :![[thin space (1/6-em)]](https://www.rsc.org/images/entities/char_2009.gif) 1.84 1.84![[thin space (1/6-em)]](https://www.rsc.org/images/entities/char_2009.gif) : :![[thin space (1/6-em)]](https://www.rsc.org/images/entities/char_2009.gif) 0.95 0.95![[thin space (1/6-em)]](https://www.rsc.org/images/entities/char_2009.gif) : :![[thin space (1/6-em)]](https://www.rsc.org/images/entities/char_2009.gif) 2 2 |
| J2 | 13.16 | 10.49 | 5.45 | 11.63 | 2.26![[thin space (1/6-em)]](https://www.rsc.org/images/entities/char_2009.gif) : :![[thin space (1/6-em)]](https://www.rsc.org/images/entities/char_2009.gif) 1.8 1.8![[thin space (1/6-em)]](https://www.rsc.org/images/entities/char_2009.gif) : :![[thin space (1/6-em)]](https://www.rsc.org/images/entities/char_2009.gif) 0.94 0.94![[thin space (1/6-em)]](https://www.rsc.org/images/entities/char_2009.gif) : :![[thin space (1/6-em)]](https://www.rsc.org/images/entities/char_2009.gif) 2 2 |
| J3 | 14.15 | 11.52 | 6.15 | 12.13 | 2.33![[thin space (1/6-em)]](https://www.rsc.org/images/entities/char_2009.gif) : :![[thin space (1/6-em)]](https://www.rsc.org/images/entities/char_2009.gif) 1.9 1.9![[thin space (1/6-em)]](https://www.rsc.org/images/entities/char_2009.gif) : :![[thin space (1/6-em)]](https://www.rsc.org/images/entities/char_2009.gif) 1.01 1.01![[thin space (1/6-em)]](https://www.rsc.org/images/entities/char_2009.gif) : :![[thin space (1/6-em)]](https://www.rsc.org/images/entities/char_2009.gif) 2 2 |
3.3 Non-isothermal crystallization kinetics
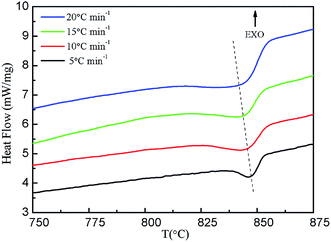 | ||
| Fig. 3 Non-isothermal crystalline DSC curves of sample Bi2212 superconductors with different cooling rates. | ||
By analyzing the DSC curves, the parameters of Bi2212 superconductors during non-isothermal crystallization can be obtained, including the crystallization start temperature (T0), the crystallization peak temperature (Tp), the crystallization termination temperature (T∞) and the corresponding crystallization enthalpy (ΔHc). The corresponding parameters with different cooling rates are listed in Table 3.
| Φ (°C min−1) | T0 (°C) | Tp (°C) | T∞ (°C) | ΔHc (J g−1) | T1/2 (°C) | t1/2 (min) |
|---|---|---|---|---|---|---|
| 5 | 853 | 846 | 827 | 64.4 | 844 | 1.70 |
| 10 | 853 | 843 | 821 | 62.9 | 841 | 1.25 |
| 15 | 852 | 840 | 816 | 52.7 | 838 | 0.95 |
| 20 | 852 | 831 | 804 | 50.4 | 835 | 0.90 |
As shown in Table 3, T0 decreases slowly with the increasing cooling rate, Tp decreases from 846 °C to 831 °C, and ΔTc increases from 7 °C to 21 °C i.e. the width of the crystallization peaks increases with the increase in cooling rate, which is mainly determined by the relaxation characteristics of molecular motion. The irregular molecule in the melting state during the crystallization process needs a certain time to adjust its conformation in order to enter the regular lattice, which leads to a lag period in the cooling crystallization process. A faster cooling rate significantly reduces the mobility of the molecule, which results in longer relaxation times, and thus both nucleation and crystal growth become sluggish. Not only are T0 and Tp transferred to the lower-temperature region, but also a wider supercooling zone is formed, and the lag period is prolonged correspondingly. On the contrary, when the cooling rate is slow, the molecule has a strong ability to move, which accelerates the crystallization process, and the crystallization proceeds in the high-temperature region. The crystallization enthalpy (ΔHc) decreases with the increase in the cooling rate.
In the crystallization process, the relative crystallinity (Xt) of the sample at a certain temperature is proportional to ΔHc, which is related to the proportion of the area of the crystallization peaks. The Xt at any temperature (T) can be described as follows:17
 | (1) |
| t = (T0 − T)/Φ | (2) |
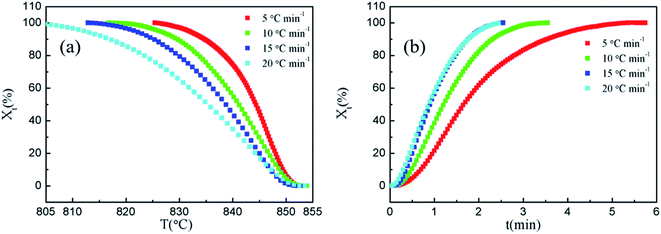
Fig. 4(a) and Fig. 4(b) show the relationships between relative crystallinity and temperature, and relative crystallinity and time with different cooling rates, respectively. Fig. 4(a) and Fig. 4(b) show that the curves are anti-S-shaped and S-shaped, respectively, and the curves change to relatively flat plateaus at the ending stage of crystallization. As shown in Fig. 4(a), the crystallization temperature increases with the decrease in cooling rates. As can be seen in Fig. 4(b), as the cooling rates increase, the time range required to achieve the same relative crystallinity is significantly narrowed, and the time tmax required for the superconducting material to reach maximum crystallinity decreases, indicating that the cooling rate is the main factor which affects the crystallization rate under specific experimental conditions.
The crystallization rates parameters of Bi2212 superconductor with different cooling rates are also listed in Table 3, where the T1/2 is semi-crystallization temperature and t1/2 is semi-crystallization time. It can be seen that both T1/2 and t1/2 decrease with the increase in cooling rate, indicating that the increase in cooling rate can significantly accelerate the crystallization rate of the system, which is mainly due to the decrease in the nucleation and growth time of Bi2212 superconductor as the cooling rate increases.
ln[−ln(1 − Xt)] = n![[thin space (1/6-em)]](https://www.rsc.org/images/entities/char_2009.gif) ln ln![[thin space (1/6-em)]](https://www.rsc.org/images/entities/char_2009.gif) t + Φ t + Φ![[thin space (1/6-em)]](https://www.rsc.org/images/entities/char_2009.gif) ln(Zc) ln(Zc)
| (3) |
ln![[thin space (1/6-em)]](https://www.rsc.org/images/entities/char_2009.gif) Zc = ln Zc = ln![[thin space (1/6-em)]](https://www.rsc.org/images/entities/char_2009.gif) Zt/Φ Zt/Φ
| (4) |
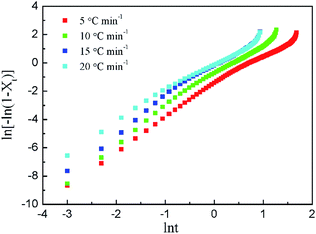
It can be seen from eqn (3) that there is a linear relationship between ln[−ln(1−Xt)] and ln![[thin space (1/6-em)]](https://www.rsc.org/images/entities/char_2009.gif) t. The Zc and n can be obtained from the curve of ln[−ln(1−Xt)] versus ln
t. The Zc and n can be obtained from the curve of ln[−ln(1−Xt)] versus ln![[thin space (1/6-em)]](https://www.rsc.org/images/entities/char_2009.gif) t. The curves of ln[−ln(1−Xt)] versus ln
t. The curves of ln[−ln(1−Xt)] versus ln![[thin space (1/6-em)]](https://www.rsc.org/images/entities/char_2009.gif) t and the corresponding data with different Φ are shown in Fig. 5 and Table 4, respectively.
t and the corresponding data with different Φ are shown in Fig. 5 and Table 4, respectively.
| Φ (°C min−1) | n | Zt | Zc |
|---|---|---|---|
| 5 | 2.39 | 0.23 | 0.75 |
| 1.66 | 0.30 | 0.78 | |
| 10 | 2.59 | 0.56 | 0.94 |
| 2.02 | 0.44 | 0.92 | |
| 15 | 2.57 | 1.12 | 1.00 |
| 1.88 | 0.82 | 0.98 | |
| 20 | 2.23 | 1.32 | 1.01 |
| 1.77 | 0.86 | 0.99 |
It can be seen from Fig. 5 that there is a good linear relationship between ln[−ln(1−Xt)] and ln![[thin space (1/6-em)]](https://www.rsc.org/images/entities/char_2009.gif) t in the pre-crystallization stage at different cooling rates, and then the linear relationship gradually deviates, indicating that there is also a secondary crystallization phenomenon during the non-isothermal crystallization process. That is to say, the crystallization process can be divided into two processes with different slopes, i.e. primary crystallization and secondary crystallization.
t in the pre-crystallization stage at different cooling rates, and then the linear relationship gradually deviates, indicating that there is also a secondary crystallization phenomenon during the non-isothermal crystallization process. That is to say, the crystallization process can be divided into two processes with different slopes, i.e. primary crystallization and secondary crystallization.
As shown in Table 4, the non-isothermal crystallization kinetic parameter Zc increases with the increase in the cooling rate during both the primary crystallization and the secondary crystallization stages. Faster crystallization rate indicates that the nucleation rate becomes larger and the crystal grows faster as the cooling rate increases. However, when the cooling rate is too fast, the temperature of the system is low, and thus both the molecular activity and the diffusion rate are lowered, resulting in a slowing effect on the crystallization rate.
In the primary crystallization stage, the slopes of the straight line (n) are 2.23–2.59. The n values higher than 2 indicate the growth of small particles with an increasing nucleation rate.28 Compared with the primary crystallization rate, the secondary crystallization rate is significantly slower, and the n values are 1.66–2.02. The primary crystallization is controlled by nucleation, and the growth rate of the crystal changes with time. In the stage of secondary crystallization, the crystallization process is controlled by diffusion, and the growth rate is slowed down. Theoretically, n should be an integer, but the n values of all samples are not. It may be affected by the secondary crystallization, coexisting of two nucleation methods, density change of the samples, and even the factors in the experimental process (such as the determination of the crystallization starting point). However, the n value is always around 2 regardless of the cooling rates.
The Avrami exponent related to the nucleation mechanism and growth mode is the sum of the space dimension and time dimension of nucleation growth. Crystallization nucleation is generally divided into heterogeneous nucleation and homogeneous nucleation. Heterogeneous nucleation is usually formed by incompletely melted crystals or foreign impurities, which is instantaneous nucleation. Therefore, it has nothing to do with time, and n does not contain the time dimension. Homogeneous nucleation is the nucleation of the molecule through thermal movement, which is time-dependent, so n should include the time dimension. According to the above principles, the n values of crystals with different growth types and nucleation modes are listed in Table 5.
| Growth type | Homogeneous Nucleation | Heterogeneous Nucleation |
|---|---|---|
| One-dimensional growth | n = 1 + 1 = 2 | n = 1 + 0 = 1 |
| Two-dimensional growth | n = 2 + 1 = 3 | n = 2 + 0 = 2 |
| Three-dimensional growth | n = 3 + 1 = 4 | n = 3 + 0 = 3 |
The crystallization of the oxide high-temperature superconductors grown by heterogeneous nucleation of the solid phase and the liquid phase, and considering that the n value is about 2, the growth of the Bi2212 superconductor is mainly the two-dimensional growth mechanism.17
ln![[thin space (1/6-em)]](https://www.rsc.org/images/entities/char_2009.gif) Zt + n Zt + n![[thin space (1/6-em)]](https://www.rsc.org/images/entities/char_2009.gif) ln ln![[thin space (1/6-em)]](https://www.rsc.org/images/entities/char_2009.gif) t = ln t = ln![[thin space (1/6-em)]](https://www.rsc.org/images/entities/char_2009.gif) KT − m KT − m![[thin space (1/6-em)]](https://www.rsc.org/images/entities/char_2009.gif) ln ln![[thin space (1/6-em)]](https://www.rsc.org/images/entities/char_2009.gif) Φ Φ
| (5) |
The simplification of eqn (5) can be obtained as follows:
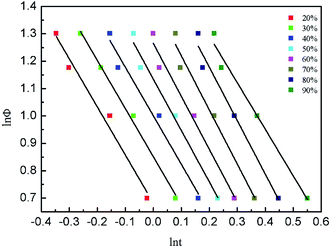
ln![[thin space (1/6-em)]](https://www.rsc.org/images/entities/char_2009.gif) Φ = ln Φ = ln![[thin space (1/6-em)]](https://www.rsc.org/images/entities/char_2009.gif) F(T) − a F(T) − a![[thin space (1/6-em)]](https://www.rsc.org/images/entities/char_2009.gif) ln ln![[thin space (1/6-em)]](https://www.rsc.org/images/entities/char_2009.gif) t t
| (6) |
Fig. 6 shows the linear curves of ln![[thin space (1/6-em)]](https://www.rsc.org/images/entities/char_2009.gif) Φ–ln
Φ–ln![[thin space (1/6-em)]](https://www.rsc.org/images/entities/char_2009.gif) t, indicating that the Mo method is suitable for describing the crystallization behavior of Bi2212 superconductor. The F(T) and a values obtained by linear fitting are listed in Table 6.
t, indicating that the Mo method is suitable for describing the crystallization behavior of Bi2212 superconductor. The F(T) and a values obtained by linear fitting are listed in Table 6.
| Xt (%) | a | F(T) |
|---|---|---|
| 20 | 1.75 | 4.79 |
| 30 | 1.76 | 7.08 |
| 40 | 1.77 | 10.00 |
| 50 | 1.88 | 13.49 |
| 60 | 1.93 | 18.62 |
| 70 | 1.98 | 26.30 |
| 80 | 1.95 | 37.15 |
| 90 | 1.70 | 42.66 |
As shown in Table 6, a values are always greater than 1, indicating that each n is greater than m. In addition, as the relative crystallinity increases, F(T) increases with relative crystallinity, indicating that it is necessary to increase the cooling rate when the system reaches a certain crystallinity per unit time.17
3.4 Superconducting properties
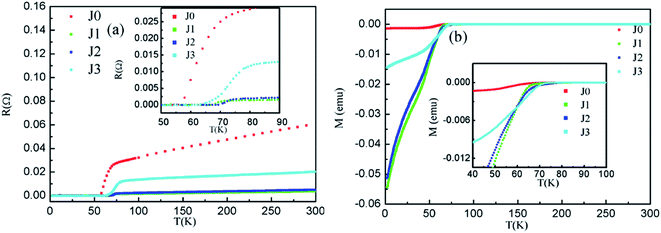
The electronic transport properties and magnetic properties of the samples are shown in Fig. 7(a) and (b), respectively. The detailed parameters are listed in Table 7. As shown in Fig. 7(a), the T(c,onset) and T(c,zero) of sample J0 are 73.1 K and 63.2 K, respectively. Besides, the Tc values of samples J1–J3 are correspondingly improved compared with that of sample J0. The connectivity of samples J1–J3 becomes better due to the reduced number of grain boundaries after the cooling crystallization process. So the Tc values of samples J1–J3 are increased. Sample J3 has the highest T(c,onset) of 80.1 K and the largest ΔTc of 11.6 K, which may have originated from the degraded crystallization caused by the part decomposition of the Bi2212 phase into the Bi2201 phase at the excessive temperature. Although sample J2 has a lower T(c,onset) than that of sample J3, its T(c,zero) of 70.1 K is better than those of the other samples. The M–T curve exhibited good diamagnetism of all the samples as shown in Fig. 7(b). Also, the Tc values are substantially consistent with those of the R–T curves.| Samples ID | T(c,onset) (K) | T(c,zero) (K) | ΔTc (K) |
|---|---|---|---|
| J0 | 73.1 | 63.2 | 9.9 |
| J1 | 73.2 | 68.4 | 4.8 |
| J2 | 76.2 | 70.1 | 6.1 |
| J3 | 80.1 | 68.5 | 11.6 |
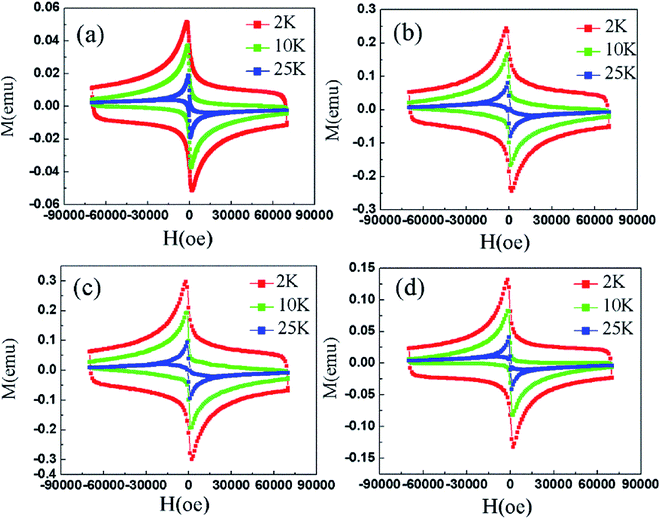
Fig. 8 shows the M–H curves of samples between the applied fields of ±7 T at 2 K, 10 K and 25 K, respectively. Magnetic hysteresis in high-temperature superconductors provides important information such as critical current density, energy required to completely destroy superconductivity, residual magnetization (MR) values, and pinning strength.11 All samples exhibit large hysteresis loops at 2 K, indicating that the samples have good and uniform superconductivity. However, it can be seen that the shapes of the M–H curves change for T = 25 K. Especially at high magnetic fields, any hysteresis in the M–H curves was not observed.28
The critical current density is one of the most important criteria for judging the conductivity of a superconductor. The critical current density directly determines the quality of the superconductor. Based on the measured hysteresis loops, the critical current density of all the samples were calculated by the Bean model. Since the samples are rectangular cylinders, all Bean models can be simplified to the following formula (7):28
 | (7) |
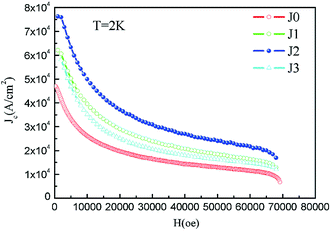 | ||
| Fig. 9 Calculated critical current densities of samples J0–J3 at 2 K as a function of applied field. | ||
4. Conclusions
Herein, Bi2212 superconductors were prepared by Pechini sol–gel method. The structural, thermal and transport properties of the prepared samples were investigated. The crystallization treatment at different temperatures provided the sheet growth of Bi2212 superconductor with high phase purity; meanwhile, the FE-EPMA results further indicated Bi2212 as the major phase. The results showed that, the connectivity of the samples became better due to the reduced number of grain boundaries after the cooling crystallization process. Besides, the non-isothermal crystallization data were analyzed by Jeziorny and Mo method. These two methods successfully described the crystallization kinetics of Bi2212 superconductor under non-isothermal conditions. The n was obtained and the two-dimensional sheet growth mechanism of Bi2212 superconductor was determined. The non-isothermal crystallization kinetic parameter Zc increased with the increase in the cooling rate, and the crystallization parameter F(T) increased with the increase in crystallinity. F(T) was 4.79 and 42.66 when the crystallinity was 20% and 90%, respectively. Sample J3 had the highest T(c,onset) of 80.1 K which was higher than the 70.1 K value determined for sample J0. Sample J2 had the best T(c,zero) of 70.1 K which was higher than that of sample J0 of 63.2 K. The maximum calculated Jc was 7.62 × 10⁴ A cm−2 at 2 K for sample J2 which was higher than the 4.70 × 10⁴ A cm−2 value determined for sample J0. The present results provide an advantageous method for improving the performance of superconducting materials.Conflicts of interest
There are no conflicts to declare.Acknowledgements
This work was supported by China Postdoctoral Science Foundation (No. 2018M631801) and Postdoctoral Foundation of Northeastern University (No. 20180301).References
- R. Cortés, L. Rettig, Y. Yoshida, H. Eisaki, M. Wolf and U. Bovensiepen, Phys. Rev. Lett., 2011, 107, 097002 CrossRef.
- X. M. Lu, T. L. Wang and Y. Qi, J. Sol-Gel Sci. Technol., 2016, 77, 100–108 CrossRef CAS.
- U. H. Pi, Z. G. Khim, D. H. Kim, A. Schwarz, M. Liebmann and R. Wiesendanger, Phys. Rev. B: Condens. Matter Mater. Phys., 2004, 69, 094518 CrossRef.
- O. Nane, B. Özçelik and D. Abukay, Ceram. Int., 2016, 42, 5778–5784 CrossRef CAS.
- G. Yildirim, M. Dogruer, F. Karaboga and C. Terzioglu, J. Alloys Compd., 2014, 584, 344–351 CrossRef CAS.
- S. Oh, T. A. Crane, D. J. Van Harlingen and J. N. Eckstein, Phys. Rev. Lett., 2006, 96, 107003 CrossRef.
- M. J. Kramer, J. W. Farmer and S. R. Arrasmith, IEEE Trans. Appl. Supercond., 2002, 3, 1186–1189 Search PubMed.
- Q. Li, Y. N. Tsay, M. Suenaga, G. Wirth, G. D. Gu and N. Koshizuka, IEEE Trans. Appl. Supercond., 2002, 9, 2026–2029 Search PubMed.
- N. Boussouf, M. F. Mosbah, A. Amira, A. Varilci, S. P. Altintas and M. Guerioune, J. Supercond. Novel Magn., 2013, 26, 1105–1109 CrossRef CAS.
- Y. Zhang, H. Z. Yang, M. l. Li, B. Z. Sun and Y. Qi, CrystEngComm, 2010, 12, 3046–3051 RSC.
- B. Özkurt, J. Alloys Compd., 2013, 579, 132–137 CrossRef.
- H. Zhuang, H. Kozuka and S. Sakka, Jpn. J. Appl. Phys., 1989, 28, 1805–1808 CrossRef.
- O. Kizilaslan, G. Kirat and M. A. Aksan, J. Magn. Magn. Mater., 2015, 384, 186–191 CrossRef CAS.
- P. Z. Zhou, Y. F. Zhang and X. F. Lin, J. Therm. Anal. Calorim., 2019, 136, 749–757 CrossRef CAS.
- J. E. K. Schawe, Polymer, 2019, 167, 167–175 CrossRef CAS.
- S. Mahalakshmi, T. Alagesan, V. Parthasarathy, K. L. Tung and R. Anbarasan, J. Polym. Res., 2019, 26, 132 CrossRef.
- Y. F. Li, L. B. Duan, L. Cheng, Y. Yang, Y. C. Li, Y. Cheng and D. M. Song, J. Therm. Anal. Calorim., 2019, 135, 2843–2848 CrossRef CAS.
- F. Bao, G. Z. Zhang and S. H. Jin, J. Therm. Anal. Calorim., 2018, 131, 3185–3191 CrossRef CAS.
- B. X. Liu, G. S. Hu, J. T. Zhang and W. Yan, RSC Adv., 2019, 9, 7057–7064 RSC.
- M. A. Aksan and M. E. Yakinci, J. Alloys Compd., 2007, 433, 22–32 CrossRef CAS.
- M. A. Aksan, M. E. Yakinci and Y. Balci, J. Therm. Anal. Calorim., 2005, 81, 417–423 CrossRef CAS.
- H. Koralay, F. Yakuphanoglu, S. Cavdar, A. Günen and E. Aksu, Phys. B, 2005, 355, 64–71 CrossRef CAS.
- X. P. Chen, X. W. Yu, J. P. Zhang, M. Y. Li, H. B. Sun and Q. Liu, Solid State Sci., 2011, 13, 2165–2171 CrossRef CAS.
- A. Arslan, H. Koralay, Ş. Çavdar and A. Günen, J. Non-Cryst. Solids, 2012, 358, 1190–1195 CrossRef CAS.
- O. Ozturk, T. Gokcen, S. Cavdar, H. Koralay and A. T. Tasci, J. Therm. Anal. Calorim., 2016, 123, 1073–1082 CrossRef CAS.
- T. l. Wang, X. M. Zhao, H. Z. Yang and Y. Qi, Ceram. Int., 2018, 44, 12144–12148 CrossRef CAS.
- X. Q. Liu, G. Y. Zhao, L. Li, X. X. Fang and J. Q. Jia, Mater. Chem. Phys., 2018, 216, 153–157 CrossRef CAS.
- O. Kizilaslan, G. Kirat and M. A. Aksan, J. Magn. Magn. Mater., 2015, 384, 186–191 CrossRef CAS.
| This journal is © The Royal Society of Chemistry 2019 |

