 Open Access Article
Performance of graphite felt as a cathode and anode in the electro-Fenton process
Junfeng Li *a,
Dongbao Songa,
Keqing Dua,
Zhaoyang Wangbcd and
Chun Zhaoacd
aCollege of Water Conservancy and Architecture Engineering, Shihezi University, Shihezi 832000, Xinjiang, China. E-mail: ljfshz@126.com; Tel: +86-152-9992-1362
bCollege of Earth and Environmental Science, Lanzhou University, Lanzhou 730000, PR China
cSchool of Urban Construction and Environmental Engineering, Chongqing University, Chongqing 400001, China
dKey Laboratory of the Three Gorges Reservoir Region's Eco-Environment, Ministry of Education, Chongqing University, Chongqing 400045, China
First published on 25th November 2019
Abstract
Choosing an electrode material with good performance and low cost is of great significance for the practical application of the electro-Fenton process. In this study, graphite felt was systematically studied to determine its application performance in an electro-Fenton system. The influence of operating parameters, pH and voltage, on the H2O2 yield and the evolution of iron ions was investigated, which helped to select the optimal parameter values. The removal rate of methylene blue was 97.8% after 20 min electrolysis under the conditions of 7 V voltage and pH 3. Inhibition experiments showed the graphite felt E-Fenton system mainly relied on the indirect oxidation of ·OH and the direct oxidation of the graphite felt anode to degrade the methylene blue. The graphite felt showed good stability as a cathode during repeated use, but the anode conductivity and catalytic performance were decreased, and the adsorption performance was enhanced. Finally, the graphite felt electrode was characterized by scanning electron microscopy (SEM), X-ray diffraction (XRD), Brunauer–Emmett–Teller (BET) and X-ray photoelectron spectroscopy (XPS) to preliminarily analyze the reason for the change in anode performance.
1. Introduction
In recent years, the electrochemical advanced oxidation process (EAOPS) has been developed for the prevention and remediation of environmental pollution, especially for water treatment.1 The core of EAOPs is a series of physical processes and chemical reactions to generate the hydroxyl radicals (·OH). ·OH has a strong oxidation potential (2.87 V), which is second only to F (2.87 V).2 ·OH can oxidize the vast majority of organic pollutants in wastewater to CO2, H2O and inorganic ions.3 As a kind of environmentally friendly electrochemical advanced oxidation process, electro-Fenton (E-Fenton) technology is highly favoured to treat wastewater because of its advantages, such as high utilization rate of H2O2 and Fe2+, process cleaning, low sludge residue and low investment cost.4| O2 + 2H+ + 2e− → H2O2 | (1) |
| Fe2+ + H2O2 → Fe3+ + ·OH + OH− | (2) |
| RH + ·OH → H2O + ·R⋯H2O + CO2 | (3) |
| Fe3+ + e− → Fe2+ | (4) |
In the E-Fenton system, O2 can react with H+ at the cathode to generate H2O2 (eqn (1)), and then H2O2 reacts with Fe2+ to produce the ·OH oxidizing organic pollutants (eqn (2) and (3)).5,6 Compared with traditional Fenton technology, one of the advantages of E-Fenton technology is to eliminate the trouble of adding H2O2 and avoiding the potential danger of H2O2 storage and transportation.7,8 Another advantage of E-Fenton technology is that Fe2+ can be regenerated at the cathode, which greatly reduces the production of iron sludge.9,10 It can be seen that studying the evolution of iron ions and the production of H2O2 are of great significance for further understanding and regulation of E-Fenton technology. pH and voltage are two important factors affecting the evolution of iron ions and the production of H2O2. However, people are more concerned with the effect of iron ion dosage, pH and voltage on the removal rate of pollutants, no further consideration is given to the effects of iron ions evolution and H2O2 production.11,12 There are also many scholars who regulate the production of H2O2, but their purpose is to maximize H2O2 production through technical regulation.13,14 Therefore, the relationship between H2O2 production, iron ion evolution, and contaminant removal rate needs further study. In addition, choosing an electrode material with good performance is a problem that troubles the practical popularization of E-Fenton technology.15 Most of the anodes choose Pt, BDD, etc; however, they are rarely used for practical purposes because of their high cost.1,16 Since both H2O2 production and iron ion regeneration occur at the cathode, most people choose carbon-based three-dimensional electrode materials for the cathode, such as graphite felt,17 carbon felt,18 carbon sponges and activated carbon fibres.19,20 Some researchers have modified three-dimensional electrode materials to improve the application performance. For example, Ganiyu et al. used FeIIFeIII LDH modified carbon felt cathode to achieve efficient metronidazole removal over a wide pH range.21
Compared with two-dimensional electrodes, three-dimensional electrodes have the advantages of counteracting the limitations of the low space-time yield and low normalized space velocity from electrochemical processes.22 Some researchers also used three-dimensional electrode materials as anodes. For example, Yi et al. used activated carbon fiber as the anode to degrade the alizarin red S (ARS) dye, and believed that there is synergy between adsorption and electrochemical oxidation during electrolysis.23 Since the functions of the anode and the cathode are different in the E-Fenton system, the three-dimensional electrode material as the cathode and the anode to construct the E-Fenton system to degrade the pollutants need to be further studied. However, there are few reports using three-dimensional electrode materials as the cathode and anode in the E-Fenton system to degrade pollutants. Considering that the E-Fenton process is developed for long-term and large-scale applications, the stability of the electrode is important for determining the performance of the EF process. Zhou et al. evaluated the stability of anodized GF electrode for p nitrophenol degradation in 10-times continuous runs, and the TOC removal efficiency decreased within 15%.24 However, the running time of these tests are not long enough.13 How to deal with these scrapped electrodes is another issue to consider after the electrodes lose their electrochemical properties, so a lot of repeated experiments are needed to determine the changes in their performance.
Therefore, this study selected three-dimensional electrode material graphite felt as the cathode and anode to degrade the methylene blue, graphite felt was systematically studied to determine its application performance in the electro-Fenton system. To highlight the influence of operating parameters, the evolution of the iron ions and the effects of voltage and pH on H2O2 production were studied. The experimental data of methylene blue degradation were fitted, and a kinetic model was established. The degradation mechanism for the graphite felt E-Fenton system was studied in detail. Finally, a repeated use experiment was carried out to determine the change of performance of the graphite felt electrode before and after use.
2. Materials and methods
2.1 Materials
Analytical grade methylene blue (7220-79-3, 99%), methanol (67-56-1, 99.5%), FeSO4·7H2O (7782-63-0, >99%) and Na2SO4 (7757-82-6, >99%) were purchased from Shengao Chemical Industry, China. These reagents and dyes were directly used without any further purification. All solutions were prepared with ultrapure water (resistivity of 18.20 MΩ). Graphite felt was purchased from Tianjin Carbon Factory, China, which was cut into 12 × 1.5 × 0.5 cm pieces. During the experiment, the graphite felt was immersed in water at a depth of 6 cm. Graphite felt was washed with ultrapure water and then dried at 378.15 K for 24 h.2.2 Reactor and degradation experiments
Batch studies were performed in a columnar vessel (diameter of 90 mm, height of 160 mm). Then, 500 mL of 20 mg L−1 methylene blue solution was taken for every study. Both the electrodes (anode and cathode) were graphite felt with an effective area of 25 cm2. Continuous aeration to the cathode was performed using a fish aerator during the experiment. The graphite felt electrode was kept parallel and the spacing between plates was 4.0 cm. The pH was adjusted using 0.1 M H2SO4. Na2SO4 was used as the supporting electrolyte. A constant voltage was applied across the electrodes using a DC power supply. If no special instructions were given, all the voltages in the experiment are cell voltages. All experiments were conducted at room temperature (293.15 + 2 K).2.3 Analytical methods
H2O2 and iron ions were sampled from the reactor every 5 minutes during the experiment. Methylene blue was sampled from the reactor every 1 min during the experiment. The concentration of H2O2 was analysed by a UV-vis spectrophotometer at 400 nm using the potassium titanium(IV) oxalate method.25 The concentrations of total iron and Fe2+ were determined by the 1,10-phenanthroline spectrophotometric method (λ = 510 nm).26 The Fe3+ was determined by subtraction of total iron minus Fe2+ concentrations.15 The methylene blue concentration at 664 nm was determined using an ultraviolet spectrophotometer. The ultraviolet spectrophotometer was purchased from HACH Company, Germany. Relative error of all experimental data was less than 1.5%.2.4 Characterization of the GF
The surface morphology was characterized by scanning electron microscopy (SEM, Hitachi S-470). The crystal structure of the catalysts was characterized via X-ray diffraction (XRD, Rigaku MiniFlex 600). The surface OGs were analyzed by X-ray photoelectron spectroscopy (XPS) analysis. XPS was obtained with an AXIS-Ultra electron spectrometer (Shimadzu, Japan). The specific surface area and pore volume were analyzed via N2 adsorption/desorption using the BET and t-plot method with a Novaeseries (Quantachrome Co., USA).2.5 Electric energy per order
The EE/O can be calculated using eqn (5).
 | (5) |
3. Results and discussion
3.1 Electrochemical generation of H2O2
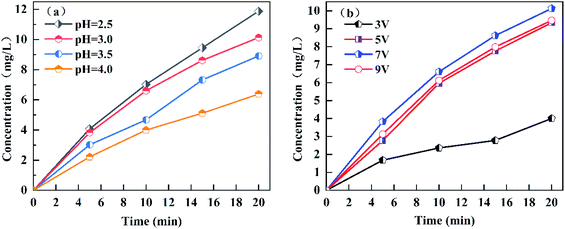
Compared with the traditional Fenton process, the E-Fenton process has the ability to produce H2O2 in situ; thus, the study of H2O2 generation is of great significance for understanding and regulation the E-Fenton process. The effect of pH and voltage on the yield of H2O2 was investigated in this study. We performed continuous aeration at the cathode using a fish aerator during the experiment. Since Fe2+ has a catalytic effect on H2O2, Fe2+ was not added. The catalytic effect of iron was lost, and the Fenton reaction stopped during the electrolysis.15 Fig. 1a showed that the yield of H2O2 decreased as the pH increased, which is consistent with the study of Lei Zhou et al.27 According to eqn (1), acid environment is a necessary condition for generating H2O2. The higher the pH value, the lower the concentration of H+ in the solution. Therefore, as the pH increased, the yield of H2O2 gradually decreased. Fig. 1b showed that as the voltage increased, the yield of H2O2 increased and then reached a maximum when the voltage was 7 V. However, the yield decreased when the voltage was continuously increased to 9 V. According to Faraday's law, the current density increases as the voltage increases, which leads to an increase in H2O2 yield. However, when the current intensity is too high, the oxidation rate of H2O2 will increase. H2O2 can be oxidized to ·HO2 and H+ on the surface of the anode. ·HO2 is unstable and further decomposes into H+ and O2 (eqn (6) and (7)).28,29 Safizadeh et al. suggested that excessive voltage will lead to the aggravation of the hydrogen evolution reaction (eqn (9)), and the hydrogen evolution reaction will reduce the concentration of H+ per unit volume in solution.30 In addition, the reduction of O2 by a carbon electrode mainly occurs via 2 electrons or 4 electrons.31 The 2-electron reaction can produce H2O2 (eqn (1)), and the 4-electron reaction can produce H2O (eqn (8)). The 4-electron side reaction will lead to a decrease in H2O2 yield under certain conditions of the solute.After 20 min of reaction, the removal rates of methylene blue at voltages 3, 5, 7 and 9 V were 86.55%, 96.16%, 97.80% and 90.33%, respectively. The highest removal rate of methylene blue was obtained at voltage 7 V. This conclusion was consistent with the highest H2O2 yield at the voltage of 7 V. Therefore, if the production of H2O2 can be further optimized, it is of great significance to improve the degradation rate of organic matter in the E-Fenton system. The removal rates of methylene blue at pH 2.5, 3, 3.5 and 4 were 97.73%, 97.80%, 94.92% and 93.87%, respectively. Fig. 1a showed that when the pH was 2.5, the yield of H2O2 was higher than at pH 3. According to the calculation formula for pH (eqn (10)), the acid added at pH 2.5 is  times the amount of the acid added at pH 3, which considerably increases the amount of acid. According to Chen et al., the quenching effect of H+ on the ·OH is more obvious under strong acid conditions.32 In addition, the reaction between Fe2+ and H2O2 will be inhibited.33 Therefore, pH 3 was the optimal pH for methylene blue degradation in this experiment.
| H2O2 → ·HO2 + H+ + e− | (6) |
| ·HO2 → O2 + H+ + e− | (7) |
| O2 + 4H+ + 4e− → 2H2O | (8) |
| O2 + 4H+ + 4e− → 2H2↑ | (9) |
pH = −lg![[thin space (1/6-em)]](https://www.rsc.org/images/entities/char_2009.gif) C(H+) C(H+)
| (10) |
3.2 Evolution of iron ions
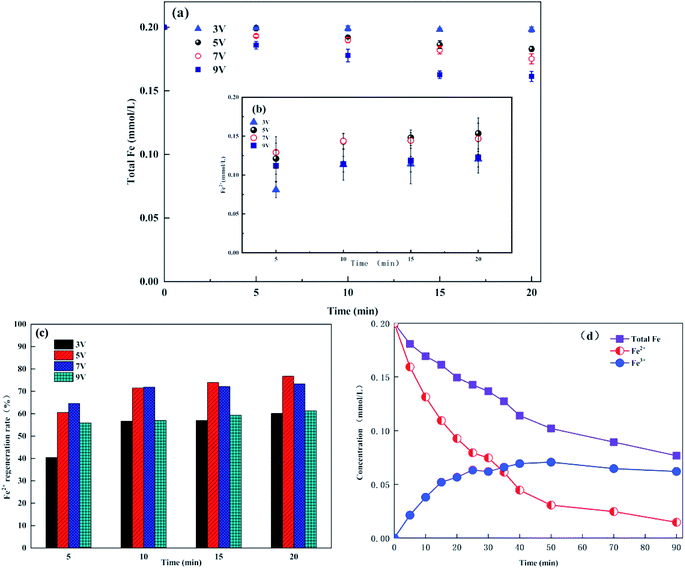
In the E-Fenton process, Fe3+ can be electronically reduced to Fe2+ at the cathode to achieve the cycle of Fe2+ and Fe3+, which considerably reduces the dosage of Fe2+ and the production of iron sludge. Therefore, the evolution of iron ions in this experiment was investigated. When the water contains dissolved oxygen, the H2O2 produced by the cathode will react with Fe2+. Thus, we adopted the method of continuous bubbling N2 by Aboudalle et al. during the experiment to remove the dissolved oxygen in the water.34 Fig. 2a showed the total iron concentration did not remain constant when the Fe3+ was added to the solution. The total iron ions in the solution gradually decreased, and the Fe2+ concentration gradually increased as the reaction proceeded (Fig. 2a and b). When electrolysed for 20 min at voltages of 3, 5, 7 and 9 V, the total iron ions decreased by 0.91%, 8.55%, 12.43%, and 19.33%, respectively. Therefore, the higher the voltage, the more the total iron ion concentration decreases. The effect of voltage on the iron ions may be related to the variation in pH. According to previous studies, when adding 1 mmol L−1 Fe3+ to solution, [Fe(H2O)6]3+ or simply Fe3+ as the sole species at pH 0, Fe3+ practically disappears at pH 4. At the optimum pH of 2.8, only approximately one-half of the free Fe3+ is always present in the bulk.22 In this experiment, with an increase in voltage, the cathode localized alkalization affected the pH near the cathode,22,35 which caused the total iron ion concentration to gradually decrease. Fig. 2c showed that the rate of regeneration of Fe2+ first increased and then decreased with an increase in voltage. Although the total iron ion concentration was the highest at a voltage of 5 V, the rate of Fe3+ reduction was faster because of the higher current density at the voltage of 7 V. Thus, there was little difference in the Fe2+ regeneration rate at voltage 5 V and 7 V (76.75% and 73.33%, respectively). When the voltage was 3 V, the cathode localized alkalization was not significant; thus, the total iron ion concentration was almost constant in solution. However, the regeneration rate of Fe2+ was only 60.19% due to a lower current density. When the voltage was 9 V, the current density was large. Thus, the regeneration rate of Fe2+ at the early stage was higher than 3 V. However, the total iron ion concentration sharply decreased with the reaction, resulting in a regeneration rate of Fe2+ of only 61.33%.Fig. 2a and b showed the ability of Fe3+ to regenerate Fe2+ under anaerobic conditions, whereas according to eqn (1) and (4), the regeneration and consumption of Fe2+ are simultaneous during the actual reaction. Therefore, the evolution of iron ions was studied during the degradation process of methylene blue in the graphite felt E-Fenton system, and the reaction time was extended to 90 min; the results are shown in Fig. 2d. As the reaction proceeded, the total iron ion concentration continued to decreased in the solution, which was consistent with the conclusions shown in Fig. 2a. However, when electrolysis was conducted for 20 min, the total iron ion concentration dropped to 25.33%, which was twice as much as under anaerobic conditions (12.43%). The electrode localized alkalization was very significant in the actual treatment process. During the actual treatment process, O2 continuously consumed H+ at the cathode to produce H2O2, and Fe2+ reacted with H2O2 to generate OH− (eqn (1) and (2)). The local alkalization of the electrodes caused by these reactions was more pronounced, resulting in a final decrease in total iron concentration. In addition, Fe2+ can not maintain a stable concentration during the entire reaction process. The Fe2+ concentration gradually decreased with the electrolysis time, and the Fe3+ concentration gradually increased. This phenomenon was consistent with the research of Ramirez-Pereda et al., which showed that the regeneration rate of Fe2+ was lower than its consumption rate during the actual electrolysis process.15
3.3 Reaction kinetics of degradation of methylene blue by the electro-Fenton process
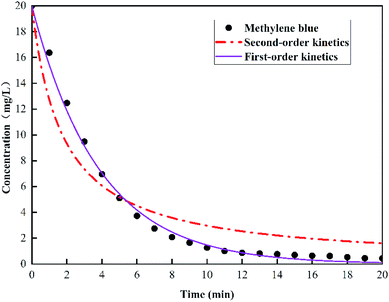
Methylene blue (20 mg L−1) was degraded at a voltage of 7 V with Fe2+ at 0.2 mmol L−1, the supporting electrolyte, Na2SO4, at 10 mmol L−1 and at pH 3. The removal rate of methylene blue was 97.80% after 20 min of electrolysis. The E-Fenton oxidation of methylene blue can be represented by the following nth-order reaction kinetics.
 | (11) |
For the first order reaction, eqn (11) was integrated and converted:
Ct = C0![[thin space (1/6-em)]](https://www.rsc.org/images/entities/char_2009.gif) e−kt e−kt
| (12) |
 | (13) |
The degradation data of methylene blue in the graphite felt E-Fenton system was plotted via first-order reaction kinetics and second-order reaction kinetics. Fig. 3 showed a comparison of the two kinetic models for the experimental results, and Table 1 shows the parameters obtained from the curve fitting. The second-order kinetics does not fit the data very well for the entire E-Fenton reaction due to the lower regression coefficients (<0.96). The first-order kinetics fits the results best as evidenced by the high regression coefficient (>0.99). Therefore, the kinetics process of degradation of methylene blue by the graphite felt E-Fenton method was determined to be first-order reaction kinetics.
| Reaction | First-order | Second-order | ||
|---|---|---|---|---|
| K (min−1) | R2 | K (L mg−1 min) | R2 | |
| E-Fenton | 0.26 | 0.995 | 0.03 | 0.911 |
Its kinetic equation is:
Ct = 20![[thin space (1/6-em)]](https://www.rsc.org/images/entities/char_2009.gif) e−0.26 e−0.26
| (14) |
3.4 Removal mechanism of the electro-Fenton system
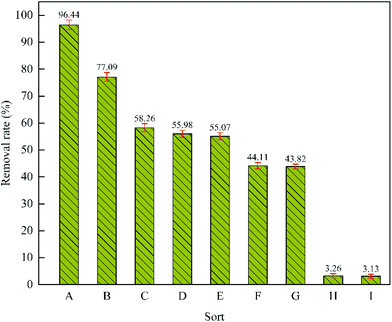
When methylene blue was degraded, its degradation rate decreased significantly after 15 minutes. In order to reduce the experimental error and to more clearly see the experimental differences under each reaction condition, the electrolysis time was set to 15 min during the investigation of degradation mechanism. Each set of experiments was repeated 3 times, and the average value was obtained.Fig. 4 H showed the individual adsorption effect of graphite felt on the removal rate of methylene blue, which was 3.26% after 15 min of adsorption. In addition, when H2O2 was added alone, methylene blue exhibited almost no degradation; thus, H2O2 cannot oxidize methylene blue alone without an electric field. Fig. 4A and E showed the degradation rate of methylene under the conditions of Fe2+ at 0.2 mmol L−1 and 0 mmol L−1, respectively. When Fe2+ was added to the solution, the removal rate of methylene blue increased by 41.37%; thus, the Fenton reaction to produce ·OH and ·HO2 was the main factor for the degradation of methylene blue. Methanol is recognized as ·OH scavenger. The reaction rate of methanol with ·OH is 1.2 × 10⁹ to 2.8 × 10⁹ M−1 s−1.36 In the presence of Fe2+, 5 mL of methanol was added to the solution. The removal rate of methylene blue decreased by 52.33%, which confirmed that ·OH was the main active substance in the E-Fenton system (Fig. 4A and F). When 5 mL of methanol was added without the Fe2+-forming Fenton reagent in the solution, the removal rate of methylene blue did not significantly change (Fig. 4C and E). This showed that the methylene blue is directly oxidized by the graphite felt anode. According to Fig. 4E and G, the removal rate of methylene blue decreased when 10 mL of H2O2 was added to the solution; thus, H2O2 cannot produce ·OH under the action of an electric field without Fe2+. In contrast, the competition between H2O2 anodic oxidation and methylene blue anodic oxidation resulted in a decrease in the removal rate of methylene blue.
In addition, aeration had a significant effect on the degradation of methylene blue in the graphite felt E-Fenton system. When the solution did not contain Fe2+, the removal rate was 3.13% and 55.07% under conditions of no aeration and aeration, respectively (Fig. 4E and I). When the solution contained Fe2+, the removal rate was 77.09% and 96.44% under conditions of no aeration and aeration, respectively (Fig. 4A and B). Tammeveski et al. thought that because an activated carbon fibre surface contains a large number of functional groups, O2 will be reduced to ·O2− at the cathode.37 Based on this, we speculate that aeration may play three roles in the graphite felt E-Fenton system: (i) as active substance, where ·O2− was produced under the action of an electric field; (ii) to accelerate the mass transfer of the solutions; (iii) and to produce the Fenton reagent, H2O2, at the cathode. According to Fig. 4D and E, when N2 or O2 was exposed to the solution without Fe2+, the removal rate of methylene blue did not significantly change; thus, it can be concluded that no ·O2− was produced. When Fe2+ was not present in this system, the main role of O2 was to accelerate the mass transfer. When Fe2+ was present, the role of O2 was to accelerate the solution mass transfer and the generation of the Fenton reagent, H2O2. When Fe2+ was present and the solution was not aerated, the potential difference between the anode and the cathode was the migration power of the ions. Fe2+ and H+ migrated to the cathode and generated ·OH via eqn (1) and (2). In addition, methylene blue formed a highly chromatic monovalent cationic quaternary ammonium salt ionic group in aqueous solution, and the quaternary ammonium salt ionic group migrated to the cathode under the action of an electric field, which accelerated the reaction rate of methylene blue with ·OH. Therefore, there was a high degradation rate of methylene blue even under the condition of no aeration. When no Fe2+ was in the solution, the degradation of methylene blue depended on the direct oxidation of the anode; however, the anode will repel methylene blue because of the charged nature of methylene blue. Therefore, the degradation of methylene blue was very slow under unaerated conditions. When continuous aeration was applied to the solution, the disturbance of oxygen on water overcomes the repulsive force of the anode on methylene blue and enabled methylene to be oxidized directly at the anode.
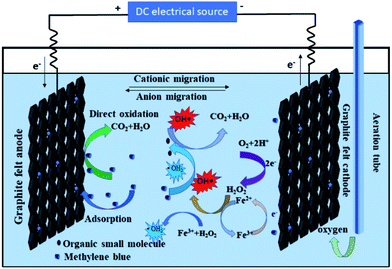
In summary, a probable mechanism of the graphite felt E-Fenton system to remove the methylene blue is shown in Fig. 5. During the electrolysis process, the graphite felt anode can directly oxidize the methylene blue. H2O2 was electro-generated from the reduction of O2 on the graphite felt cathode under the condition of aeration. H2O2 then migrated into the liquid phase to react with Fe2+ and Fe3+. The ·OH and ·HO2 were generated by the Fenton and Fenton-like reaction. Then, the methylene blue was degraded by ·OH and ·HO2 indirectly.
3.5 Repeated use of graphite felt in the E-Fenton system and cost analysis
In order to study the stability of graphite felt electrode, the experiment of reusing was carried out. Fig. 6(a) showed the change in methylene blue removal rate and system current with the number of uses under the optimal conditions for 15 min of electrolysis. The graphite felt electrode was not regenerated during the process of repeated use. According to Fig. 6(a), the methylene blue removal rate and current showed a downward trend with increasing usage counts. After 90 times of repeated use, the removal rate decreased by 26.02%, and the current decreased by 76.56%. Linear fitting was performed on the change of methylene blue removal rate, and the slope of the fitting line was −0.20. The removal rate of graphite felt only decreased by 0.20% for each use, which reflected the good reusable performance of graphite felt. In addition, the current drop was much larger than the removal rate during the reusing process. According to Fig. 6(b), the adsorption performance of graphite felt was greatly improved after repeated use. The adsorption removal rate of unused graphite felt to the methylene blue was only 3.26%. After 90 repeated times of use, the adsorption removal rate of graphite felt to the methylene blue was 38.91%, and the adsorption effect was considerably improved. Although the current density of the E-Fenton system decreased during repeated use, the increase in the adsorption capacity was helpful to shorten the reaction path between methylene blue and active substances, which made up for repeated use current greatly reduced defects to some extent.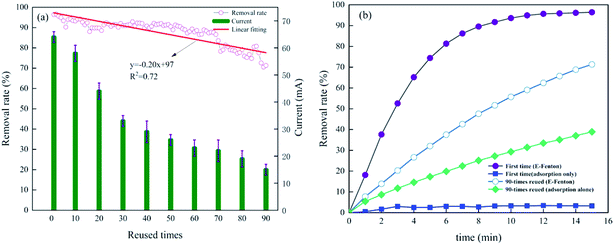 | ||
| Fig. 6 Repeated use of graphite felt in the E-Fenton system. (a) Changes in methylene blue removal rate and system current. (b) Comparison of removal rate and adsorption performance. | ||
This study initially investigated the reasons for the decrease of current and removal rate during the repeated use of graphite felt E-Fenton system. According to eqn (15), under the condition of constant voltage and constant solution composition, the reason for the decrease in current was the increase in the internal resistance of the graphite felt electrode.
 | (15) |
We used the original graphite felt A, the repeated use graphite felt B (used as the anode) and the repeated use graphite felt C (used as the cathode) and completed a total of 7 permutation combinations to study the reasons for the decrease in current and removal rate (Table 2). The experimental results were shown in Fig. 7(a) and (b).
| Electrode | Different electrode combinations | ||||||
|---|---|---|---|---|---|---|---|
| Anode | A | A | A | B | B | C | C |
| Cathode | A | B | C | A | C | A | B |
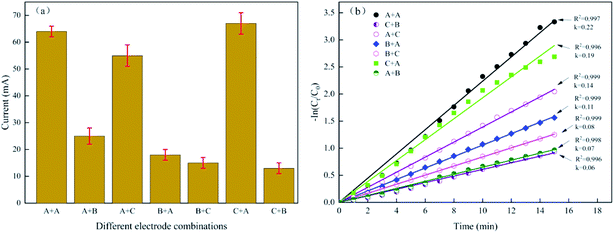 | ||
| Fig. 7 Different electrode combinations. (a) Current of different electrode combinations. (b) First-order linear fitting results for methylene blue removal rate. | ||
According to Fig. 7(a), the current of the A + A system was 64 mA; however, the currents of the A + B, B + A, C + B, and B + C systems were 25, 18, 13, and 15 mA, respectively. These results indicated that in the presence of the B electrode, the current value of the entire E-Fenton system is low regardless of whether the B electrode continues to function as the anode or the cathode, or whether the counter electrode or the new electrode is used. The currents of the A + C and C + A system were 55 mA and 67 mA, respectively, indicating that the repeated use cathode C has little influence on the current drop. Thus, the decrease in current was because of the increase in anode resistance.
Fig. 7(b) showed the first-order linear fitting results for methylene blue removal. The K values (the reaction rate coefficients) of the A + A, C + A, A + C, B + A, B + C, A + B, and C + B systems were 0.22, 0.19, 0.14, 0.11, 0.08, 0.07, and 0.06 min−1, respectively. Upon comparing the K value of B + C (0.08) with the B + A (0.11), A + B (0.07), and C + B (0.06) systems, the removal rate of methylene blue was very low regardless of how the electrode was replaced in the presence of electrode B. Upon comparing B + C (0.08) with C + A (0.19) and A + C (0.14), the K value increased as long as electrode B was replaced. Thus, the decrease in catalytic activity of electrode B was the main reason for the decrease in the methylene blue removal rate.
Although the catalytic activity of electrode C is lowered, the magnitude of the decrease was much smaller than the decrease of the electrode B. Therefore, the method of replacing the anode B can be used to restore the degradation efficiency of the E-Fenton system in practical application. However, it did not work well to only use the new electrode A to replace the used anode B (the K value of A + C was 0.14). According to C + A (0.19) and A + C (0.14), the new electrode A was used to replace electrode C as a cathode, and electrode C was no longer used as a cathode but was used as an anode. This electrode replacement method can restore the maximum removal efficiency of the E-Fenton system, and the K value is only 0.03 different from that of the new electrode system A + A.
It can be determined graphite felt will cause three changes after being used as anode: the conductivity and catalytic performance will be decreased, and the adsorption performance will be increased. According to the characterization results of Fig. 8, the reasons for the above performance changes can be preliminarily inferred. The pore width distribution showed the number of micropores increased. BET test showed the specific surface area of anode graphite felt increased by 3.69 m2 g−1 compared with the raw graphite felt. In addition, performance changes may be related to changes in crystal structure.38 The XRD results showed that the diffraction peak at 2θ = 23° was stronger, corresponding to the (002) crystal plane of the graphite crystallite; the diffraction peak at 2θ = 44° was weaker, corresponding to the (010) crystal plane of the graphite crystallite, and the peak shape of the two diffraction peaks was wider, which proves that the graphite felt was a graphite microcrystalline layered structure. And the characteristic diffraction peak position of the anode did not change substantially, indicating that the graphite felt electrode did not change the graphite fiber structure before and after use. However, the intensity of the anode peak was weakened, the peak height was shortened, and the width was increased, indicating that the anode graphite felt grain becomes smaller, the delocalized electrons decreased, the grain boundary hindered the electron conduction, and the resistance increased. SEM image showed that the anode attachment increases, which may affect the conductivity. Moreover, cracks appeared in the structure of anode fiber, which indicated that the physical strength and mechanical strength of graphite felt were damaged greatly and the electrode life was reduced. The XPS results showed that the O 1s peak was greatly enhanced, while the C element peak intensity was slightly lowered. The content of C![[double bond, length as m-dash]](https://www.rsc.org/images/entities/char_e001.gif) O decreased from 47.12% to 40.31% and the content of H–O–H increased from 19.87% to 27.42%. The decrease in electrical conductivity and catalytic performance may be related to changes in oxygen-containing functional groups.13 Malitesta et al. indicated the oxygen can be located not only at the beta carbon but also on the alpha carbon, leading to the breakage of polymer chains, resulting in a decrease in conductivity.39
O decreased from 47.12% to 40.31% and the content of H–O–H increased from 19.87% to 27.42%. The decrease in electrical conductivity and catalytic performance may be related to changes in oxygen-containing functional groups.13 Malitesta et al. indicated the oxygen can be located not only at the beta carbon but also on the alpha carbon, leading to the breakage of polymer chains, resulting in a decrease in conductivity.39
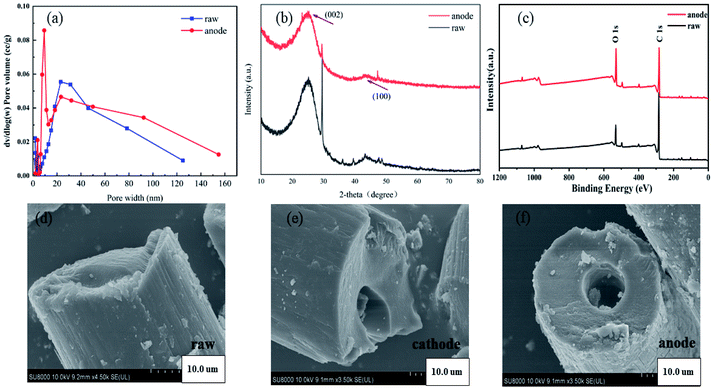 | ||
| Fig. 8 (a) Pore width of raw GF and anode GF, (b) X-ray diffraction patterns of raw GF and anode GF, (c) XPS survey spectra of raw GF and anode GF. SEM images of (d)–(f). | ||
In this study, the removal rate of methylene blue was 97.80% after electrolysis for 20 min in the graphite felt E-Fenton system, and these results were very competitive if compared with the traditional graphite electrode system.16 Electric energy consumption is a key index to evaluate the scale-up and industrial applications of the graphite felt E-Fenton system. In this study, the voltage and current of the DC power were 7 V and 64 mA, respectively. The rated power of the fish aerator was 1 W. C0 and C were 20 mg L−1 and 0.44 mg L−1, respectively. The volume of water treated was 0.5 L, and the electrolysis time was 20 min. Taking the above data into eqn (5), the EE/O of the graphite felt system was calculated, and the results were 0.55 kW h m−3, which revealed a significant reduction in energy consumption.15 The graphite felt also showed a good price advantage. The price of graphite felt purchased by our laboratory was 35 yuan (20 × 123 × 0.5 cm pieces). After cutting it into electrodes (12 × 1.5 × 0.5 cm pieces), each graphite felt electrode was only approximately 0.3 Yuan. Moreover, the adsorption performance of the graphite felt used in the E-Fenton system was considerably improved; therefore, the anode graphite felt can be used alone as an adsorbent. In general, the graphite felt E-Fenton system has a good practical significance.
4. Conclusion
Graphite felt was used as the anode and cathode to investigate the application performance in the E-Fenton system. pH and voltage affected the yield of H2O2. The yield of H2O2 decreased as pH increased and first increased and then decreased as voltage increase. Voltage affected the evolution of iron ions. The higher the voltage, the faster the total iron concentration decreased. The regeneration rate of Fe2+ can reach 73.33% under the condition of N2 aeration at a voltage of 7 V and pH 3. The graphite felt E-Fenton system can effectively remove the methylene blue. At a voltage of 7 V, pH 3 and a supporting electrolyte of 10 mmol L−1 Na2SO4, the removal rate of methylene blue was 97.80% after 20 min of electrolysis. The reaction kinetics of the degradation of methylene blue from the E-Fenton system was fitted. The degradation of methylene blue is consistent with the first-order reaction kinetics, and its kinetic equation is: Ct = 20![[thin space (1/6-em)]](https://www.rsc.org/images/entities/char_2009.gif) e−0.26. The mechanism of degradation of methylene blue by the graphite felt E-Fenton system was discussed. In addition to the indirect oxidation of ·HO2 and ·OH, this also includes direct oxidation of the anode and adsorption of the graphite felt. The graphite felt E-Fenton system was used repeatedly 90 times, and the results showed that the removal rate of graphite felt only decreased by 0.20% for each use, which reflected the good reusable performance of graphite felt. Graphite felt exhibited a greatly enhanced adsorption performance after repeated use and can be used as a good adsorbent. The decrease in catalytic activity of electrode B was the main reason for the decrease in the methylene blue removal rate. A method of replacing the electrode was proposed, which could restore the removal efficiency of the E-Fenton system to the greatest extent, and the K value was only 0.03 different from the new electrode system A. The cost analysis showed that the graphite felt E-Fenton system has the potential for scale-up and industrial application.
e−0.26. The mechanism of degradation of methylene blue by the graphite felt E-Fenton system was discussed. In addition to the indirect oxidation of ·HO2 and ·OH, this also includes direct oxidation of the anode and adsorption of the graphite felt. The graphite felt E-Fenton system was used repeatedly 90 times, and the results showed that the removal rate of graphite felt only decreased by 0.20% for each use, which reflected the good reusable performance of graphite felt. Graphite felt exhibited a greatly enhanced adsorption performance after repeated use and can be used as a good adsorbent. The decrease in catalytic activity of electrode B was the main reason for the decrease in the methylene blue removal rate. A method of replacing the electrode was proposed, which could restore the removal efficiency of the E-Fenton system to the greatest extent, and the K value was only 0.03 different from the new electrode system A. The cost analysis showed that the graphite felt E-Fenton system has the potential for scale-up and industrial application.
Conflicts of interest
There are no conflicts to declare.Acknowledgements
The financial support from the National Natural Science Foundation of China (U1803244) is gratefully acknowledged.References
- I. Sirés, E. Brillas, M. A. Oturan, M. A. Rodrigo and M. Panizza, Environ. Sci. Pollut. Res. Int., 2014, 21, 8336 CrossRef.
- E. J. Ruiz, A. Hernández-Ramírez, J. M. Peralta-Hernández, C. Arias and E. Brillas, Chem. Eng. J., 2011, 171, 385–392 CrossRef CAS.
- I. Oller, S. Malato and J. A. Sánchez-Pérez, Sci. Total Environ., 2011, 409, 4141–4166 CrossRef CAS PubMed.
- F. Sopaj, N. Oturan, J. Pinson, F. Podvorica and M. A. Oturan, Appl. Catal., B, 2016, 199, 331–341 CrossRef CAS.
- N. Barhoumi, N. Oturan, H. Olvera-Vargas, E. Brillas, A. Gadri, S. Ammar and M. A. Oturan, Water Res., 2016, 94, 52–61 CrossRef CAS.
- T. X. H. Le, R. Esmilaire, M. Drobek, M. Bechelany, C. Vallicari, D. L. Nguyen, A. Julbe, S. Tingry and M. Cretin, J. Mater. Chem. A, 2016, 4, 17686–17693 RSC.
- P. V. Nidheesh and R. Gandhimathi, Desalin. Water Treat., 2014, 52, 1872–1877 CrossRef CAS.
- E. Bocos, E. González-Romero, M. Pazos and M. A. Sanromán, Chem. Eng. J., 2016, 318, 19–28 CrossRef.
- M. Munoz, Z. M. D. Pedro, J. A. Casas and J. J. Rodriguez, Appl. Catal., B, 2015, 176–177, 249–265 CrossRef CAS.
- Y. Zhang, Y. Wang and I. Angelidaki, J. Power Sources, 2015, 291, 108–116 CrossRef CAS.
- M. A. Fard and B. Barkdoll, Electrochim. Acta, 2018, 265, 209–220 CrossRef.
- T. Yatagai, Y. Ohkawa, D. Kubo and Y. Kawase, Environ. Lett., 2016, 52, 74–83 Search PubMed.
- W. Zhou, L. Rajic, X. X. Meng, R. Nazari, Y. W. Zhao, Y. Wang, J. H. Gao, Y. K. Qin and A. N. Alshawabkeh, Chem. Eng. J., 2019, 364, 428–439 CrossRef CAS.
- Y. Wang, W. Zhou, J. H. Gao, Y. N. Ding and K. K. Kou, J. Electroanal. Chem., 2019, 833, 258–268 CrossRef CAS.
- B. Ramirez-Pereda, A. Alvarez-Gallegos, J. G. Rangel-Peraza and Y. A. Bustos-Terrones, J. Environ. Manage., 2018, 213, 279–287 CrossRef CAS PubMed.
- P. V. Nidheesh and R. Gandhimathi, Desalination, 2012, 299, 1–15 CrossRef CAS.
- S. C. Elaoud, M. Panizza, G. Cerisola and T. Mhiri, J. Electroanal. Chem., 2012, 667, 19–23 CrossRef CAS.
- T. X. H. Le, M. Bechelany and M. Cretin, Carbon, 2017, 122, 564–591 CrossRef CAS.
- A. Özcan, Y. Şahin, A. S. Koparal and M. A. Oturan, Appl. Catal., B, 2009, 89, 620–626 CrossRef.
- C. Zhao, B. Si, Z. A. Mirza, Y. Liu, X. He, J. Li, Z. Wang and H. Zheng, Sep. Purif. Technol., 2017, 187, 397–406 CrossRef CAS.
- S. O. Ganiyu, T. X. H. Le, M. Bechelany, N. Oturan, S. Papirio, G. Esposito, E. van Hullebusch, M. Cretin and M. A. Oturan, Chem. Eng. J., 2018, 350, 844–855 CrossRef CAS.
- E. Brillas, I. Sirés and M. A. Oturan, Chem. Rev., 2009, 109, 6570 CrossRef CAS PubMed.
- F. Yi, S. Chen and C. Yuan, J. Hazard. Mater., 2008, 157, 79–87 CrossRef CAS PubMed.
- L. Zhou, M. Zhou, C. Zhang, Y. Jiang, Z. Bi and J. Yang, Chem. Eng. J., 2013, 233, 185–192 CrossRef CAS.
- K. Sunil and B. Narayana, Bull. Environ. Contam. Toxicol., 2008, 81, 422–426 CrossRef CAS PubMed.
- J. E. Amonette, Clays Clay Miner., 1998, 46, 51–62 CrossRef CAS.
- L. Zhou, Z. Hu, C. Zhang, Z. Bi, T. Jin and M. Zhou, Sep. Purif. Technol., 2013, 111, 131–136 CrossRef CAS.
- C. A. Martínez-Huitle and E. Brillas, Appl. Catal., B, 2015, 166–167, 603–643 Search PubMed.
- M. Zarei, D. Salari, A. Niaei and A. Khataee, Electrochim. Acta, 2009, 54, 6651–6660 CrossRef CAS.
- F. Safizadeh, N. Sorour, E. Ghali and G. Houlachi, Int. J. Hydrogen Energy, 2017, 42, 5455–5463 CrossRef CAS.
- Y. Li, G. Zhong, H. Yu, H. Wang and F. Peng, Phys. Chem. Chem. Phys., 2015, 17, 21950–21959 RSC.
- C. Chen, W. Zhao, J. Li, J. Zhao, H. Hidaka and N. Serpone, Environ. Sci. Technol., 2002, 36, 3604 CrossRef CAS.
- X. Liu, S. Yuan, M. Tong and D. Liu, Water Res., 2017, 113, 72–79 CrossRef CAS.
- A. Aboudalle, F. Fourcade, A. A. Assadi, L. Domergue, H. Djelal, T. Lendormi, S. Taha and A. Amrane, Chemosphere, 2018, 199, 486 CrossRef CAS.
- E. Petrucci, A. D. Pozzo and L. D. Palma, Chem. Eng. J., 2016, 283, 750–758 CrossRef CAS.
- G. V. Buxton, C. L. Greenstock, W. P. Helman and A. B. Ross, J. Phys. Chem. Ref. Data, 1988, 17, 513–886 CrossRef CAS.
- K. Tammeveski, K. Kontturi, R. J. Nichols, R. J. Potter and D. J. Schiffrin, J. Electroanal. Chem., 2001, 515, 101–112 CrossRef CAS.
- T. X. H. Le, C. Charmette, M. Bechelany and M. Cretin, Electrochim. Acta, 2016, 188, 378–384 CrossRef CAS.
- C. Malitesta, I. Losito, L. Sabbatini and P. G. Zambonin, J. Electron Spectrosc. Relat. Phenom., 1995, 76, 629–634 CrossRef CAS.
| This journal is © The Royal Society of Chemistry 2019 |

