 Open Access Article
Scalable lignin/graphite electrodes formed by mechanochemistry†
Lianlian Liu ,
Niclas Solin and
Olle Inganäs*
Department of Physics, Chemistry and Biology, Linköping University, SE-581 83 Linköping, Sweden. E-mail: olle.inganas@liu.se
First published on 2nd December 2019
Abstract
Lignin is a promising candidate for energy storage because of its abundance, wide geographic distribution, and low cost as it is mainly available as a low value product from processing of wood into paper pulp. Lignin contains large amounts of potential quinone groups, which can be oxidized and reduced in a two electron process. This redox reaction makes lignin suitable for charge storage. However, lignin is insulating and therefore conductive materials are necessary in lignin electrodes, for whom the cost of the conductive materials hinders the scalable application. Among the organic conductive materials, graphite is one of the cheapest and is easily acquired from nature. In this work, we combine graphite and lignosulfonate (LS) and fabricate LS/graphite organic electrodes under a solvent-free mechanical milling method, without additives. The graphite is sheared into small particles with a size range from 50 nm to 2000 nm. Few-layer graphene is formed during the ball milling process. The LS/graphite hybrid material electrodes with primary stoichiometry of 4/1 (w/w) gives a conductivity of 280 S m−1 and discharge capacity of 35 mA h g−1. It is a promising material for the scalable production of LS organic electrodes.
Introduction
Renewable sources of electrical energy are necessary to reduce the reliance on fossil resources for generating electrical power. The cost reductions of solar photovoltaic electricity and wind generated electricity have now made these renewable and sustainable forms economically competitive with fossil fuel based electricity generation. The intermittent nature of solar and wind power, however, requires temporary storage of electricity for supplying electrical power whenever desired.1 The diurnal and predictable variation of solar electricity generation, as well as the rapidly varying supply of wind electricity, requires energy storage systems adapted to the power balance necessary in an electrical grid. Moreover, in the absence of power grids, as found in many places around the equator, local storage of electricity from local electrical power sources is necessary for power balancing.1 There is, accordingly, currently a great need for development of scalable, sustainable and cheap storage of electrical energy. The sustainability criterion hints that organics obtained from plants should be the most attractive source of materials. One attractive way of storing charge in organics is to utilize organic materials containing redox active functional groups. In biological systems redox reactions of quinone (Q) groups are employed for energy conversion and storage. Remarkably, one of the most abundant biopolymers – lignin – carry a plethora of Q and hydroquinone (HQ2)-like groups. The redox activity of lignin has been known for some time;2 however, it was only recently realized that lignin can be employed in charge storage devices.3 Lignin accounts for 20–30% of the weight of plants. It is a resource extracted from wood during processing to form paper, but is at present mainly considered as a by-product, and hence burnt for process heat in paper and pulp mills. However, due to the abundance, low cost and global distribution of lignin, such low value streams constitute a highly attractive source of a scalable and sustainable material to be used for energy storage.4 However, a challenge is that while lignin contains a high density of potentially active redox groups, the material itself is electronically insulating. Accordingly, for lignin deposited onto an electrode, only molecules located close to the electrode could realistically be utilized.5 Therefore, in order to obtain efficient charge storage, it is thus essential to contact also the redox active groups present in the bulk. This has previously been achieved by electrochemical or chemical polymerization of pyrrole3 or EDOT6 in the presence of lignin, giving rise to lignin embedded within a conductive polymer network. Degradation of the electronic polymer polypyrrole during electrochemical operation may, however, lead to poor stability.7 It would be highly desirable to substitute such relatively expensive conductive polymers with lower cost conducting materials. Steps in this directions have been taken, and combinations of lignin and graphite derivatives, such as partially reduced graphene oxide,8 partially reduced graphite oxide9 and graphene,10 have recently been investigated for energy storage devices. However, the preparation of graphite oxide and graphene oxide employs strong acids, oxidants and thermal treatment, producing toxic gas. Moreover, the low conductivity of graphene oxide often necessitates a reduction reaction in order to recover the conjugated π-system, requiring an additional processing step often involving hazardous reagents such as hydrazine.11,12 These complicated preparation processes makes it attractive to sidestep the oxidation of graphite to graphite oxide, and use graphite directly. Pristine graphite is one of the cheapest among the carbon based conducting materials, accordingly, graphite electrodes are commonly used in fuel cell,13–15 sodium-ion battery,16,17 lithium-ion battery18,19 and electrolysis.20 Carbon paste electrode is widely developed since it is first reported in 1958.21 A variety of carbon materials and binders are combined to form carbon paste that is fabricated into electrodes.22,23 In addition, graphite shows a conductivity ranging between 100–500 S m−1 ⊥ (perpendicular to the planes), 2–2.5 × 10⁶ S m−1 ‖ (parallel to graphene layer),24 built up from stacks of graphene. Graphite can be cleaved/exfoliated along the basal plane into materials consisting of various number of graphene sheets – including into single layer graphene, and then be applied as conducting materials.25 One green method to exfoliate graphite into graphene sheets, without toxic and hazardous chemicals, is aqueous assisted sonication, where surfactants are applied to achieve efficient exfoliation.26–28 Alkaline lignin has been applied as a surfactant in the exfoliation process.29–31 However, the sonication treatment and aqueous system make it difficult for scalable production of lignin–graphite hybrid material.32 One of the simplest methods imaginable to prepare conductive lignin–graphite hybrid material would be to co-grind (mill) the two components. Moreover, milling methods are highly scalable, with already existing large scale mills in operation. For example, pencils, one of the modern version of this tool, whose history dates back to the 16th century.33 Graphite and clay are milled and blended together to manufacture pencils.34 Processing by grinding is receiving much recent interest, and the field is known as mechanochemistry.35 Mechanochemical methodology is especially interesting, as mechanical milling is one of the demonstrated methods for exfoliation of graphite with a surfactant at solid phase.36–38 However, to the best of our knowledge, lignin has never been applied as a surfactant during the graphite milling processing, supporting exfoliation of graphite. Herein, we report a facile process to combine graphite and the lignin derivative lignosulfonate by means of mechanochemistry: graphite flakes and lignosulfonate are co-ground in the solid state followed by treatment with water, resulting in a readily processable lignin![[thin space (1/6-em)]](https://www.rsc.org/images/entities/char_2009.gif) :
:![[thin space (1/6-em)]](https://www.rsc.org/images/entities/char_2009.gif) graphite paste that can be coated on substrates and directly applied in electrical energy storage devices.
graphite paste that can be coated on substrates and directly applied in electrical energy storage devices.
The materials and electrodes are characterized by UV-vis spectroscopy, Fourier transform infrared (FTIR) spectroscopy, Raman spectroscopy, X-ray diffraction (XRD), dynamic light scattering (DLS), thermogravimetric analysis (TGA), scanning electron microscopy (SEM), transmission electron microscopy (TEM), cyclic voltammetry (CVs) and galvanostatic charge–discharge measurements. The hybrid electrodes give a conductivity of 290 S m−1 and a discharge capacity of 35 mA h g−1.
Lignin and graphite have never been combined by simple mechanochemical processing, and herein we demonstrates a method to fabricate sustainable, scalable and cheap materials with high conductivity and moderate discharge capacity.
Experimental
Chemical and reagents
Lignosulfonates (LS30, Mw = 13![[thin space (1/6-em)]](https://www.rsc.org/images/entities/char_2009.gif) 400, MeadWestvaco), a lignin derivative. Graphite (flakes, mp 3652–3697 °C, density 1.9, Sigma-Aldrich), perchloric acid (HClO4) (Sigma-Aldrich), KBr (Scharlau) were used as received. The aqueous solutions were prepared with ultrapure deionized water (Millipore).
400, MeadWestvaco), a lignin derivative. Graphite (flakes, mp 3652–3697 °C, density 1.9, Sigma-Aldrich), perchloric acid (HClO4) (Sigma-Aldrich), KBr (Scharlau) were used as received. The aqueous solutions were prepared with ultrapure deionized water (Millipore).
Mechanical grinding
The mechanical grinding operation was carried out on an Oscillating Mill MM400 (Retsch GmbH, Germany). An amount of LS and graphite were weighed and put into a stainless steel milling cup (1.5 mL), then 20 stainless steel balls (diameter 3 mm, ≈2.2 g) were added into the milling cup. The milling cup was shaken on the ball milling instrument at frequency 30 Hz for 99 min. The grinding mixture was collected from the milling cup. A series of mixtures with different stoichiometry of LS and graphite were prepared.Electrodes preparation
50 mg of the milling mixture was dispersed into 0.5 mL of distilled water by a vortex shaker (KEBO-Lab reax 2000) for 4 min. Then the dispersion was first centrifuged by a centrifuge (universal 320 R, Hettich) for 2 min at 4000 rpm to remove the largest graphite particles. The collecting supernatant was further centrifuged for 60 min at 6000 rpm. Then the pellets were collected and painted on the gold electrodes via a blade-coater (Enrichsen 510, with a ZFR 2040 film applicator, 30 μm gap and 20 mm s−1 blade speed). The hybrid electrodes were dried at 120 °C for 10 min before the measurements.Hybrid material electrodes characterization
| Q = IΔt/m | (1) |
Results and discussion
Electrodes fabrication
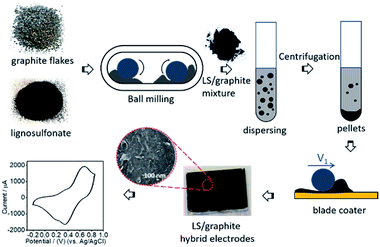
Lignosulfonate (LS) and graphite flakes are milled by means of a Retsch mixer mill MM400. In order to keep enough free space to enable efficient milling, approximately 150 mg of the samples and 20 stainless steel balls (diameter 3 mm, total weight ≈ 2.2 g) are applied. The primary ratios (by weight) of LS and graphite are x/1 (x = 1, 2, 4, 5, 7, 10), and the collected mixtures of LS and graphite after ball milling are named as LS/graphite (x/1, w/w) mixture. After milling, the LS/graphite mixture is dispersed into distilled water. However, drop-casting of such dispersions in order to form electrodes is problematic, as separate aggregates are formed in place of a continuous film. We therefore process the as-prepared dispersion by centrifugation, resulting in the formation of a pellet (sediment) and a supernatant that could be readily separated. When attempting to form electrodes from the supernatant, films are formed which, however, display cracks upon drying. Moreover, such films are often partly dissolved when applying electrolyte. However, we find that the material collected in the pellets can form a continuous film without cracks that is stable towards electrolyte. Therefore the material in the supernatant is discarded and the pellet material is collected and coated onto gold electrodes, to fabricate an organic electrode (Fig. 1). Throughout the text below, the pellets are designated as LS/graphite (x/1, w/w) pellets; the supernatants are named as LS/graphite (x/1, w/w) supernatant; and the organic electrodes are named as LS/graphite (x/1, w/w) hybrid material electrodes, with x = 1, 2, 4, 5, 7, 10. “x” refers to the primary stoichiometry used in the milling step. As to the coating method, we initially investigated hand painting, which gave functional devices that, however, suffered from poor reproducibility. However, by employing an automated blade coating technique, the reproducibility and morphology of the hybrid material electrodes significantly improved.Characterization of electrodes
In order to investigate the functional group composition, the LS, graphite and dried LS/graphite (x/1, w/w) (x = 2, 4, 10) pellets were studied by FTIR spectroscopy. The LS/graphite pellets were dried in the oven and milled with mortar and pestle in order to get a powder, then the powder was further ground with KBr and pressed into KBr-pellets. These KBr-pellets were measured by means of FTIR spectroscopy in a transmission mode. Fig. S1† shows the IR transmittance spectra of LS, graphite and LS/graphite (2/1, 4/1, 10/1, w/w) pellets. LS solid shows transmittance peaks at 1600 cm−1 and 1503 cm−1 due to the aromatic ring vibrations; 1458 cm−1 and 1424 cm−1 related to the vibration from aromatic ring connected with methyl and methylene; 1216 cm−1 related to C–O, C–C stretching vibrations and 1038 cm−1 attributed to C–O–C stretching vibration, which correspond to the previous reported data for LS/PEDOT hybrid materials.6 The graphite flakes (with density of 1.9 gcm−3) show no obvious peaks in the IR-spectra, in agreement with the reported data.24 Moreover, the LS/graphite (2/1, 4/1, 10/1, w/w) pellets present peaks at 1500 cm−1, 1456 cm−1, 1212 cm−1 and 1038 cm−1, slightly different from that of LS but still corresponding to LS-absorptions, demonstrating that LS exists in the LS/graphite pellets. The photos of the pure LS, graphite flakes, LS/graphite mixture after milling and LS/graphite hybrid material electrodes are shown in Fig. 1. The LS powder is brownish, graphite forms blackish metallic flakes, the LS/graphite mixture is blackish and the LS/graphite hybrid material electrodes are also blackish. From the black colour it is obvious that graphite exists in the LS/graphite pellets as well. Accordingly, the above results prove the LS/graphite pellets contain a mixture of LS and graphite. Furthermore, TGA results are shown below, that clarifies the mass ratio of LS and graphite in the LS/graphite pellets.As an example of the composition of the supernatant, the LS/graphite (5/1, w/w) supernatant aqueous solution was studied by UV-vis absorption spectra (Fig. S2†). The LS solution in water (0.075 mg mL−1) and the supernatant (1000 fold dilution) both exhibit a peak at 280 nm, attributed to phenolic groups present in LS, which is in agreement with the previously reported data.39 The supernatant also shows an absorption in the range between 400 and 700 nm without obvious peaks, which is a typical absorption of graphite.36,40 The UV-vis results demonstrate that the supernatant also contains a mixture of LS and graphite.
Raman spectra of graphite and LS/graphite (x/1, w/w, x = 1, 2, 4, 5, 7, 10) hybrid material electrodes were obtained with 2.33 eV (532 nm) laser excitation (Fig. S3† and 2), in order to gain insight into the geometry and electronic structures of the LS/graphite hybrid materials. The pristine graphite has absorptions corresponding to D band (1351 cm−1), G band (1583 cm−1) and 2D band (2705 cm−1 and 2723 cm−1) vibrations. The LS/graphite hybrid material electrodes show absorptions at the D band (1351 cm−1), G band (1583 cm−1 and 1623 cm−1), 2D band (2705 cm−1) and an extra band at 2943 cm−1. The D band is negligible in pristine graphite but significant in the hybrid material electrodes (Fig. 2a), indicating more defects in the hybrid materials.41–43 The shoulder peaks of the G band at 1623 cm−1 in the hybrid materials are stronger than that in the pristine graphite (Fig. 2a), indicating the presence of few-layer graphene, as well as disorder.43,44 The intensity ratio of D to G band (ID/IG) is proportional to the crystallite size of graphite and the disorder.45,46 Pristine graphite shows ID/IG of 0.07, and LS/graphite (1/1, 2/1, 4/1, 5/1, 7/1, 10/1, w/w) hybrid material electrodes show ID/IG of 0.71, 0.72, 0.74, 0.68, 0.64 and 0.56, respectively. It indicates smaller crystallite size and increasing disorder in the LS/graphite hybrid material electrodes than in the pristine graphite. In Fig. 2b, the 2D band of the hybrid material electrodes is located at 2705 cm−1; for the pristine graphite, the 2D band shows one peak at 2705 cm−1 and another at 2723 cm−1. This also supports the interpretation that the hybrid materials contains few-layer graphene.36,42 This is in agreement with the TEM results (see Fig. 5 below) as well. The new peak at 2943 cm−1 in LS/graphite hybrid material electrodes is possibly a sign of interactions between LS and graphite. In summary, the Raman spectra suggests the presence of fewer layers, more defects, more disorder and smaller crystallite size of graphite in the hybrid material electrodes than in the pristine graphite.
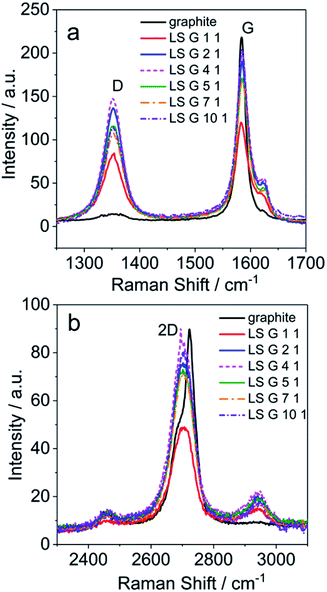 | ||
| Fig. 2 Raman spectra of LS/graphite hybrid materials with different primary stoichiometry (a and b), with 2.33 eV (532 nm) laser excitation energy. | ||
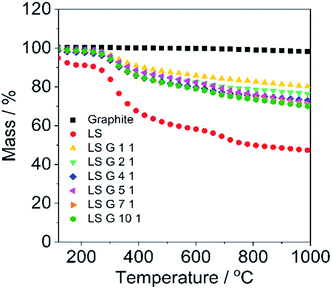
Thermogravimetric analysis (TGA) was employed in order to detect the weight loss of the pre-dried pellets during heating so as to estimate the stoichiometry of LS/graphite pellets. A heating rate of 10 °C min−1 was employed under argon (Ar) atmosphere. As shown in Fig. 3, LS is stable up to 250 °C and begins to degrade dramatically at 280 °C, then becomes stable again between 800 and 1000 °C, showing residual mass fraction of 47.2%, which is in agreement with reported data.6 The weight curve for the pristine graphite is stable throughout the experimental temperature range. The LS/graphite (1/1, 2/1, 4/1, 5/1, 7/1, 10/1, w/w) pellets are stable until 280 °C, followed by a rapid degradation between 300 and 700 °C, showing a residual mass fraction of 80.0%, 76.3%, 72.8%, 71.6%, 71.0% and 69.8%, respectively. The residual mass fraction of the LS/graphite pellets decreases when the mass fraction of LS in the LS/graphite mixture increases. Based on the residual mass fraction data, the stoichiometry of the LS/graphite pellets are calculated (see ESI†) and the results are shown in Table 1, where the mass ratio of LS and graphite varies with a range of 0.55–1.25. It indicates the mass fraction of LS in the LS/graphite pellets increases as the mass fraction of LS in the LS/graphite mixture increases. TGA was further applied to investigate the weight loss of the pristine LS/graphite mixtures (before the aqueous processing) at the same conditions (Fig. S4†). The residual mass fraction of the pristine LS/graphite (x/1, w/w, x = 1, 2, 4, 5, 7, 10) mixture are 72.6%, 64.6%, 56.6%, 56.4%, 54.2% and 51.7%, respectively. Based on these, the calculated stoichiometry of the LS/graphite mixture are 1.0, 1.9, 4.4, 4.5, 6.3 and 10.4, respectively, which are close to the mass ratio of LS and graphite in the milling process. This confirms that the calculated stoichiometry of LS/graphite pellets, based on TGA results, are reasonable.
| Thickness/μm | Conductivity/(S m−1) | Discharge capacity/(mA h g−1) | LS discharge capacityb/(mA h g−1) | Calculated stoichiometry of LS/graphite pellets | |
|---|---|---|---|---|---|
| a Stoichiometry of LS and graphite, w/w.b Based on the mass of LS in the pellets and the discharge capacity from quinone groups. | |||||
| LS/graphite (10/1)a | 2.8 ± 0.2 | 139 ± 14 | 32.7 ± 3.2 | 1.25 | |
| LS/graphite (7/1) | 3.7 ± 0.2 | 212 ± 19 | 32.3 ± 0.3 | 1.14 | |
| LS/graphite (5/1) | 4.7 ± 0.1 | 256 ± 18 | 30.1 ± 2.0 | 1.09 | |
| LS/graphite (4/1) | 5.9 ± 0.3 | 274 ± 33 | 34.7 ± 1.8 | 70 ± 10 | 0.99 |
| LS/graphite (2/1) | 3.1 ± 0.2 | 288 ± 37 | 34.0 ± 3.3 | 0.75 | |
| LS/graphite (1/1) | 9.5 ± 0.5 | 66 ± 5 | 31.4 ± 2.1 | 0.55 | |
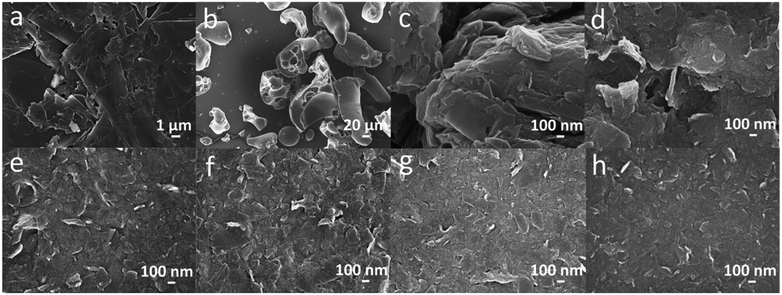
The morphology of LS, graphite and LS/graphite (x/1, w/w, x = 1, 2, 4, 5, 7, 10) hybrid material electrodes were investigated by SEM. The SEM images of graphite and LS show a particle size much larger than micrometers (Fig. 4a and b), and the hybrid material electrodes display a granular-flake morphology, with a wide range in size of the flakes. The particle size for LS/graphite (4/1, 5/1, 7/1, 10/1, w/w) hybrid materials varies from approximately 50 nm to 1000 nm; the morphology is similar between the different samples (Fig. 4e–h). LS/graphite (2/1, w/w) hybrid material electrodes exhibit a larger particle size range, from approximately 200 nm to 1000 nm (Fig. 4d). Meanwhile, LS/graphite (1/1, w/w) hybrid material electrodes exhibit an even larger particle size range than that of LS/graphite (2/1, w/w), from approximately 500 nm to 2000 nm, presenting bulk graphite and gaps in the films (Fig. 4c). It illustrates that the ball milling process can reduce the grain size of graphite and create nanoscale geometries in the hybrid materials. Furthermore, the morphology of the LS/graphite hybrid material electrodes are effected by the stoichiometry of LS and graphite in the ball milling process.
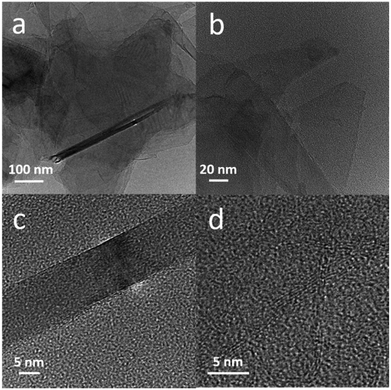
The number of graphene layers in the graphite in LS/graphite pellets was studied by TEM. Fig. 5a and b give overview images of the graphite in the LS/graphite (5/1, w/w) pellets, where monolayer graphene sheet and folded graphene sheets are present. In Fig. 5c and d, structures are present with a thickness of graphene stacks of approximately 13 nm corresponding to 30 graphene layers and 2.5 nm corresponding to 5 graphene layers, assuming a 0.34 nm thickness of single layer graphene.43 On the other hand, LS cannot be imaged in the TEM measurements since it will undergo rapid decomposition under the high energy electron beam. We therefore cannot observe LS in the LS/graphite hybrid materials or pure LS via TEM. The TEM results correspond well with the Raman data: graphite in the hybrid materials was exfoliated into fewer layers during ball milling process.
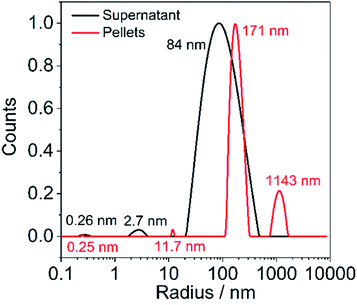
In order to obtain further information of particle size in pellets and supernatant, we performed DLS measurements. LS/graphite (5/1, w/w) is chosen as a typical example. The particle size in the pellets are 0.25 nm, 11.7 nm, 171 nm and 1143 nm, which are larger than that in the supernatant (0.26 nm, 2.7 nm, 84 nm) (Fig. 6). During the aqueous processing, the larger graphite flakes are less stable in the aqueous medium under centrifugation and form a pellet. The DLS autocorrelation function can be simulated assuming the presence of particles with a size of 170 and 1140 nm in the pellets, which corresponds well to the SEM image of LS/graphite (5/1, w/w) hybrid material electrodes, with a particle size range from 50 nm to 1000 nm (Fig. 4f).
The structure of LS/graphite hybrid material electrodes with different stoichiometry was also characterized by XRD measurement (Fig. 7). The pristine graphite shows characteristic 2θ peaks at 26.5° (0,0,2) and 54.6° (0,0,4) (Fig. 7a). LS shows no peaks due to the amorphous structure. There are no new peaks appearing in the spectra of LS/graphite hybrid material electrodes, and the peaks at 26.5° and 54.6° are much weaker than that of pristine graphite (Fig. 7a). This indicates graphite to be exfoliated into few layers and the interlayer spacing of graphene to be 0.34 nm, with an unchanged inter-planar distance,43,44 which is in agreement with the TEM results (Fig. 5c and d). Moreover, the full width at half maximum (FWHM) at 26.5° for pristine graphite (0.17°) is much lower than that of LS/graphite (1/1, 2/1, 4/1, 5/1, 7/1, 10/1, w/w) hybrid material electrodes (0.60°, 0.74°, 0.84°, 0.79°, 0.62° and 0.72°, respectively) (Fig. 7b). It reveals the similar crystallite size in the different LS/graphite hybrid material electrodes and smaller crystallite size of the hybrid material electrodes than that of the pristine graphite, in agreement with the Raman results and SEM results.
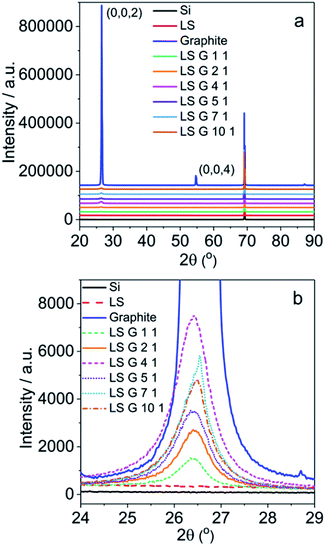 | ||
| Fig. 7 XRD patterns of LS, graphite, LS/graphite (1/1, 2/1, 4/1, 5/1, 7/1, 10/1, w/w) hybrid material electrodes (a and b). | ||
Electrochemical characterization of electrodes
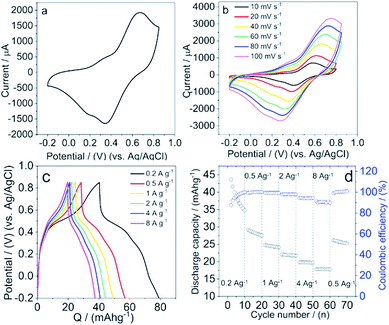
Based on the above results, we propose that LS acts as a surfactant and reduces the surface tension of graphite, and thus helps the exfoliation and thinning of graphite via shear force during the ball milling process. The nanoscale geometries in the hybrid materials can shorten the transfer distance of the electrons between graphite and Q groups in LS, and thus improve the electron transfer kinetics within the materials. In order to investigate the suitability of these hybrid materials for charge storage we performed electrochemical measurements. The electrochemical characterization of the hybrid materials were carried out via a standard three electrode system, with a platinum wire as counter electrode, Ag/AgCl (KCl salt) as reference electrode (RE) and LS/graphite hybrid materials on gold as working electrode (WE).CVs of the hybrid materials as electrodes in 0.1 M HClO4 show two symmetric redox waves (Fig. 8a), well defined at 0.67 V and 0.34 V versus Ag/AgCl, which is ascribed to the redox reactions of Q groups in LS. The Q groups are reduced from Q form to hydroquinone (QH2) form in the 0–0.4 V region, and oxidized from QH2 form to Q form in the 0.5–0.85 V region. These processes occur with concomitant charges transfer between the Q groups and the current collectors. When reduction happens within LS, the protons in the electrolyte get access to the Q groups and form the QH2 groups, while electrons are transferred from the current collector to the materials. When oxidation happens, the Q groups are formed from the QH2 groups while electrons are released and transferred to the current collector. The graphite particles connect with each other and form a percolation network allowing charges to move between the Q/QH2 groups and the current collector during the redox reaction process.
Moreover, we investigated the dependence of redox peak currents on scan rate (Fig. 8b) to understand the dominating electrochemical process of the electrodes in aqueous electrolyte. It shows that the redox peak currents are proportional to the square root of the scan rate (Fig. S5†). We assume the proton diffusion is limiting in our electrode materials.
The charge storage capacity of these hybrid material electrodes was demonstrated by galvanostatic charge–discharge measurements in 0.1 M HClO4. The galvanostatic discharge curves exhibit a discharge capacity of ∼35 mA h g−1 in the potential window of −0.2 to 0.85 V at a discharge rate of 0.2 A g−1 (Fig. 8c). When the discharge rate is increased to 8 A g−1 we observe a decrease in the discharge capacity to ∼18 mA h g−1. Meanwhile, the discharge curves show two different slopes of voltage versus discharge capacity, indicating two different processes from the LS and graphite.3 The plateau in the galvanostatic discharge curve exhibits the discharge capacity from Q groups, which is faradaic capacity, where the Q groups are reduced to QH2 groups; the remaining capacity is due to the double layer capacity of graphite. The discharge capacity contribution from Q groups and graphite is approximate 4![[thin space (1/6-em)]](https://www.rsc.org/images/entities/char_2009.gif) :
:![[thin space (1/6-em)]](https://www.rsc.org/images/entities/char_2009.gif) 1. Moreover, the rate capacity of the hybrid electrodes at different charge rate from 0.2 A g−1 to 8 A g−1 was exhibited in Fig. 8d, with 10 cycles at each charge rate. The discharge capacity is higher at a low charge rate. As the charge rate increases, however, the discharge capacity decreases more seriously, with approximate 70%, 60% and 50% retention of the pristine capacity, at 1 A g−1, 2 A g−1, 8 A g−1, respectively. When the charge rate returns back to 0.5 A g−1, the discharge capacity continues to decay, however slower. We note that the coulombic efficiency (CE) of the electrode increases from 87% to 100% at charge rate of 0.2 A g−1. As the charge rate increases, CE decreases gradually and exhibits merely ∼95% and ∼90% at 4 A g−1 and 8 A g−1, respectively. Additionally, in the cyclic voltammetry experiments, the scan rate dependence result indicates diffusion limitation (Fig. 8b and S5†). We hypothesize that under higher charge rates, a diffusion limitation impacts on the charge–discharge process and leads to a lower CE.
1. Moreover, the rate capacity of the hybrid electrodes at different charge rate from 0.2 A g−1 to 8 A g−1 was exhibited in Fig. 8d, with 10 cycles at each charge rate. The discharge capacity is higher at a low charge rate. As the charge rate increases, however, the discharge capacity decreases more seriously, with approximate 70%, 60% and 50% retention of the pristine capacity, at 1 A g−1, 2 A g−1, 8 A g−1, respectively. When the charge rate returns back to 0.5 A g−1, the discharge capacity continues to decay, however slower. We note that the coulombic efficiency (CE) of the electrode increases from 87% to 100% at charge rate of 0.2 A g−1. As the charge rate increases, CE decreases gradually and exhibits merely ∼95% and ∼90% at 4 A g−1 and 8 A g−1, respectively. Additionally, in the cyclic voltammetry experiments, the scan rate dependence result indicates diffusion limitation (Fig. 8b and S5†). We hypothesize that under higher charge rates, a diffusion limitation impacts on the charge–discharge process and leads to a lower CE.
When the charge–discharge cycling stability of the hybrid materials are investigated (Fig. S6†), we find that the discharge capacity declines from 30 to 20 mA h g−1, with 67% capacity retention after 200 cycles. The rate of change is then reduced dramatically and becomes roughly constant after 500 cycles. After 1000 cycles, the capacity ends at 16 mA h g−1 with a retention of 53%. The CE of LS/graphite (4/1, w/w) hybrid material electrode displays no big difference from the beginning until 1000 cycles, changing from 95% to 99% (Fig. S6†), indicating a high ratio of the total charge extracted from the electrode to the total charge put into the electrode over a cycle. It probes a long-cycling life of the LS/graphite hybrid materials.
We observe that after electrochemical measurements of the hybrid electrodes, the electrolyte shows optical absorption at 280 nm. This means that LS leaks from the LS/graphite hybrid electrodes into the electrolyte during the electrochemical measurements. In order to study the rate and the amount of the leaking LS, LS/graphite hybrid material electrodes were immersed into perchloric acid solution under different concentrations (0.01 M HClO4, 0.1 M HClO4 and 1 M HClO4). The UV-vis absorption of the perchloric acid solutions is monitored as a function of time (Fig. S7†). The calculated mass of LS in the perchloric acid solution, leaked from the electrodes, is shown in Fig. S8.† The mass of LS in the solution increases rapidly in the first few minutes, and then becomes constant over time. For the electrodes immersed into perchloric acid at different concentration, 0.01 M HClO4, 0.1 M HClO4 and 1 M HClO4, the amount of the leaked LS found in the solution become constant after 1 h, 2 h and 7 h, with 50%, 30% and 15% of the amount of the original LS in the electrodes, respectively. Thus LS leaves the electrodes gradually. The higher the concentration of perchloric acid, the slower and smaller amount of leakage of LS. Since the LS leakage is rapid in the first few minutes, we hypothesize that LS on the surface of the electrodes, which dissolves easily, is washed away and leads to the discharge capacity loss for the electrodes. In order to test this hypothesis, the electrodes were first immersed into 0.1 M HClO4 for 10 minutes to wash away LS on the surface, after which the UV-vis absorption as a function of time and cycling stability measurements were taken in a new HClO4 solution, respectively. The UV-vis absorption of the HClO4 solution due to leaked LS increase gradually over time, but the mass of the leaked LS is negligible (Fig. S9†). For the cycling stability measurements, the electrodes were dried and weighed after washing, to get the precise mass of the hybrid materials before the electrochemical measurements. The discharge capacity of the electrode now shows 80% retention after 1000 charge–discharge cycles at 4 A g−1 (Fig. S10a†), a considerable improvement compared to the previous results (53%) without washing (Fig. S6†).
The mass of the leaked LS corresponds to approximate 30% of the amount of the original LS in the LS/graphite (4/1, w/w) electrode (in 0.1 M HClO4, Fig. S7b and S8b†). This means that the actual mass of the electrode is decreasing during the cycling stability measurement and after 1000 charge–discharge cycles decreased by 15%. In this case, the discharge capacity of the electrode after charge–discharge cycles is misleading if calculated by employing the mass of the electrode at the start of the experiment. Thus the discharge capacity of the electrode after 1000 cycles, which is 16 mA h g−1 calculated employing the original mass, is actually 18.8 mA h g−1 if taking the mass loss into account, giving a 63% retention of discharge capacity. That is lower than the discharge capacity retention after 1000 cycles of the electrode exposed to a washing step, 80% (Fig. S10a†). When considering the discharge capacity from Q groups and the actual mass of LS in the LS/graphite hybrid electrodes, the discharge capacity of LS in the hybrid material can be as much as 70 mA h g−1 (Table 1). We note that the quinone content in this LS sample (2.2 wt%) give a discharge capacity of 69 mA h g−1,3 in agreement with our results.
Comparing our material to other lignin electrode materials, they present a wide range of discharge capacity and stability. The polypyrrole/LS hybrid materials show a discharge capacity of 72 mA h g−1 and the capacity decreases dramatically after 100 charge–discharge cycles.7 The PEDOT/LS hybrid materials display a discharge capacity of 34 mA h g−1 and retain 83% of the capacity after 1000 charge–discharge cycles.6 The PEDOT/LS/PAAQ hybrid materials present a discharge capacity of 80 mA h g−1 and a retention capacity of 80% after 10![[thin space (1/6-em)]](https://www.rsc.org/images/entities/char_2009.gif) 000 charge–discharge cycles.47 These LS/polymer materials present higher stability (except for the polypyrrole/LS), but as we expressed in the introduction, are difficult to use because of the cost. A LS/reduced graphene oxides hybrid material exhibits a discharge capacity of 72 mA h g−1 and 96% retention after 3000 cycles.8 Even though this material shows better capacity and stability, the complicated preparation processes and use of harmful reactant hinder scalable application. Meanwhile, a kraft lignin/conductive carbon material displays a discharge capacity of 80 mA h g−1 and the redox peaks from lignin disappear after only 70 cycles.48 A kraft lignin/carbon nanotubes hybrid material exhibits a discharge capacity of 28.7 mA h g−1 and retains a capacity of 93% after 500 charge–discharge cycles.49
000 charge–discharge cycles.47 These LS/polymer materials present higher stability (except for the polypyrrole/LS), but as we expressed in the introduction, are difficult to use because of the cost. A LS/reduced graphene oxides hybrid material exhibits a discharge capacity of 72 mA h g−1 and 96% retention after 3000 cycles.8 Even though this material shows better capacity and stability, the complicated preparation processes and use of harmful reactant hinder scalable application. Meanwhile, a kraft lignin/conductive carbon material displays a discharge capacity of 80 mA h g−1 and the redox peaks from lignin disappear after only 70 cycles.48 A kraft lignin/carbon nanotubes hybrid material exhibits a discharge capacity of 28.7 mA h g−1 and retains a capacity of 93% after 500 charge–discharge cycles.49
Comparing with these lignin materials, our LS/graphite hybrid materials display moderate discharge capacity and stability. The leakage of LS from the electrode leads to the loss of discharge capacity in the electrode. However, by washing away loosely bound LS, the stability improves and the original discharge capacity does not decline (Fig. S10b†). The LS on the surface of the electrode is washed away during the washing process and the LS in the bulk of the electrode is bound more strongly to graphite. So the discharge capacity of the electrode does not decline rapidly with increasing charge rate after the washing process (Fig. S10b†).
The self-discharge rate is another important parameter for the electrodes. A high self-discharge rate of electrodes leads to loss of energy, power and frequent need of recharging of the electrochemical capacitor. The voltage drop in self-discharge of electrodes is associated with charge redistribution and redox reactions contributing via diffusion.50 In our self-discharge plot of LS/graphite (4/1, w/w) hybrid material electrodes (Fig. S11a†), the voltage declines from 0.70 V to 0.52 V in the first 5000 seconds, then becomes relatively stable and ends at 0.47 V after 12 hours. The plot of the potential versus log time (Fig. S11b†) shows a linear dependence, indicating an activation controlled self-discharge mechanism. When plotting potential versus the square root of time (Fig. S11c†), the poor linear fit indicates that diffusion process does not dominate the self-discharge.50
The thickness, conductivity, discharge capacity and final stoichiometry of LS/graphite hybrid electrodes with different primary stoichiometry are summarized in Table 1. We see no major influence of the starting stoichiometry on discharge capacity, but some on the electronic conductivity, where the conductivity range from 70 to 290 S m−1. LS/graphite (1/1, w/w) hybrid material electrodes show lower conductivity than the other, which is due to the poor morphology according to the SEM images (Fig. 4c). Moreover, the electrodes with different primary stoichiometry show similar discharge capacity, from 30 to 35 mA h g−1, which means the conductivity does not influence the discharge capacity of the electrodes.
Conclusions
We have demonstrated that milling of LS and graphite can lead to exfoliation and shearing of graphite as well as molecular interaction between LS and graphite in the LS/graphite hybrid material electrodes. In our work, LS acts as surfactant to exfoliate the graphite into fewer layers graphene and make it collapse into smaller flakes (50 nm to 2000 nm) via the shear and impact force during the solvent-free mechanical milling process. The hybrid material electrodes show a discharge capacity of 35 mA h g−1 and a conductivity of 280 S m−1. The discharge capacity from Q groups contributes approximately 80% of the total discharge capacity. The gradual loss of the discharge capacity is due to the leakage of the LS on the surface of the electrode material.In summary, we have thus introduced a simple processing method, mechanical ball milling combined with aqueous processing, to fabricate sustainable, low cost, nontoxic and scalable LS/graphite hybrid materials with high conductivity and moderate discharge capacity. The molecular interaction and charge transfer between LS and graphite in the electrodes make these electrodes candidates for energy storage.
Conflicts of interest
A patent application on the method has been submitted.Acknowledgements
The work was funded by the Knut and Alice Wallenberg foundation (KAW), through a Wallenberg Scholar grant to O. I. We thankfully acknowledge financial support from the Swedish Government Strategic Research Area in Materials Science on Functional Materials at Linköping University (Faculty Grant SFO-Mat-LiU No. 2009 00971). L. L acknowledges China Scholarship Council (CSC) for financial support.References
- O. Inganäs and S. Admassie, Adv. Mater., 2014, 26, 830–848 CrossRef PubMed.
- G. Milczarek, Electroanalysis, 2007, 19, 1411–1414 CrossRef CAS.
- G. Milczarek and O. Inganas, Science, 2012, 335, 1468–1471 CrossRef CAS PubMed.
- C. Heitner, D. Dimmel and J. Schmidt, Lignin and lignans: advances in chemistry, CRC press, 2016 Search PubMed.
- G. Milczarek, Langmuir, 2009, 25, 10345–10353 CrossRef CAS PubMed.
- F. Ajjan, N. Casado, T. Rębiś, A. Elfwing, N. Solin, D. Mecerreyes and O. Inganäs, J. Mater. Chem. A, 2016, 4, 1838–1847 RSC.
- F. Ajjan, M. J. Jafari, T. Rębiś, T. Ederth and O. Inganäs, J. Mater. Chem. A, 2015, 3, 12927–12937 RSC.
- S. K. Kim, Y. K. Kim, H. Lee, S. B. Lee and H. S. Park, ChemSusChem, 2014, 7, 1094–1101 CrossRef CAS PubMed.
- A. M. Navarro-Suárez, N. Casado, J. Carretero-González, D. Mecerreyes and T. Rojo, J. Mater. Chem. A, 2017, 5, 7137–7143 RSC.
- X. Geng, Y. Zhang, L. Jiao, L. Yang, J. Hamel, N. Giummarella, G. Henriksson, L. Zhang and H. Zhu, ACS Sustainable Chem. Eng., 2017, 5, 3553–3561 CrossRef CAS.
- W. S. Hummers Jr and R. E. Offeman, J. Am. Chem. Soc., 1958, 80, 1339 CrossRef.
- C. K. Chua and M. Pumera, Chem. Soc. Rev., 2014, 43, 291–312 RSC.
- H. Liu, R. Ramnarayanan and B. E. Logan, Environ. Sci. Technol., 2004, 38, 2281–2285 CrossRef CAS PubMed.
- M. Zhou, M. Chi, J. Luo, H. He and T. Jin, J. Power Sources, 2011, 196, 4427–4435 CrossRef CAS.
- S. K. Chaudhuri and D. R. Lovley, Nat. Biotechnol., 2003, 21, 1229 CrossRef CAS PubMed.
- Z. L. Xu, J. Park, G. Yoon, H. Kim and K. Kang, Small Methods, 2019, 3, 1800227 CrossRef CAS.
- M. M. Doeff, Y. Ma, S. J. Visco and L. C. De Jonghe, J. Electrochem. Soc., 1993, 140, L169–L170 CrossRef CAS.
- Y. Sun, N. Liu and Y. Cui, Nat. Energy, 2016, 1, 1–12 Search PubMed.
- M. Winter and J. O. Besenhard, Electrochim. Acta, 1999, 45, 31–50 CrossRef CAS.
- T. X. H. Le, M. Bechelany and M. Cretin, Carbon, 2017, 122, 564–591 CrossRef CAS.
- R. N. Adams, Anal. Chem., 1958, 30, 1576 CrossRef CAS.
- I. Švancara, K. Vytřas, K. Kalcher, A. Walcarius and J. Wang, Electroanalysis, 2009, 21, 7–28 CrossRef.
- K. Vytřas, I. Švancara and R. Metelka, J. Serb. Chem. Soc., 2009, 74, 1021–1033 CrossRef.
- A. Krueger, Carbon materials and nanotechnology, John Wiley & Sons, 2010 Search PubMed.
- M. F. El-Kady, Y. Shao and R. B. Kaner, Nat. Rev. Mater., 2016, 1, 16033 CrossRef CAS.
- A. Ciesielski and P. Samorì, Chem. Soc. Rev., 2014, 43, 381–398 RSC.
- S. Sampath, A. N. Basuray, K. J. Hartlieb, T. Aytun, S. I. Stupp and J. F. Stoddart, Adv. Mater., 2013, 25, 2740–2745 CrossRef CAS PubMed.
- Y. Toumia, S. Orlanducci, F. Basoli, S. Licoccia and G. Paradossi, J. Phys. Chem. B, 2015, 119, 2051–2061 CrossRef CAS PubMed.
- W. Liu, R. Zhou, D. Zhou, G. Ding, J. M. Soah, C. Y. Yue and X. Lu, Carbon, 2015, 83, 188–197 CrossRef CAS.
- M. A. S. Badri, M. M. Salleh, N. F. a. M. Noor, M. Y. A. Rahman and A. A. Umar, Mater. Chem. Phys., 2017, 193, 212–219 CrossRef.
- J. Ding, H. Zhao, Y. Zheng, Q. Wang, H. Chen, H. Dou and H. Yu, Nanotechnology, 2018, 29, 095603 CrossRef PubMed.
- U. Khan, H. Porwal, A. O'Neill, K. Nawaz, P. May and J. N. Coleman, Langmuir, 2011, 27, 9077–9082 CrossRef CAS PubMed.
- F. L. Encke, J. Chem. Educ., 1970, 47, 575 CrossRef CAS.
- R. Szymanowitz, J. Chem. Educ., 1939, 16, 413 CrossRef CAS.
- S. L. James, C. J. Adams, C. Bolm, D. Braga, P. Collier, T. Friščić, F. Grepioni, K. D. Harris, G. Hyett and W. Jones, Chem. Soc. Rev., 2012, 41, 413–447 RSC.
- V. Leon, M. Quintana, M. A. Herrero, J. L. Fierro, A. de la Hoz, M. Prato and E. Vazquez, Chem. Commun., 2011, 47, 10936–10938 RSC.
- V. León, A. M. Rodriguez, P. Prieto, M. Prato and E. Vázquez, ACS Nano, 2014, 8, 563–571 CrossRef.
- L. Liu, Z. Xiong, D. Hu, G. Wu and P. Chen, Chem. Commun., 2013, 49, 7890–7892 RSC.
- Z. Li and Y. Ge, J. Braz. Chem. Soc., 2011, 22, 1866–1871 CrossRef CAS.
- V. Chabot, B. Kim, B. Sloper, C. Tzoganakis and A. Yu, Sci. Rep., 2013, 3, 1378 CrossRef PubMed.
- A. Ferrari, S. Rodil and J. Robertson, Phys. Rev. B: Condens. Matter Mater. Phys., 2003, 67, 155306 CrossRef.
- A. C. Ferrari, Solid State Commun., 2007, 143, 47–57 CrossRef CAS.
- K. Zhang, Y. Zhang and S. Wang, Sci. Rep., 2013, 3, 3448 CrossRef PubMed.
- C. Liu, X. Liu, J. Tan, Q. Wang, H. Wen and C. Zhang, J. Power Sources, 2017, 342, 157–164 CrossRef CAS.
- F. Tuinstra and J. L. Koenig, J. Chem. Phys., 1970, 53, 1126–1130 CrossRef CAS.
- M. R. Snowdon, A. K. Mohanty and M. Misra, ACS Sustainable Chem. Eng., 2014, 2, 1257–1263 CrossRef CAS.
- F. N. Ajjan, M. Vagin, T. Rębiś, L. E. Aguirre, L. Ouyang and O. Inganäs, Adv. Sustainable Syst., 2017, 1, 1700054 CrossRef.
- S. Chaleawlert-umpon, T. Berthold, X. Wang, M. Antonietti and C. Liedel, Adv. Mater. Interfaces, 2017, 4, 1700698 CrossRef.
- G. Milczarek and M. Nowicki, Mater. Res. Bull., 2013, 48, 4032–4038 CrossRef CAS.
- H. A. Andreas, J. Electrochem. Soc., 2015, 162, A5047–A5053 CrossRef CAS.
Footnote |
| † Electronic supplementary information (ESI) available: Figures and stoichiometry calculation methods. See DOI: 10.1039/c9ra07507k |
| This journal is © The Royal Society of Chemistry 2019 |

