
 Open Access Article
 This Open Access Article is licensed under a
 Creative Commons Attribution 3.0 Unported Licence
Preparation of an Fe2Ni MOF on nickel foam as an efficient and stable electrocatalyst for the oxygen evolution reaction†
Xintong Ling‡
ac,
Feng Du‡ac,
Yintong Zhangac,
Yan Shence,
Tao Li *b,
Ahmed Alsaedif,
Tasawar Hayatfg,
Yong Zhou*acd and
Zhigang Zouacd
*b,
Ahmed Alsaedif,
Tasawar Hayatfg,
Yong Zhou*acd and
Zhigang Zouacd
aSchool of Physics, National Laboratory of Solid State Microstructures, Nanjing University, Nanjing, Jiangsu 210093, P. R. China. E-mail: zhouyong1999@nju.edu.cn
bEngineering Technology Research Center of Henan Province for Solar Catalysis, School of Chemistry and Pharmaceutical Engineering, Nanyang Normal University, Nanyang, Henan 473061, P. R. China. E-mail: ltao84@163.com
cJiangsu Key Laboratory for Nano Technology, Nanjing University, Nanjing, Jiangsu 210093, P. R. China
dKunshan Innovation Institute of Nanjing University, Kunshan, Jiangsu 215347, P. R. China
eCollege of Engineering and Applied Sciences, Nanjing University, Nanjing 210093, P. R. China
fFaculty of Science, King Abdulaziz University, Jeddah 21589, Saudi Aribia
gDepartment of Mathematics, Quaid-I-Azam University, Islamabad 45320, Pakistan
First published on 18th October 2019
Abstract
Metal–organic frameworks (MOFs) as versatile templates for preparing transition metal compounds has received wide attention. Benefiting from their diversified spatial structure and controllable chemical constituents, they have become a research hotspot in the field of electrocatalytic water splitting. Herein, Fe2Ni-MIL-88B MOF on nickel foam (Fe2Ni MOF/NF) has been prepared through a one-pot method growth process. Compared with Fe MOF/NF and Ni MOF/NF, the interaction between Fe3+ and Ni2+ in Fe2Ni MOF/NF accelerates the electron transfer through the oxygen of the ligand, leading to increased 3d orbital electron density of Ni, which enhances the activity of the oxygen evolution reaction (OER) in alkaline solution. Fe2Ni MOF/NF provides a current density of 10 mA cm−2 at a low overpotential of 222 mV, and its Tafel slope is also very small, reaching 42.39 mV dec−1. The success of the present Fe2Ni MOF/NF catalyst is attributed to the abundant active centers, the bimetallic clusters Fe2Ni-MIL-88B, the positive coupling effect between Ni and Fe metal ions in the MOF, and synergistic effect between the MOF and NF. Besides, Fe2Ni MOF/NF possesses excellent stability over 50 h of continuous operation, providing feasibility for commercial use.
1. Introduction
In the last few years, with the rapid development of industrial production and the increasing population, the demand for fossil energy has increased.1 However, environmental pollution and global warming have driven the necessity of searching for clean energy. It is imperative to exploit and utilize renewable energy.2–4 Electrocatalytic water splitting is a research director with great potential at present, which includes two half-reactions: the oxygen evolution reaction (OER) and the hydrogen evolution reaction (HER). Due to involving multiple reaction steps from water to O2, the OER process has been considered as the bottleneck.5 Some noble-metal-based materials, such as RuO2 and IrO2, have relatively high electrocatalytic activity for the OER. However, their scarcity limits their large-scale application.6,7 The search for OER electrocatalysts with high efficiency and low cost of nonprecious metal materials has become an important task.Transition metal compounds have been widely reported as effective OER electrocatalytic materials, including oxides, hydroxides, sulfides, nitrides and phosphides.8–14 Meanwhile, it is necessary to design rational engineering, in which the active sites should be fully exposed. Here, as a new nano-porous material with special structure, metal–organic framework (MOF) has some unique properties, including tunable pore sizes, large specific surface area, and perfect nanostructures. And it has obtained exciting application value in energy storage, catalysis, gas storage, etc.15–21 Generally, due to the low conductivity and stability of single metal MOF, it is rarely used as a direct electrocatalyst.22 The mixed metal MOF material was relatively stable and efficient. Besides, the bimetallic nickel-iron composites were identified as one of the most promising electrocatalysts for the OER, in which the interaction between metals could promote the process of electrocatalytic reaction. Therefore, nickel-iron MOF material would show great potential for development in water splitting.23,24
In our work, Fe and Ni-based MOF on nickel foam (NF) had been prepared by a one-pot method, which was known as Fe2Ni-MIL-88B MOF (Fe2Ni MOF). This MOF exhibited a loose nanosheet structure. And the bimetallic system accelerated the electron transfer between Fe3+ and Ni2+ through the oxygen of the ligand to increase 3d orbital electron density of Ni.25,26 Fe2Ni MOF is different from other NiFe MOF. Firstly, this MOF was a composite of Fe and Ni, not a mixture of Fe MOF and Ni MOF, so that electron transfer can be carried out between the Fe and Ni elements to improve OER activity. Secondly, Fe2Ni MOF's ligand was different from other Ni Fe MOF, so it has a special morphology that could increase the active site. Finally, the success of the present Fe2Ni MOF/NF catalyst is attributed to the synergistic effect between the MOF and NF. Specifically, compared with the monometallic MOF materials (Fe MOF/NF and Ni MOF/NF), Fe2Ni MOF/NF had better performance in OER. It exhibited a low overpotential of 222 mV at a current density of 10 mA cm−2, and a small Tafel slope of 42.39 mV dec−1. More importantly, Fe2Ni MOF/NF possessed excellent electrochemical durability of 50 hours for potential applications in the future.
2. Experimental
2.1. Preparation of Fe2Ni MOF/NF, Fe MOF/NF, and Ni MOF/NF
Generally, a small piece of nickel foam (NF) (1 × 6 cm) ultrasonically was washed in acetone, water, hydrochloric acid and ethanol to remove organic residues on the surface before use. The Fe2Ni MOF/NF was prepared by a one-pot method. First, 0.7 mmol Fe(NO)3·9H2O (0.2828 g) and 0.3 mmol NiCl2·6H2O (0.0713 g) were dissolved in N,N-dimethyl formamide (DMF). Then 1 mmol terephthalic acid (TPA), 2.5 mL deionized water and 2.5 mL ethanol was slowly added to the above solution with continuous stirring. After 30 minutes, the mixture was transferred to a 50 mL Teflon-lined stainless-steel autoclave. Then the processed NF was immersed in the mixture. The autoclave was then placed in an oven at 125 °C for 12 hours. After natural cooling, Fe2Ni MOF/NF was taken out and washed several times with deionized water and ethanol, and dried at 60 °C for 2 hours. Fe MOF/NF and Ni MOF/NF could be synthesized in the same way without adding NiCl2·6H2O or Fe(NO)3·9H2O, respectively.2.2. Material characterization
The crystalline phase of the sample was obtained on a Rigaku Ultima III diffractometer using X-ray diffraction (XRD) with CuKα radiation (λ = 0.154178 nm). The scan range was 5–40° and the scan speed was 2.4 degrees per minute. The morphology and energy-dispersion X-ray spectroscopy (EDX) of the various samples was observed with scanning electron microscopy (SEM) and performed with an S-3400 N II instrument. X-ray photoelectron spectroscopy (XPS, PHI 5000 Versa Probe UlVAC-PHI, Japan) was used to obtain the XPS data of the materials, with reference to C 1s (binding energy of 284.8 eV).2.3. Electrochemical measurements
The electrochemical activity of all samples was tested using a 1.0 M KOH solution in a typical three-electrode configuration using a CHI660E electrochemical workstation analyzer. The standard Ag/AgCl electrode was used as the reference electrode while the carbon rod and the synthetic sample was used as the counter electrode and the working electrode, respectively. The linear sweep voltammograms (LSV) for OER was carried out in 1.0 M KOH at a scan rate of 2 mV s−1. In order to eliminate the interference of the solution resistance, all measured LSV were iR-corrected. A constant current of 10 mA cm−2 was used for measuring long-term electrochemical stability. The recording frequency range for electrochemical impedance spectroscopy (EIS) measurement was 100 kHz to 0.01 Hz. All of the potentials herein were converted to the corresponding potentials relative to RHE using the following equation: ERHE = EAg/AgCl + 0.197 + 0.0591 × pH, where ERHE was the potential measured relative to the potential of RHE and the EAg/AgCl was the potential measured by the Ag/AgCl (3 M KCl) reference electrode, respectively.3. Results and discussion
In this report, the method for preparing Fe2Ni MOF grown on NF was illustrated in Scheme 1. During the solvothermal reaction, Fe2Ni MOF were formed in an orderly way on the surface of the NF (Fig. S1†). The composition of the three products was studied by X-ray diffraction (XRD) pattern by using the powder scraped from the corresponding substrates as shown in Fig. 1. The XRD pattern of Ni MOF has two sharp peaks at 9.3° and 18.5°, which match well with the (100) and (200) planes of [Ni3(OH)2 (C8H4O2)2(H2O)4] (CCDC no. 638866†).27 Fe MOF was confirmed with the diffraction pattern of Fe3-MIL-88B.28 In patterns of Fe2Ni MOF samples, the main diffraction peaks that appeared around 2θ of 7.3°, 8.9°, 9.3°, 9.9°, 16.8°, 17.7°, and 21.9° are similar to those previously reported for MIL-88B.28 The MIL-88B structure was established as the prominent and characteristic planes (100), (101) and (002) appeared.29 Additionally, we can see that the Bragg peaks of the XRD patterns show displacements. Férey et al. have reported that the swelling up of the MIL-88B structure causes the splitting and shifting to a low 2θ of the planes (100) and (101).30 With the presence of Ni2+ in the reaction solution, MIL-88B crystals were made up and the crystallinity of the material increased.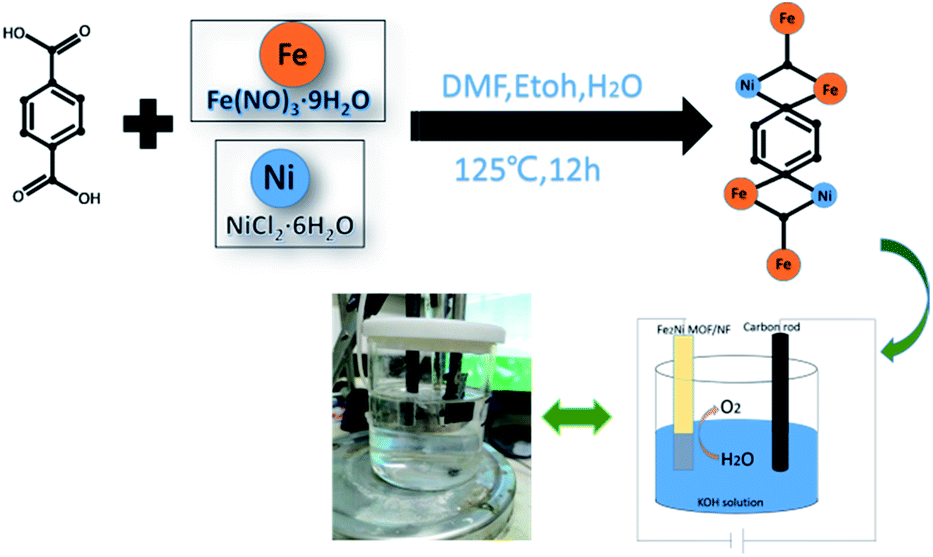 | ||
| Scheme 1 Fe2Ni-MIL-88B MOF on nickel foam (Fe2Ni MOF/NF) has been prepared through a one-pot method growth process. | ||
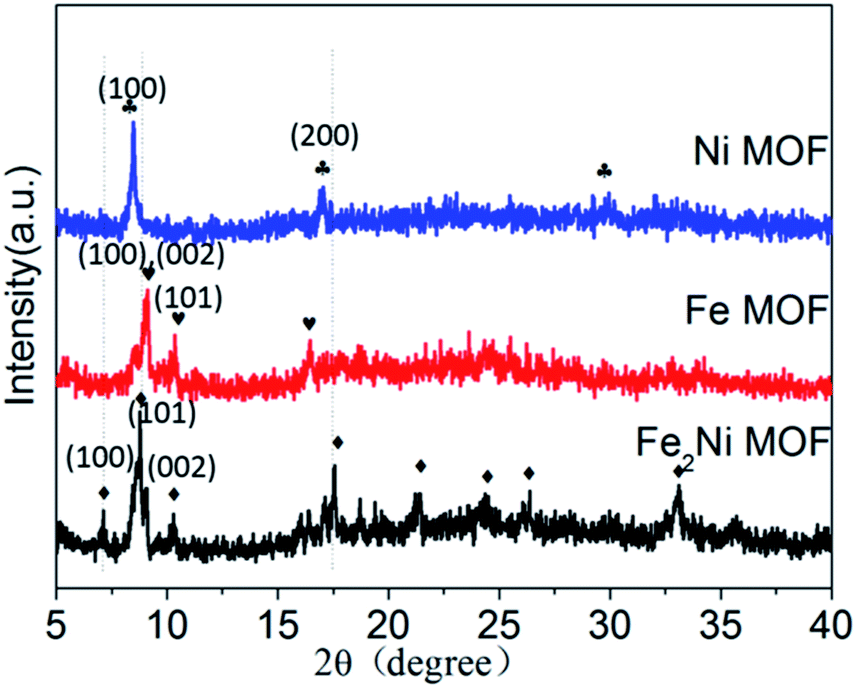 | ||
| Fig. 1 XRD patterns of Fe2Ni MOF/NF, Fe MOF/NF, and Ni MOF/NF. | ||
SEM images showed the morphology of Ni MOF/NF, Fe MOF/NF and Fe2Ni MOF/NF (Fig. 2a, c, and e), respectively. As shown in Fig. 2a, Ni MOF showed the structure of nanosheet arrays and the uniform coverage over the backbone surface of the NF (Fig. S2a and b†).31 While Fe MOF/NF had the typical shell-like morphology. Fe2Ni MOF/NF exhibited a spindle shape, which different from Ni MOF and Fe MOF. So they have different compositions, crystal structure, and the pore structure, their morphology is completely different. Fig. S3† reveals that the Fe2Ni MOF/NF still maintains its spindle shape after the stability test. And the samples with different ratios of Ni to Fe (Fig. S3a and b†), from SEM images of Fe![[thin space (1/6-em)]](https://www.rsc.org/images/entities/char_2009.gif) :Ni = 3:7 and Fe:Ni = 5:5, we can find that they have sheet structure similar to Ni MOF, which imply they have a mixture of Ni MOF and Fe2Ni MOF. SEM image of Fe2Ni MOF (Fig. 2g) and high-quality EDS images into Fig. 2h and i clearly shows the presence of Fe and Ni elements in the Fe2Ni MOF. The TEM images of Fe2Ni MOF/NF, Ni MOF, and Fe MOF confirmed the respective morphological characteristics. And the selected area electron diffraction (SAED) of the three insets (Fig. 2b, d, and f) indicated the single-crystal of the samples. Additionally, from SAED of Fe2Ni MOF, the interplanar distances of (101) and (002) are 0.35 nm and 0.96 nm,32,33 which matched with the XRD results.
:Ni = 3:7 and Fe:Ni = 5:5, we can find that they have sheet structure similar to Ni MOF, which imply they have a mixture of Ni MOF and Fe2Ni MOF. SEM image of Fe2Ni MOF (Fig. 2g) and high-quality EDS images into Fig. 2h and i clearly shows the presence of Fe and Ni elements in the Fe2Ni MOF. The TEM images of Fe2Ni MOF/NF, Ni MOF, and Fe MOF confirmed the respective morphological characteristics. And the selected area electron diffraction (SAED) of the three insets (Fig. 2b, d, and f) indicated the single-crystal of the samples. Additionally, from SAED of Fe2Ni MOF, the interplanar distances of (101) and (002) are 0.35 nm and 0.96 nm,32,33 which matched with the XRD results.
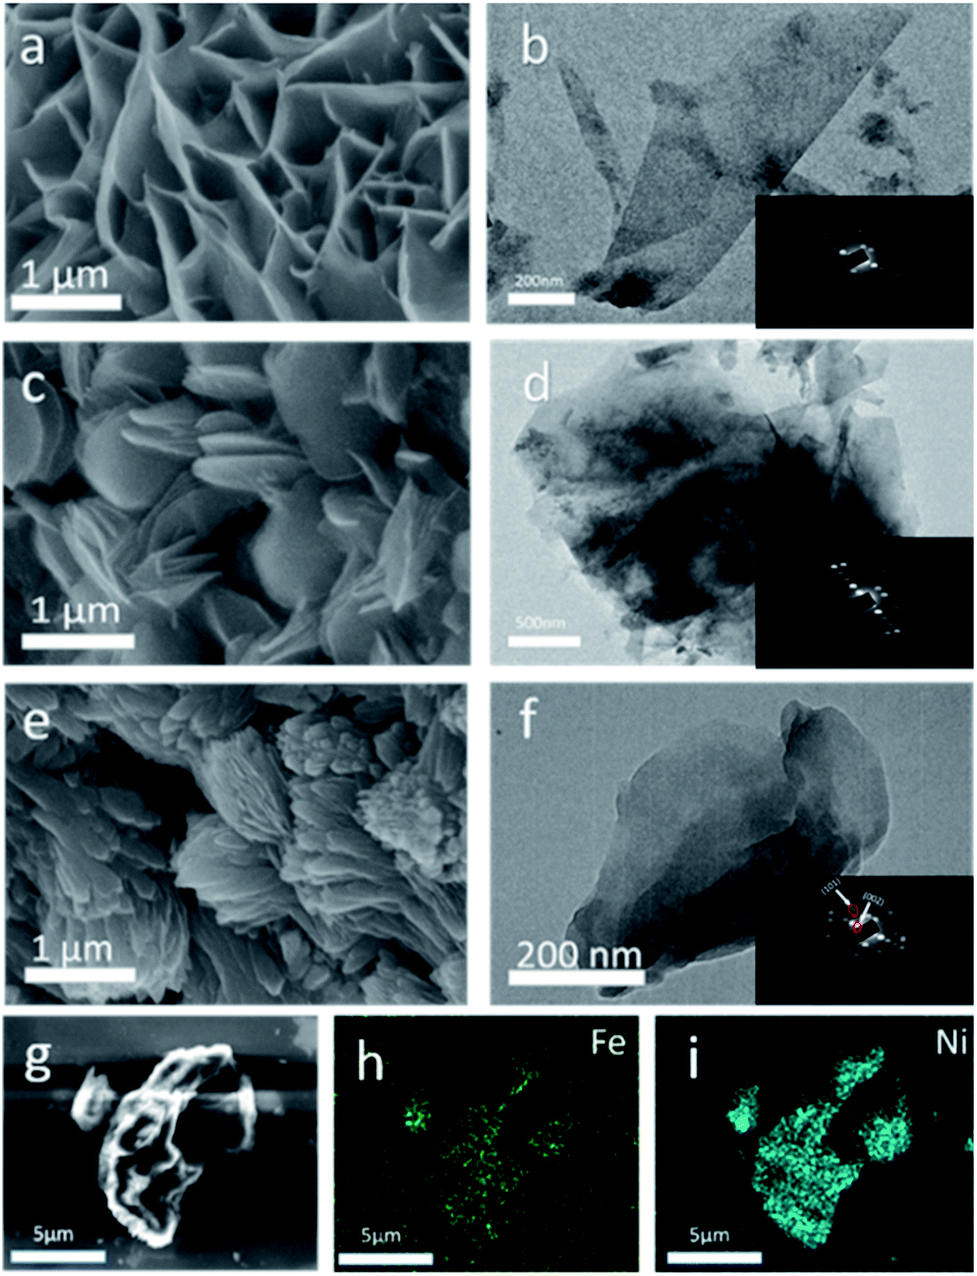 | ||
| Fig. 2 SEM images of (a) Ni MOF/NF, (c) Fe MOF/NF and (e) Fe2Ni MOF/NF, (b, d, and f) TEM images of Ni MOF/NF, Fe MOF/NF, and Fe2Ni MOF/NF. (Inset of b, d, and f): SAED pattern of Ni MOF/NF, Fe MOF/NF, and Fe2Ni MOF/NF. (g) SEM image of the Fe2Ni MOF/NF. EDS mapping images of (h) Fe and (i) Ni for the Fe2Ni MOF. | ||
The XPS survey spectra for Fe2Ni MOF/NF revealed the existence of the four main constituent elements of the samples, including Fe, Ni, C, O (Fig. S4a†). The peak positions of Fe 2p and Ni 2p elements were corrected by C 1s spectra (Fig. S4b†). In the high-resolution Fe 2p spectra, the two main peaks of Fe2Ni MOF/NF related to the Fe 2p3/2 and Fe 2p1/2 electron configurations were located at 714 and 725.5 eV (Fig. 3a), suggesting the +3 oxidation state of Fe.34 The spectra of Ni 2p could be deconvoluted to exhibit binding energy peaks at around 856.3 eV and 874.1 eV for Ni 2p3/2 and Ni 2p1/2, respectively (Fig. 3b), confirming the +2 oxidation state of Ni in Fe2Ni MOF/NF.35 In comparison with Fe MOF/NF and Ni MOF/NF, the Fe 2p spectrum shifted to higher binding energy and Ni 2p spectrum shifted to lower binding energy. It implied the partial electron transfer from Fe3+ to Ni2+ through the oxygen of the ligand.36,37 And the Ni 2p3/2 and Ni 2p1/2 peaks in Fe2Ni MOF/NF were located at lower binding energy, indicating an increase of 3d orbital electron density of Ni.38,39 It was reported that the Ni site with electron-rich structure will increase OER activity because the OER activity of the transition metal-based material was determined by the interaction of the adsorbed OOH species with the 3d orbital of the transition metal.40,41 From the deconvoluted XPS of C 1s in Fig. S4b,† three peaks located at 283.1, 283.6 and 283.4 eV are assigned to adventitious hydrocarbon, C–O, and carbonate species, respectively. The O 1s XPS of the prepared samples were fitted into three peaks at 531.54, 531.99, and 531.82 eV (Fig. S4c†). Meanwhile, all the prepared samples have almost the same C 1s and O 1s binding energies, indicating that they are in the same chemical states.42
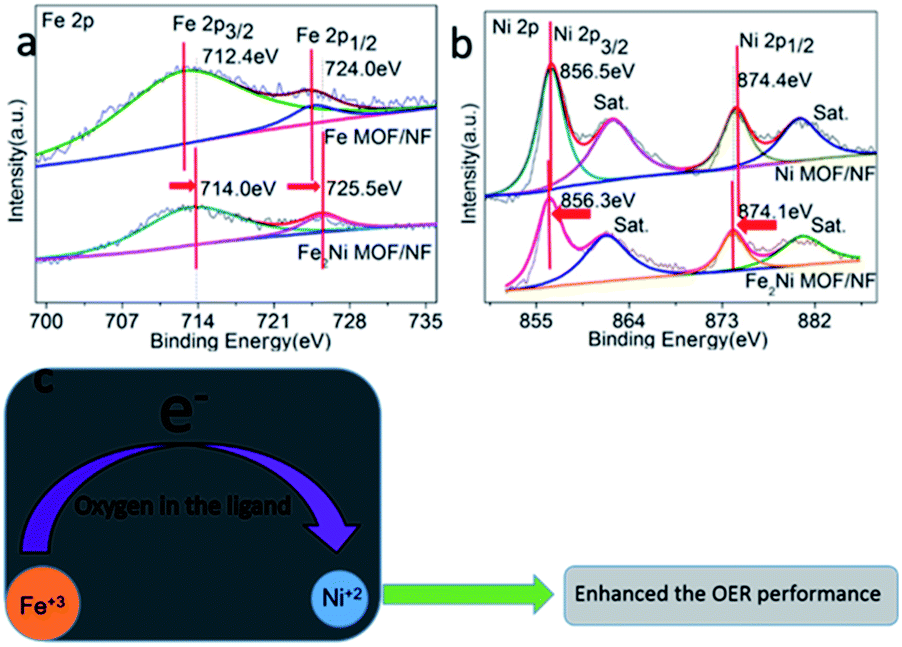 | ||
| Fig. 3 High-resolution XPS spectra of (a) Fe 2p and (b) Ni 2p of the as-prepared samples. (c) The interaction between Ni and Fe during the OER processes. | ||
The OER activities of the as-synthesized samples were evaluated in 1.0 M KOH (pH = 14). Fig. 4a showed the LSV curves of Fe2Ni MOF/NF, Ni MOF/NF, Fe MOF/NF, and blank NF. Due to the transfer of electrons between Fe and Ni. The OER activity of the transition metal-based material was determined by the interaction of the adsorbed OOH species with the 3d orbital of the transition metal. Fe2Ni MOF/NF exhibited the highest OER activity. There was an oxidation peak in the process of the rising LSV curve.43 So we select the data of the inverse curve of CV. It only required an overpotential of 222 mV at 10 mA cm−2 (Fig. S5a†). The Tafel slope of the corresponding electrode could be seen from Fig. 4b, where Fe2Ni MOF/NF showed the smallest Tafel slope (42.39 mV dec−1) since the electrons in Fe are transferred to Ni. The EIS was performed at 1.63 V (vs. RHE) to further study the OER kinetic characteristics of the electrodes. From the Nyquist plots in Fig. 4c, benefiting from the interaction between Fe3+ and Ni2+, the charge-transfer resistance (Rct) of Fe2Ni MOF/NF was much less than that of Ni MOF/NF and Fe MOF/NF. Fig. 5a–d expressed the MOF of Fe:Ni = 7:3 performed as the best OER activity compared to Fe:Ni = 3:7 and Fe:Ni = 5:5. Because the electrons in Fe are fully transferred to Ni when the Ratio was 7:3. For commercial water splitting, the electrode material should have excellent long-term stability. Here, the Fe2Ni MOF/NF electrode was tested with chronopotentiometry (V–t) measurements, the achieved current densities increased by only 3.7% compared with the initial after a 50 h continuous operation (Fig. 4d). In addition, there was no obvious attenuation between the LSV curves obtained before and after the stability test, indicating that the Fe2Ni MOF/NF not only had good OER activity but also provided excellent electrochemical stability (insets of Fig. 4d). The activity comparison with recently reported MOF catalysts was conducted in Table S3.†
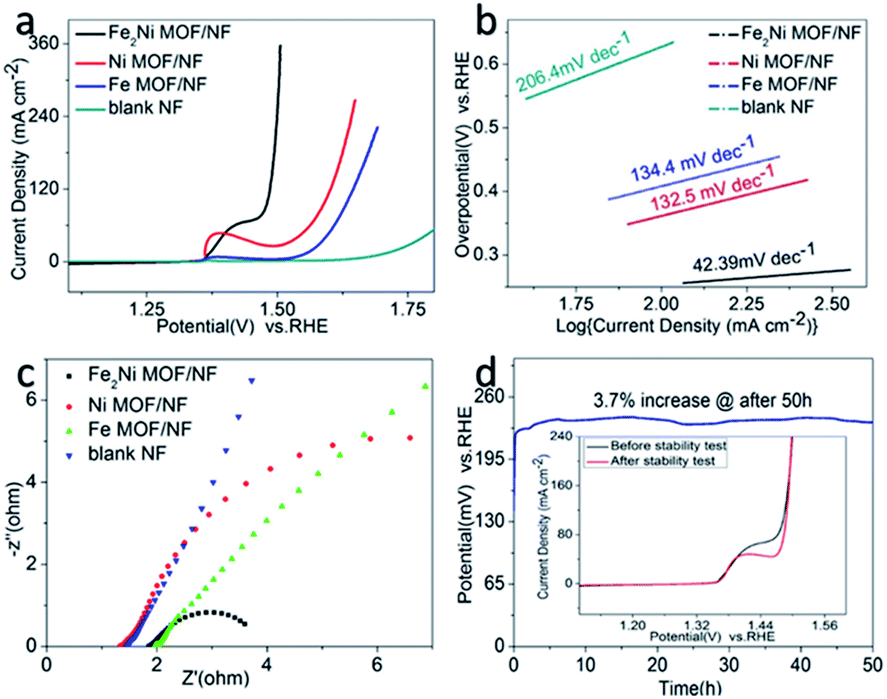 | ||
| Fig. 4 (a) CV curves, (b) Tafel plots and (c) Nyquist plots of Fe2Ni MOF/NF, Ni MOF/NF, Fe MOF/NF and blank NF. (d) Chronopotentiometric durability of Fe2Ni MOF/NF at 10 mA cm−2 for 50 h. (Insets of d) LSV curves of Fe2Ni MOF/NF before and after the long-term test. | ||
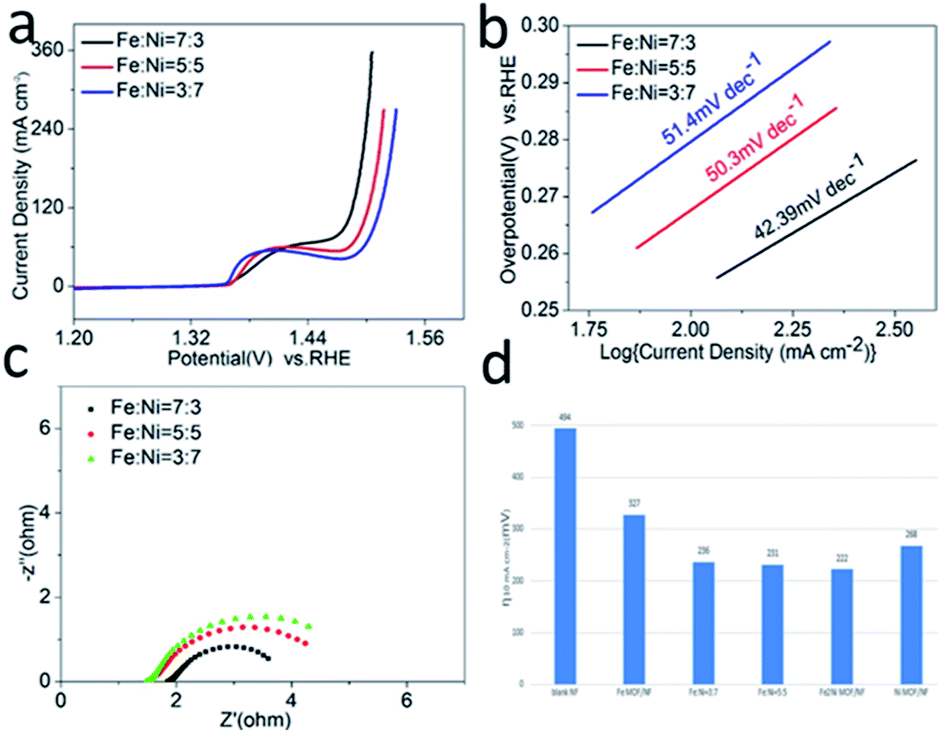 | ||
| Fig. 5 (a) LSV curves, (b) Tafel plots, and (c) Nyquist plots of Fe:Ni = 7:3, Fe:Ni = 5:5 and Fe:Ni = 3:7. (d) Overpotentials of Fe MOF, Ni MOF and FeNi MOF at 10 mA cm−2 vs. RHE. | ||
4. Conclusions
In conclusion, an efficient and durable Fe2Ni MOF/NF was prepared by a one-pot method. Compared to the Fe MOF/NF and Ni MOF/NF, the Fe2Ni MOF/NF exhibited more effective OER activity owing to the interaction between Fe3+ and Ni2+. The Ni site with an electron-rich structure will increase OER activity because the OER activity of the transition metal-based material was determined by the interaction of the adsorbed OOH species with the 3d orbital of the transition metal. As a result, Fe2Ni MOF/NF had a low OER overpotential of 222 mV at 10 mA cm−2 and a small Tafel slope of 42.39 mV dec−1. In addition, its long-term stability provided the possibility for commercial water splitting applications.Conflicts of interest
There are no conflicts to declare.Acknowledgements
This work was supported by NSF of China (No. 21972065, 21773114), NSF of Jiangsu Province (No. BK20171246), the Fundamental Research Funds for the Central University (020414380135) and Nanjing University Innovation and Creative Program for PhD candidate (CXCY18-15).References
- S. D. Tilley, Adv. Energy Mater., 2019, 9, 1802877 CrossRef.
- Z. W. Seh, J. Kibsgaard, C. F. Dickens, I. Chorkendorff, J. K. Norskov and T. F. Jaramillo, Science, 2017, 355, eaad4998 CrossRef.
- H. Jin, C. Guo, X. Liu, J. Liu, A. Vasileff, Y. Jiao, Y. Zheng and S.-Z. Qiao, Chem. Rev., 2018, 118, 6337 CrossRef CAS PubMed.
- X. F. Lu, L. Yu and X. W. Lou, Sci. Adv., 2019, 5, eaav6009 CrossRef CAS.
- Y. Lee, J. Suntivich, K. J. May, E. E. Perry and S.-H. Yang, J. Phys. Chem. Lett., 2012, 3, 399 CrossRef CAS.
- L. C. Seitz, C. F. Dickens, K. Nishio, Y. Hikita, J. Montoya, A. Doyle, C. Kirk, A. Vojvodic, H. Y. Hwang, J. K. Norskov and T. F. Jaramillo, Science, 2016, 353, 1011 CrossRef CAS.
- X. Wang, L. Yu, B. Y. Guan, S. Song and X. W. Lou, Adv. Mater., 2018, 30, 1801211 CrossRef.
- A. Aijaz, J. Masa, C. Reosler, W. Xia, P. Weide, A. J. Botz, R. A. Fischer, W. Schuhmann and M. Muhler, Angew. Chem., Int. Ed., 2016, 554087–554091 Search PubMed.
- X. Wang, L. Yu, B. Y. Guan, S. Song and X. W. Lou, Adv. Mater., 2018, 30, 1801211 CrossRef.
- X. R. Li, J. L. Wei, Q. Li, S. S. Zheng, Y. X. Xu, P. Du, C. Y. Chen, J. Y. Zhao, H. G. Xue, Q. Xu and H. Pang, Adv. Funct. Mater., 2018, 28, 1800886 CrossRef.
- Q. Liu, L. Xie, F. Qu, Z. Liu, G. Du, A. M. Asiri and X. Sun, Inorg. Chem. Front., 2017, 41120–41124 Search PubMed.
- F. Du, L. Shi, Y. T. Zhang, T. Li, J. L. Wang, G. H. Wen, A. Alsaedif, T. Hayatf, Y. Zhou and Z. G. Zou, Appl. Catal., B, 2019, 253, 246–252 CrossRef CAS.
- J. M. V. Nsanzimana, Y. C. Peng, Y. Y. Xu, L. Thia, C. Wang, B. Y. Xia and X. Wang, Adv. Energy Mater., 2018, 8, 1701475 CrossRef.
- F. Du, Y. T. Zhang, H. C. He, T. Li, G. H. Wen, Y. Zhou and Z. G. Zou, J. Power Sources, 2019, 431, 182–188 CrossRef CAS.
- H. Furukawa, K. E. Cordova, M. O'Keeffe and O. M. Yaghi, Science, 2013, 341, 1230444 CrossRef.
- J. Liang, Z. Liang, R. Zou and Y. Zhao, Adv. Mater., 2017, 29, 1702891 Search PubMed.
- M. Zhang, Q. Dai, H. Zheng, M. Chen and L. Dai, Adv. Mater., 2018, 30, 1705431 CrossRef.
- F. Wu, S. Zhang, B. Xu, Z. Feng, D. Sun, X. Ma, J. Zhang, J. Feng and S. Xiong, Adv. Energy Mater., 2018, 8, 1703242 CrossRef.
- X. Zhang, W. Sun, H. Du, R. Kong and F. Qu, Inorg. Chem. Front., 2018, 5, 344–347 RSC.
- Q. Liu, L. Xie, X. Shi, G. Du, A. M. Asiri, Y. Luo and X. Sun, Inorg. Chem. Front., 2018, 5, 1570–1574 RSC.
- T. t. Sun, L. b. Xu, D. s. Wang and Y. d. Li, Nano Res., 2019, 12, 2067–2080 CrossRef CAS.
- S. Zhao, Y. Wang, J. Dong, C.-T. He, H. Yin, P. An, K. Zhao, X. Zhang, C. Gao, L. Zhang, J. Lv, J. Wang, J. Zhang, A. M. Khattak, N. A. Khan, Z. Wei, J. Zhang, S. Liu, H. Zhao and Z. Tang, Nat. Energy, 2016, 1, 16184 CrossRef CAS.
- G. Cai, W. Zhang, L. Jiao, S. Yu and H.-L. Jiang, Chem, 2017, 2, 791–802 CAS.
- A. Jayakumar, R. P. Antony, R. H. Wang and J.-M. Lee, Small, 2017, 13, 1603102 CrossRef.
- C. Serre, C. Mellot-Draznieks, S. Surblé, N. Audebrand, Y. Filinchuk and G. Férey, Science, 2007, 315, 1828 CrossRef CAS.
- S. Zhao, Y. Wang, J. Dong, C. T. He, H. Yin, P. An, K. Zhao, X. Zhang, C. Gao and L. Zhang, Nat. Energy, 2016, 116184 Search PubMed.
- J. Yang, C. Zheng, P. Xiong, Y. Li and M. Wei, J. Mater. Chem. A, 2014, 2, 19005–19010 RSC.
- G.-T. Vuong, M.-H. Pham and T.-O. Do, CrystEngComm, 2013, 15, 9694 RSC.
- V. H. Nguyen, T. D. Nguyen, L. G. Bach, T. Hoang, Q. T. P. Bui, L. D. Tran, C. V. Nguyen, D.-V. N. Vo and S. T. Do, Catalysts, 2018, 8, 487 CrossRef.
- C. Serre, C. Mellot-Draznieks, S. Surblé, N. Audebrand, Y. Filinchuk and G. Férey, Science, 2007, 315, 1828 CrossRef CAS.
- L. Zhang, Y. Ding, R. Li, C. Ye, G. Zhao and Y. Wang, J. Mater. Chem. B, 2017, 5, 5549–5555 RSC.
- R. R. Yuan, C. L. Yue, J. L. Qiu, F. Q. Liu and A. M. Li, Appl. Catal., B, 2019, 251, 229–239 CrossRef CAS.
- D. Kim, G. Lee, S. Oh and M. Oh, Chem. Commun., 2019, 55, 43 RSC.
- D. Senthil Raja, X.-F. Chuah and S.-Y. Lu, Adv. Energy Mater., 2018, 8, 1801065 CrossRef.
- H. Wu, X. Lu, G. Zheng and G. W. Ho, Adv. Energy Mater., 2018, 8, 1702704 CrossRef.
- G. Hai, X. Jia, K. Zhang, X. Liu, Z. Wu and G. Wang, Nano Energy, 2018, 44, 345 CrossRef CAS.
- M. S. Burke, M. G. Kast, L. Trotochaud, A. M. Smith and S. W. Boettcher, J. Am. Chem. Soc., 2015, 137, 3638–3648 CrossRef CAS.
- M. Gorlin, P. Chernev, J. F. De Araujo, T. Reier, S. Dresp, B. Paul, R. Krahnert, H. Dau and P. Strasser, J. Am. Chem. Soc., 2016, 138, 5603–5614 CrossRef.
- N. Li, D. K. Bediako, R. G. Hadt, D. Hayes, T. J. Kempa, F. von Cube, D. C. Bell, L. X. Chen and D. G. Nocera, Proc. Natl. Acad. Sci. U. S. A., 2017, 114, 1486–1491 CrossRef CAS PubMed.
- J. L. Xing, K. L. Guo, Z. H. Zou, M. M. Cai, J. Du and C. L. Xu, Chem. Commun., 2018, 54, 7046 RSC.
- M. Bajdich, M. García-Mota, A. Vojvodic, J. K. Nørskov and A. T. Bell, J. Am. Chem. Soc., 2013, 135, 13521–13530 CrossRef CAS.
- F. q. Zheng, D. Xiang, P. Li, Z. w. Zhang, C. Du, Z. h. Zhuang, X. k. Li and W. Chen, ACS Sustainable Chem. Eng., 2019, 7, 9743–9749 CrossRef CAS.
- J. J. Duan, S. Chen and C. Zhao, Nat. Commun., 2017, 8, 15341 CrossRef CAS PubMed.
Footnotes |
| † Electronic supplementary information (ESI) available. See DOI: 10.1039/c9ra07499f |
| ‡ Ling and Du contributed equally to this work. |
| This journal is © The Royal Society of Chemistry 2019 |