
 Open Access Article
 This Open Access Article is licensed under a Creative Commons Attribution-Non Commercial 3.0 Unported Licence
Regulation of the pyruvate metabolism node by monogene and polygene engineering of HEK-293 cells
Li Xie ,
Junqing Miao,
Xiangchao Li,
Xiaoping Yi* and
Ju Chu
,
Junqing Miao,
Xiangchao Li,
Xiaoping Yi* and
Ju Chu
State Key Laboratory of Bioreactor Engineering, School of Bioengineering, East China University of Science and Technology, 130 Mei Long Road, Xu Hui District, Shanghai 200237, China. E-mail: xpyi@ecust.edu.cn; Tel: +86 21 64253337
First published on 7th November 2019
Abstract
HEK-293 cells are increasingly being used in the production of human adenovirus (HAdV) vaccines. However, the production of HAdV vaccine has not met the requirements of industrial production. Recently, we investigated the effects of various regulatory genes of the pyruvate metabolism node on the substance and energy metabolism and adenovirus reproduction in HEK-293 cells. Initially, single regulatory genes, including pkm2, pdhα, pyc2, mpc3, aralar1, ldha and pdk1, were studied. We found that metabolic performance and adenovirus reproduction capacity in HEK-293 cells were improved, and maximum adenovirus titre was increased approximately 15-fold. Next, we co-overexpressed the key genes, including pkm2, pyc2 and aralar1. The PYC2-A-P-L cells that had the appropriate co-overexpression levels of three genes had the most pronounced regulatory effect. The maximum cell density and maximum specific growth rate were increased by 21% compared with that in the control. The ΔLac/ΔGlc and ΔNH3/ΔGln were decreased by 26% and 27%, respectively. The ATP production rate and the ATP/O2 ratio were increased by 110% and 20%, respectively. The level of reactive oxygen species (ROS) was reduced by 60%. The adenovirus reproductive ability of the PYC2-A-P-L cells was approximately 30-fold higher than that of the control. The results showed that proper overexpression of the aralar1, pkm2 and pyc2 genes can significantly improve the substance and energy metabolism efficiency in HEK-293 cells, maximize the metabolic balance of pyruvate, and ultimately improve HAdV reproduction. This study provides a method of regulation of pyruvate metabolism and polygenic metabolic engineering in mammalian cells cultured in vitro and suggests an effective method for efficient HAdV production.
Introduction
Adenovirus vectors are characterized by efficient infectivity, wide host range, safety and extracellular stability; these vectors are efficient vectors for gene therapy.1 Due to the immunity in a vaccine vector, these vectors have been developed as recombinant vaccines against AIDS, malaria and tuberculosis.2–6 Therefore, achieving efficient production of adenovirus is important. HEK-293 cells have an adenovirus phenotype and are the proper host cells for HAdV; thus, HEK-293 cells are widely used to produce adenoviral vectors and vaccines.7 HAdV titre is usually influenced by physiological and metabolic state of the host cells, such as cell density, accumulation of lactate and ammonia by-products, nutrient availability and metabolic flux distribution.8–12 Moreover, virus replication can induce major changes in cell physiology and metabolic state.13 Adequate and effective supplementation of metabolic precursors to the synthetic pathway and improved metabolic efficiency can significantly influence the synthesis, assembly, release and production of the viral components.14 Therefore, improving the substance and energy metabolism of the host cells is an efficient strategy to increase HAdV titre.Glucose and amino acids are the main sources of the components for biosynthesis and energy production in mammalian cells cultured in vitro.15 In the glycolytic pathway, approximately 95% pyruvate produced from glucose is converted to lactate through lactate dehydrogenase A (LDHA) accompanied by consumption of NADH; only 5% pyruvate enters the TCA cycle to generate energy.16,17 In other words, the production of lactate occurs at the expense of reduction in the flux of pyruvate entering the TCA cycle. To meet the energy requirements, mammalian cells cultured in vitro need to consume a large amount of glutamine to promote mitochondrial metabolism, leading to accumulation of ammonia and an imbalance in the substance and energy metabolism.18 Pyruvate is located at the junction of glycolysis and the TCA cycle and can be transported into the mitochondria to meet the metabolic requirements. Pyruvate can be used to drive ATP production and as a component required for macromolecular biosynthesis and oxidative phosphorylation.19 However, pyruvate can be converted to lactate by LDHA and exported to the extracellular medium. The Warburg effect is an essential result of an imbalance between the maximum rates of glycolysis and pyruvate oxidation.20 Therefore, pyruvate is the key factor for the uncoupling of glycolysis from oxidative phosphorylation in mammalian cells cultured in vitro; additionally, pyruvate is the key node regulating energy metabolism. Increasing the metabolic flux of pyruvate into the TCA cycle is an efficient strategy to improve the balance of the substance and energy metabolism.
The main upstream and downstream enzymes and transporters that regulate pyruvate flux include pyruvate kinase (PK), pyruvate dehydrogenase (PDHα), pyruvate dehydrogenase kinase (PDK1), pyruvate carboxylase (PYC2), lactate dehydrogenase A (LDHA), mitochondrial pyruvate carrier (MPC3) and malate-aspartate NADH shuttle member (Aralar1) (Fig. 1). PK mainly catalyses the conversion of phosphoenolpyruvate (PEP) and ADP to pyruvate and ATP in glycolysis; PK is the key enzyme for regulation of the conversion of glucose to pyruvate. Four subtypes of PK are expressed in mammalian cells, including M1, M2, L and R. PKM2 is the major isoform expressed in proliferating cells that plays the key role in the biosynthetic pathway leading from glucose to the pentose phosphate pathway (PPP) and to biosynthesis of serine and nucleotides.21 Recent studies have shown that PKM2 acts as a glycolytic kinase in the cytoplasm and functions as a protein kinase in the nucleus; the expression level of PKM2 is related to cell proliferation.22 PDHα catalyses the production of acetyl-CoA from pyruvate, which enters the TCA cycle and mitochondrial respiratory chain to produce energy; PDK1 inhibits PDHα activity and hinders participation of mitochondrial pyruvate in the TCA cycle;23,24 PYC2 mediates carboxylation of pyruvate to form oxaloacetate by biotin-dependent catalysis; subsequently, oxaloacetate enters the TCA cycle or is used for synthesis of biomacromolecules. The PYC2 overexpression strategy has been applied to several industrially relevant mammalian cells and has been demonstrated to be beneficial for nutrient utilization or growth.25–27 Recent studies have shown that overexpression of PYC2 in CHO cells prolongs the lifespan and reduces the ratio of lactate to glucose by 25%.26 Furthermore, HEK-293 cells overexpressing PYC2 are characterized by highly efficient metabolism due to reduced glucose and glutamine consumption and by reduced accumulation of ammonia and lactate in the batch culture.27 The three enzymes, including PDHα, PDK1 and PYC2, are the key regulators of pyruvate entrance in the TCA cycle; LDHA catalyses the conversion of pyruvate to lactate. Inhibition of LDHA activity improved cell growth and respiration rate in CHO cells.28 MPC plays the key role in controlling the cell metabolism at the pyruvate branching sites. MPC transports pyruvate from the cytoplasm to the mitochondrial matrix thus correlating glycolysis with mitochondrial metabolism.29 The MPC1 subunit plays the major role in mammalian cells (no further in-depth studies are available due to inability to obtain stable transfected cell lines). Yeast cells can express three subunits, including MPC1, MPC2 and MPC3. MPC3 shares 71% amino acid sequence identity with MPC2 and induces the expression of MPC to transfer pyruvate into the mitochondria during cell growth using a carbon source. Aralar1 is the critical enzyme in the malate-aspartate NADH shuttle (MAS), which mainly regulates the transport of NADH in vitro and in vivo and the transport of pyruvate to the mitochondria. Glycolytic metabolic flux and pyruvate and lactate metabolism are influenced by the NADH shuttle pathway.19 The rate of glycolytic metabolism depends on the rate of NADH-dependent reduction of pyruvate to lactate and the NADH shuttle pathway to regenerate NAD+. The rate of pyruvate conversion to the mitochondrial TCA cycle is comparable to the rate of NADH transport to the mitochondria via the NADH shuttle pathway at a steady state. Consequently, an increase in the flux of NADH into the mitochondria will enhance the flux of pyruvate into mitochondria. Enhancing the activity of the NADH shuttle pathway can reduce the accumulation of lactate in the medium and promote reproduction of the virus.30
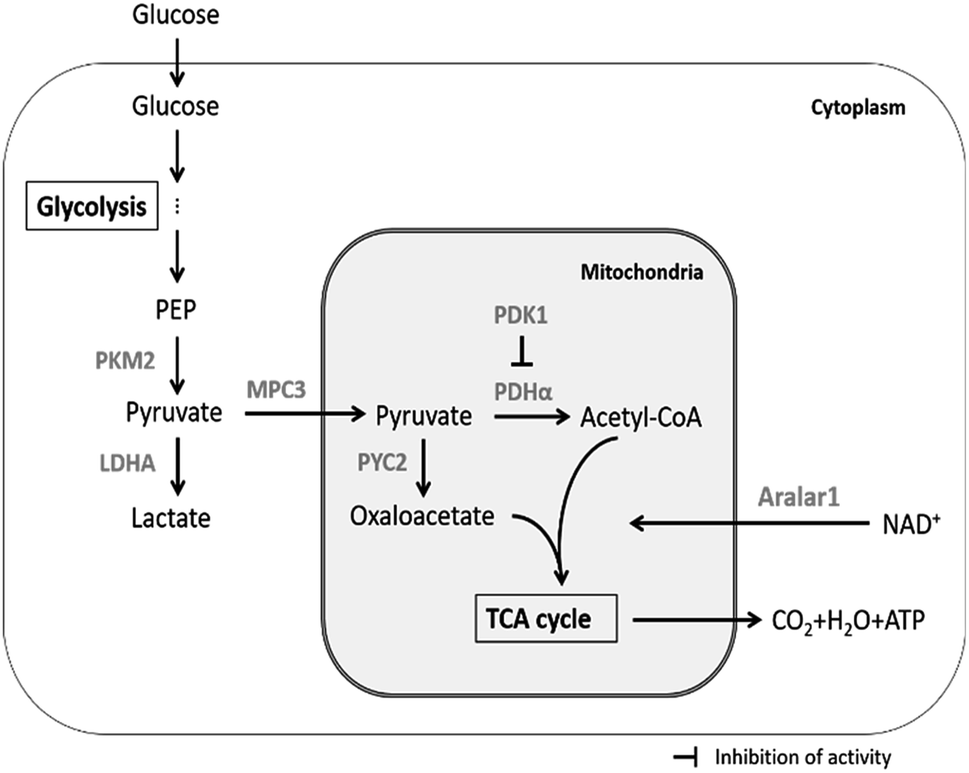 | ||
| Fig. 1 Regulation of pyruvate metabolism by enzymes and transporters in mammalian cells cultured in vitro. | ||
This study was focused on the pyruvate involvement in the central carbon metabolism. Initially, we systematically studied the genes that may influence pyruvate metabolism and comprehensively evaluated the effects of engineering of a single gene on the substance and energy metabolism and HAdV titre in the recombinant cell clones. Then, to further understand the limiting stages of pyruvate metabolism, improve the balance and enhance additional pyruvate flux into the TCA cycle to generate energy based on regulation of a single gene, multiple key regulatory genes were simultaneously engineered to explore whether polygene co-regulation has a coordinated stimulating effect and can improve the efficiency of the substance and energy metabolism and HAdV reproduction in HEK-293 cells. This study provides a new means to regulate pyruvate metabolism by polygenic metabolic engineering in mammalian cells cultured in vitro and a means for efficient HAdV production.
Experimental
Construction of recombinant monoclonal cell lines
| Primers | Sequence (5′–3′) | Restriction sites |
|---|---|---|
| aralar1-F | ata GCTAGC atggcggtcaaggtgcagacaac | NheI |
| aralar1-R | ata GCGGCCGC tcactgagtggctgccactg | NotI |
| pkm2-F | ccg GAATTC atgtcgaagccccatagt | EcoRI |
| pkm2-R | acgg GGTCGAC tcacggcacaggaacaacacg | SalI |
| pyc2-F | ccg CTCGAG atgagcagtagcaagaaattggc | XhoI |
| pyc2-R | ctag TCTAGA ttactttttttgggatgggggta | XbaI |
| pdhα-F | ccg GAATTC atgaggaagatgctcgccgccg | EcoRI |
| pdhα-R | tgcc GTCGAC ttaactgactgacttaaact | SalI |
| mpc3-F | aatgc CTCGAG atgtcagcatcagcttttaattttgcc | XhoI |
| mpc3-R | tgc TCTAGA tcagtgcgttattggcggattagtacc | XbaI |
HEK-293 cells were maintained in Dulbecco's modified Eagle medium/nutrient mixture F-12 (D/F 1![[thin space (1/6-em)]](https://www.rsc.org/images/entities/char_2009.gif) :1, Gibco, CA, USA) with 10% FBS (fetal bovine serum, BI). The cells were cultured in a 37 °C incubator with 5% CO2. Before transfection, HEK-293 cells at a concentration of 2.8 × 10⁵ cells per ml were seeded into 6-well plates for 24 h. The pCI-aralar1, pCI-pkm2, pCI-pyc2, pCI-pdhα, pCI-mpc3 and pCI plasmids were transfected into HEK-293 cells using Lipofectamine 3000 (Invitrogen, CA, USA). After transfection for 12 h, the medium was changed to D/F 1:1 with 10% FBS for 36 h. Then, the medium was replaced with a fresh medium containing 800 μg ml−1 G418 (Inalco, CA, USA). Medium was replaced every 96 h until a stable cell pool was established. Then, the clones were screened by limited dilution.
:1, Gibco, CA, USA) with 10% FBS (fetal bovine serum, BI). The cells were cultured in a 37 °C incubator with 5% CO2. Before transfection, HEK-293 cells at a concentration of 2.8 × 10⁵ cells per ml were seeded into 6-well plates for 24 h. The pCI-aralar1, pCI-pkm2, pCI-pyc2, pCI-pdhα, pCI-mpc3 and pCI plasmids were transfected into HEK-293 cells using Lipofectamine 3000 (Invitrogen, CA, USA). After transfection for 12 h, the medium was changed to D/F 1:1 with 10% FBS for 36 h. Then, the medium was replaced with a fresh medium containing 800 μg ml−1 G418 (Inalco, CA, USA). Medium was replaced every 96 h until a stable cell pool was established. Then, the clones were screened by limited dilution.
The LDHA and PDK1 knockdown cell clones have been established previously in the laboratory.
| Primers | Sequence (5′–3′) | Restriction sites |
|---|---|---|
| aralar1-F′ | tcgcggccgcttcgaa GGTACC atggcggtcaaggtgcaga | KpnI |
| aralar1-R′ | cagccggccagatct CTCGAG tcactgagtggctgccactg | XhoI |
| pkm2-F′ | actatagggagaccc AAGCTT atgtcgaagccccatagtga | HindIII |
| pkm2-R′ | tttttgttcggatcc TCTAGA tcacggcacaggaacaacac | XbaI |
A Seamless cloning Kit (Beyotime, Shanghai, China) was used to introduce aralar1 into the pBudCE4.1; pkm2 was then cloned into pBudCE4.1-aralar1. Then, the pBudCE4.1-aralar1-pkm2 and pBudCE4.1 plasmids were transfected into HEK-PYC2 and HEK-293 cells using Lipofectamine 3000, respectively. Zeocin (400 μg ml−1; Gibco, CA, USA) antibiotic was used for screening.
RT-qPCR and western blot analysis
Total RNA was extracted with TRIzol reagent as described in the literature.19 The RNA was reverse transcribed into the cDNA by a RevertAid first strand cDNA synthesis kit (Thermo, MA, USA) according to the manufacturer's instructions. Quantitative real-time PCR was performed in a PCR volume of 20 μl, including 80 ng cDNA, 10 μl 2× TB Green Premix Ex Taq II (TAKARA, Dalian, China) and 0.4 μM of each primer. The primers are shown in Table 3.| Primers | Sequence (5′–3′) |
|---|---|
| aralar1-RT-F | tagcactctagctggcacaa |
| aralar1-RT-R | gcgccctgaagcattatata |
| pkm2-RT-F | cttcattcagacccagcagc |
| pkm2-RT-R | cagatgatgccagtgttccg |
| pdhα-RT--F | cgctatggaatgggaacgtc |
| pdhα-RT-R | tctcggacgcacaggatatc |
| β-actin-F | catgagattggcatggcttt |
| β-actin-R | gtcaccttcaccgttccagt |
The real-time PCR protocol consisted of the following steps: step 1: 95 °C for 30 seconds; step 2: 95 °C for 5 seconds, 58 °C for 30 seconds, 40 cycles; step 3: melt curve 65 °C to 95 °C at the rate of 0.5 °C every 5 seconds. Data were analysed by the 2−ΔΔCt method; β-actin was used as a reference gene.
The cells (2.0 × 10⁶) were lysed by a RIPA lysis buffer (Beyotime, Shanghai, China) to obtain the cellular protein extracts. Proteins were electrophoresed through 12.5% (w/v) polyacrylamide gels. Proteins were subsequently transferred onto a polyvinylidene difluoride (PVDF) membrane. After blocking for 15 min in a blocking solution, protein expression was detected using anti-Aralar1 and anti-PKM2 antibodies (Proteintech, IL, USA). The membranes were washed with TBST, and the bands were detected with an HRP-labelled goat antibody (Proteintech, IL, USA). β-Actin was used as a reference protein.
Measurements of cell density and concentrations of metabolic substances
Control HEK-293 cells, single gene-overexpressing or knockdown cells or three gene co-overexpressing cells in the exponential growth phase were seeded into 6-well plates at 2.6 × 10⁵ cells per ml in 3 ml per well. Three replicate samples were withdrawn every 24 h; cells were trypsin-digested, resuspended in the medium, stained with trypan blue, and counted in a haemocytometer. The concentrations of metabolic substances, including glucose, lactate, glutamine and ammonia, in the cell culture supernatant were detected by a biochemical analyser (Roche, Basel, Switzerland).Measurements of the ATP production and O2 consumption rates
The ATP production and O2 consumption rates were measured with a mitochondrial respirator (Oroboros Instrument O2k, Austria). The cells of the control group, single gene-overexpressing or knockdown cells or three gene co-overexpressing cells were diluted to 1.0 × 10⁶ cells per ml; 2.2 ml fresh medium was added to an A or B chamber of O2k to calibrate the saturated oxygen concentration. Then, the medium was replaced with fresh medium containing the cells. The O2 consumption rate was calculated when the O2 flow curve was stable. Subsequently, an ATP synthase inhibitor oligomycin was added to inhibit the synthesis of ATP. When the O2 flow curve stabilized, the reduced oxygen consumption rate was calculated and assumed as the ATP production rate.Detection of reactive oxygen species
Cells were seeded into 24-well plates at 3.0 × 10⁵ cells per ml in 500 μl per well. After 48 h of incubation, 5 μl of 1 mM DCFH-DA was added to each well, and the samples were incubated for 30 min at 37 °C. After trypsinization, the cells were resuspended, washed twice with PBS, resuspended in PBS, and added to a black 96-well plate at 1.0 × 10⁵ cells per well in 100 μl per well. The green fluorescence intensity was measured by a microplate reader (Thermo, MA, USA) at an excitation wavelength of 485 nm and an emission wavelength of 525 nm.HAdV infection and HAdV titre detection
Control HEK-293 cells, single gene-overexpressing or knockdown cells or three gene co-overexpressing cells were seeded into 6-well plates at 4.0 × 10⁵ cells per ml in 2 ml per well. After 48 h of culture at 37 °C with 5% CO2, the medium was switched to DMEM with 10% FBS and 5% (v/v) HAdV was added. In 48 h, HAdV was harvested. HEK-293 cells were seeded into 96-well plates at 4.0 × 10⁵ cells per ml in 100 μl per well. In 24 h, the medium was replaced with DMEM containing 2% FBS for virus titre detection. The harvested virus was repeatedly frozen and thawed three times and diluted to prepared six dilutions from 10−4 to 10−9 using DMEM with 2% FBS. Every dilution of the virus was seeded into a 96-well plate in 100 μl per well. Blank controls were included. The plates were incubated at 37 °C with 5% CO2 for 10 days, and a cytopathic effect was observed. HAdV titre was represented by TCID50.Statistical analysis
All experiments were repeated at least three times. The data were analysed by Student's t test and are shown as the mean ± SD. p values less than 0.05 were considered to be significant.Results
Single gene regulation study based on the pyruvate metabolism node
The upstream pyruvate metabolism enzyme PKM2, the downstream PDHα and S. cerevisiae PYC2 enzymes, and the pyruvate transport-related regulatory proteins Aralar1 and S. cerevisiae MPC3 were overexpressed. The downstream LDHA and PDK1 enzymes were knocked down by the Crispr/Cas9 gene editing technology. Screened cell clones that did not have changes in cell growth and had the most significant regulation of HAdV production were labelled HEK-PKM2, HEK-PDHα, HEK-PYC2, HEK-MPC3, HEK-Aralar1, HEK-LDHA, and HEK-PDK1, respectively. HEK-293 cells transfected with the empty vector were used as a control.Expression verification of single gene modification in the recombinant cell clones
The mRNA levels in each recombinant cell clone were detected by RT-qPCR (Fig. 2A). The overexpression of the pkm2, pdhα and aralar1 genes increased the mRNA levels of the corresponding genes in the recombinant cells. The knockdown of the pdk1 and ldha genes reduced the expression levels of the corresponding proteins in the recombinant cells (Fig. 2B). In the case of the exogenous S. cerevisiae genes, pyc2 and mpc3, PCR results showed that the 3543 bp pyc2 and 441 bp mpc3 gene bands appeared in HEK-PYC2 and HEK-MPC3 cells; however, no corresponding bands were detected in the control cells. Thus, exogenous pyc2 and mpc3 genes were successfully expressed in HEK-293 cells (Fig. 2C).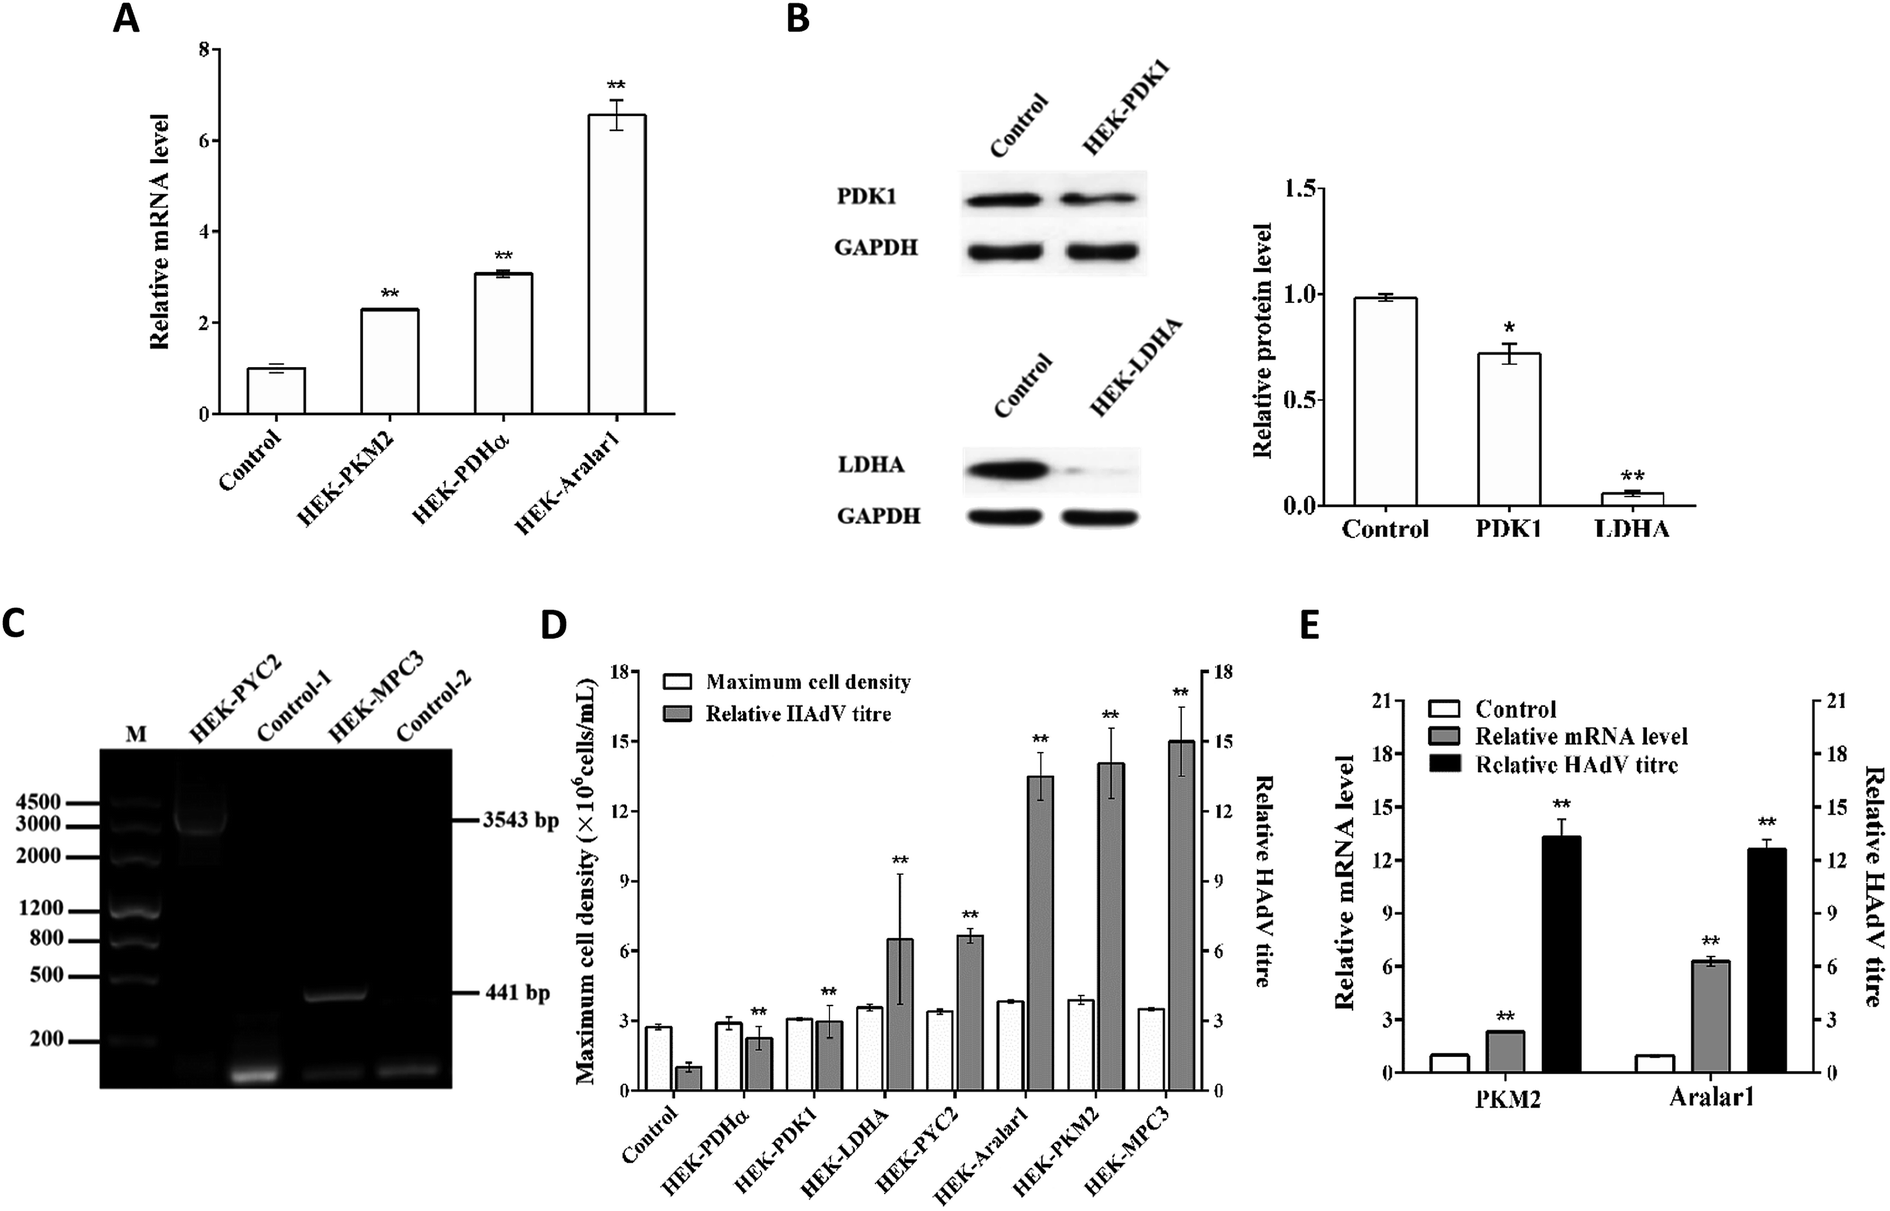 | ||
| Fig. 2 Effects of various types of single gene overexpression on HEK-293 cells. (A) mRNA levels of the endogenous pkm2, pdhα and aralar1 genes in HEK-PKM2, HEK-PDHα and HEK-Aralar1 overexpressing cell clones. (B) PDK1 and LDHA protein expression levels in HEK-PDK1 and HEK-LDHA knockdown cell clones. (C) Electrophoresis of mRNA PCR products of the exogenous pyc2 and mpc3 genes in the HEK-PYC2 and HEK-MPC3 cell clones. HEK-PYC2 and Control-1 primers were targeting PYC2. HEK-MPC3 and Control-2 primers were targeting MPC3. The pyc2 and mpc3 gene bands were 3543 bp and 441 bp, respectively. (D) Maximum cell density and relative HAdV titre of various single gene-overexpressing cell clones. (E) mRNA levels and relative HAdV titres of the pkm2 and aralar1 single gene-overexpressing cell clones. Values are expressed as the mean ± SD of three independent replicate experiments. Asterisks indicate a significant difference (**p < 0.01). | ||
Effects of single gene regulation on substance metabolism in HEK-293 cells
HEK-293 cells have a high demand for glucose and glutamine during growth; the cells release lactate and ammonia into the medium while consuming large amounts of glucose and glutamine resulting in lower glucose and glutamine utilization. The accumulated metabolic by-products, lactate and ammonia, have inhibitory effects on cell growth. The substance metabolism characteristics of single gene-regulated recombinant cell clones and control cells (Table 4) revealed that except for the pdhα gene, modest overexpression of the pyc2, pkm2, mpc3 and aralar1 genes and appropriate knockdown of the pdk1 and ldha genes substantially reduced the lactate to glucose yield (ΔLac/ΔGlc) and the ammonia to glutamine yield (ΔNH3/ΔGln) in HEK-293 cells.| Cells | ΔLac/ΔGlc | ΔNH3/ΔGln |
|---|---|---|
| a The lactate to glucose yield (ΔLac/ΔGlc) and ammonia to glutamine yield (ΔNH3/ΔGln) were calculated based on the glucose and glutamine consumption and the production of lactate and ammonia during the culture of the cells at the stationary phase. | ||
| Control | 0.617 | 1.512 |
| PYC2 | 0.544 | 1.172 |
| PDHα | 0.624 | 1.424 |
| PDK1 | 0.475 | 1.113 |
| PKM2 | 0.492 | 1.145 |
| LDHA | 0.448 | 1.069 |
| MPC3 | 0.320 | 0.511 |
| Aralar1 | 0.480 | 0.727 |
Effects of single gene regulation on energy metabolism in HEK-293 cells
Cellular respiration is the main pathway to produce ATP. The rate of oxygen consumption is a physiological and metabolic parameter directly related to the state of the cellular energy metabolism. Since virus proliferation is completely dependent on the energy of the host cells, the rate of oxygen consumption is closely related to virus reproduction. A mitochondrial respirator was used to detect the oxygen consumption and ATP production rates of single gene-regulated recombinant cell clones and control cells that were cultured for 48 h (Table 5). We found that except for the pkm2 and pdk1 genes, overexpression of the pyc2, mpc3, pdhα and aralar1 genes and knockdown of the ldha gene substantially increased the ATP production and oxygen consumption rates in HEK-293 cells. Monogene regulation increased the ATP/O2 ratio, indicating that the energy utilization of oxygen was enhanced and the energy metabolism state of HEK-293 cells was substantially improved.| Cells | ATP generation rate [pmol per s per million] | O2 consumption rate [pmol per s per million] | ATP/O2 ratio (%) |
|---|---|---|---|
| Control | 26.44 ± 1.40 | 39.50 ± 1.53 | 66.94 ± 1.01 |
| PYC2 | 37.74 ± 1.04 | 51.75 ± 0.55 | 72.93 ± 1.19 |
| PDHα | 40.35 ± 0.50 | 52.27 ± 0.02 | 77.20 ± 0.90 |
| PDK1 | 21.52 ± 1.11 | 33.20 ± 1.93 | 64.82 ± 0.45 |
| PKM2 | 29.63 ± 1.04 | 37.64 ± 0.38 | 78.72 ± 1.99 |
| LDHA | 32.07 ± 0.09 | 44.73 ± 0.04 | 71.70 ± 0.14 |
| MPC3 | 31.62 ± 2.09 | 43.69 ± 2.25 | 72.37 ± 1.11 |
| Aralar1 | 39.02 ± 2.69 | 52.64 ± 2.61 | 74.47 ± 1.86 |
Effects of single gene regulation on HAdV proliferation in HEK-293 cells
HAdV reproduction in single gene-regulated recombinant cells and control cells showed that appropriate overexpression of pyruvate metabolism-related genes can improve metabolic performance of the cells and promote HAdV reproduction in HEK-293 cells without affecting cell growth (Fig. 2D). The upstream regulatory enzyme PKM2, the downstream regulatory enzyme S. cerevisiae PYC2 and the pyruvate transport-related regulatory proteins Aralar1 and S. cerevisiae MPC3 had the most significant effect on HAdV reproduction. The mRNA level analysis of pkm2 and aralar1 single gene-overexpressing recombinant cells indicated that the optimal regulatory effect of virus reproduction corresponds to the appropriate gene over-expression (Fig. 2E). Furthermore, HEK-293 cells had apparent differences in the overexpression levels of the pkm2 and aralar1 genes; the overexpression level of the aralar1 gene was substantially higher than that of the pkm2 gene. Considering that Aralar1 protein is involved in the regulation of NADH transport, the malate-aspartate NADH shuttle protein Aralar1 was selected for subsequent polygene overexpression regulation study, rather than S. cerevisiae MPC3. Due to the complexity of overexpression of three genes, screening uncertainty and the fact that the S. cerevisiae PYC2 gene is exogenous for HEK-293 cells, we selected pyc2 gene-overexpressing stable monoclonal HEK-PYC2 cells as a starting cell line; this cell line had no detectable differences in cell growth, and HAdV reproduction was substantially improved in these cells compared with that in the control cells. Co-overexpression study of three genes was performed using CMV and EF-1α promoters of variable intensities to regulate the overexpression of the pkm2 and aralar1 genes, respectively.Expression verification of HEK-293 cells co-overexpressing the aralar1, pkm2 and pyc2 genes
Six strains of recombinant HEK-293 cells with co-overexpression of three genes with insignificant growth differences were selected by screening. The levels of mRNA of the aralar1 and pkm2 genes in the control cells and six recombinant cell clones were significantly increased (Fig. 3). The mRNA levels of the aralar1 gene in the PYC2-A-P-1, PYC2-A-P-2, PYC2-A-P-3, PYC2-A-P-4, PYC2-A-P-5 and PYC2-A-P-6 recombinant cell clones were increased 21-, 23-, 60-, 66-, 117- and 318-fold compared with that in the control cells, respectively (Fig. 3A). The mRNA levels of the pkm2 gene were increased 2.8-, 1.5-, 1.9-, 1.4-, 2.4-, and 2.6-fold compared with that in the control cells, respectively (Fig. 3B). The mRNA levels of the aralar1 gene in the PYC2-A-P-5 and PYC2-A-P-6 recombinant cell clones had the most significant increase; the mRNA levels in the PYC2-A-P-3 and PYC2-A-P-4 recombinant cell clones had a moderate increase, and the mRNA levels in the PYC2-A-P-1 and PYC2-A-P-2 recombinant cell clones had a lower increase. Considering that the overexpression level of the aralar1 gene was substantially higher than that of the pkm2 gene, the aralar1 gene was used as the selection criterion. Three recombinant cell clones, PYC2-A-P-1, PYC2-A-P-3 and PYC2-A-P-5, with low, moderate and high levels of aralar1 mRNA, respectively, were selected. Subsequent studies were performed by labelling the PYC2-A-P-L, PYC2-A-P-M, and PYC2-A-P-H clones. In the case of the exogenous S. cerevisiae gene pyc2, PCR analysis showed that the 3534 bp pyc2 gene band was not detected in the control HEK-293 cells, while the pyc2 gene band appeared in the three selected recombinant cell clones, indicating that all these clones overexpress the S. cerevisiae pyc2 gene (Fig. 3C). Western blot analysis revealed that the expression levels of the Aralar1 and PKM2 proteins in the three co-overexpression recombinant cell clones were substantially increased compared with those in the control cells (Fig. 3D and E).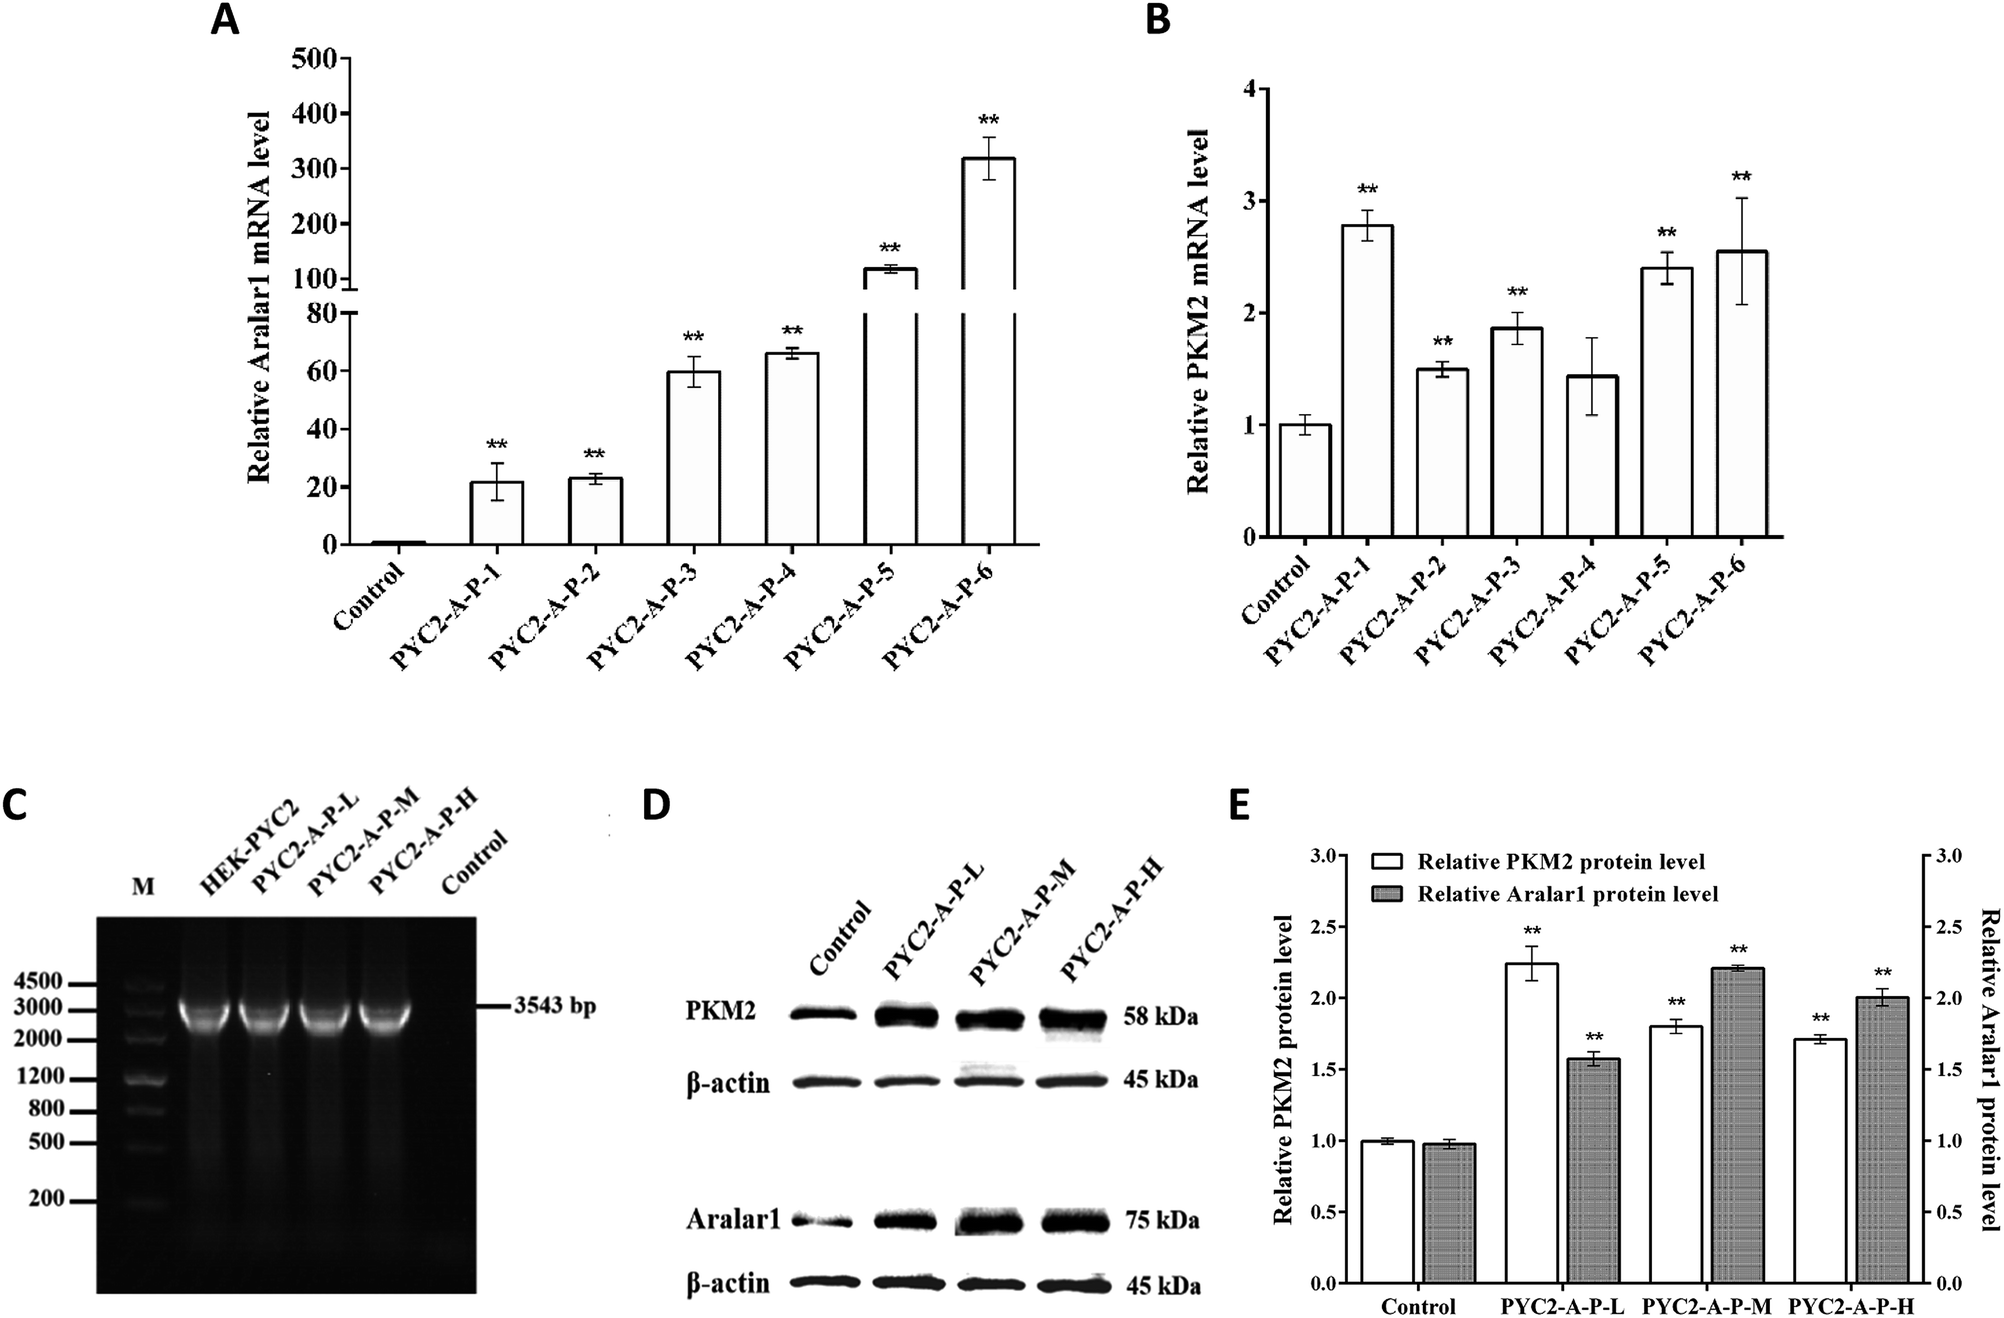 | ||
| Fig. 3 Expression of the aralar1, pkm2 and pyc2 genes and the corresponding proteins in various recombinant cell clones. (A) mRNA levels of the aralar1 gene and maximum cell density in six recombinant cell clones. (B) mRNA levels of the pkm2 gene in six recombinant cell clones. (C) Electrophoresis of mRNA of exogenous pyc2 gene in the three recombinant cell lines; the primers were targeting PYC2. The pyc2 gene band size was 3543 bp. (D) PKM2 and Aralar1 protein expression in the control cells and in three recombinant cell clones. PKM2, Aralar1 and β-actin correspond to the 58 kDa, 75 kDa and 45 kDa bands, respectively. (E) The relative protein levels of PKM2 and Aralar1 in the control cells and in three recombinant cell clones. Values are expressed as the mean ± SD of three independent replicate experiments. Asterisks indicate a significant difference (**p < 0.01). | ||
Effects of co-overexpression of the aralar1, pkm2 and pyc2 genes on cell growth
The data on cell growth are shown in Table 6. The μmax of three recombinant cell clones was improved; the μmax of the PYC2-A-P-L clone had the most pronounced increase by 21% compared with that in the control cells. The maximum cell density of PYC2-A-P-L was also significantly increased and was higher than that of the control cells by 21%, while the maximum cell density of the PYC2-A-P-M and PYC2-A-P-H clones was similar to that of the control cells. The PYC2-A-P-L clone co-overexpressing three genes had the most pronounced differences in regulation of cell growth. In combination with the data on the gene expression levels, the results suggest that the pkm2 gene had a more direct effect on cell growth and that there was a positive correlation between the gene overexpression levels and cell growth. However, there was no similar correlation in the case of the aralar1 gene, suggesting that the overexpression levels of the aralar1 gene may be too high and may thus increase the burden on the cells.| Cells | μmax (h−1) | Maximum cell density (×106 cells per ml) |
|---|---|---|
| a The maximum specific growth rate (μmax) is the number of cells that increase every hour during the exponential growth phase. Values are expressed as the mean ± SD of three independent replicate experiments. | ||
| Control | 0.0209 ± 0.0001 | 2.74 ± 0.11 |
| PYC2-A-P-L | 0.0252 ± 0.0000 | 3.31 ± 0.14 |
| PYC2-A-P-M | 0.0240 ± 0.0002 | 2.63 ± 0.30 |
| PYC2-A-P-H | 0.0241 ± 0.0002 | 2.77 ± 0.16 |
Effects of the co-overexpression of the aralar1, pkm2 and pyc2 genes on substance metabolism
The concentrations of glucose, lactate, glutamine and ammonia in the supernatant of the recombinant cell clones and control cells were assayed (Table 7). The glucose consumption and lactate production of the PYC2-A-P-L clone were substantially reduced compared with that in the control cells. The ΔLac/ΔGlc was reduced by 26% and the glutamine consumption was significantly increased. However, the ΔNH3/ΔGln was reduced by 27%. The ΔLac/ΔGlc and ΔNH3/ΔGln ratios in the PYC2-A-P-M cells were slightly decreased, while the ΔLac/ΔGlc and ΔNH3/ΔGln ratios in the PYC2-A-P-H cells were similar to those in the control cells. In combination with the data on the gene expression levels, the overexpression of the aralar1 gene had a direct effect on cellular substance metabolism; there was a positive correlation between the gene expression levels and the substance metabolism. In contrast, the PYC2-A-P-L cells had substantially reduced production of metabolic by-products, such as lactate and ammonia, to increase the efficiency of glucose and glutamine metabolism in HEK-293 cells.| Cells | ΔLac/ΔGlc | ΔNH3/ΔGln |
|---|---|---|
| Control | 0.609 | 1.404 |
| PYC2-A-P-L | 0.449 | 1.015 |
| PYC2-A-P-M | 0.560 | 1.147 |
| PYC2-A-P-H | 0.602 | 1.212 |
Effects of co-overexpression of the aralar1, pkm2 and pyc2 genes on energy metabolism
The ATP production and oxygen consumption rates were detected in the recombinant cell clones and control cells cultured for 48 h. The results revealed that the ATP production and specific oxygen consumption rates and the ATP/O2 ratio in the three recombinant cell clones were increased compared with those in the control cells. The PYC2-A-P-L cells had the highest increase versus the control cells; the ATP production rate and the ATP/O2 ratio were increased by 110% and 20% (Fig. 4A and B), respectively. However, single gene-regulated ATP production rate and ATP/O2 ratio were increased by a maximum of 52.6% and 17.6%, respectively. The PYC2-A-P-L cells that co-overexpressed the three genes had higher intensity of the energy metabolism and higher amount of oxygen was consumed by these cells to synthesize ATP. The co-overexpression of the three genes had a positive cooperative effect on energy metabolism. In combination with the results on the gene expression levels, the overexpression of the pkm2 gene had a direct effect on the rate of ATP production; there was a positive correlation between the gene expression levels and ATP production.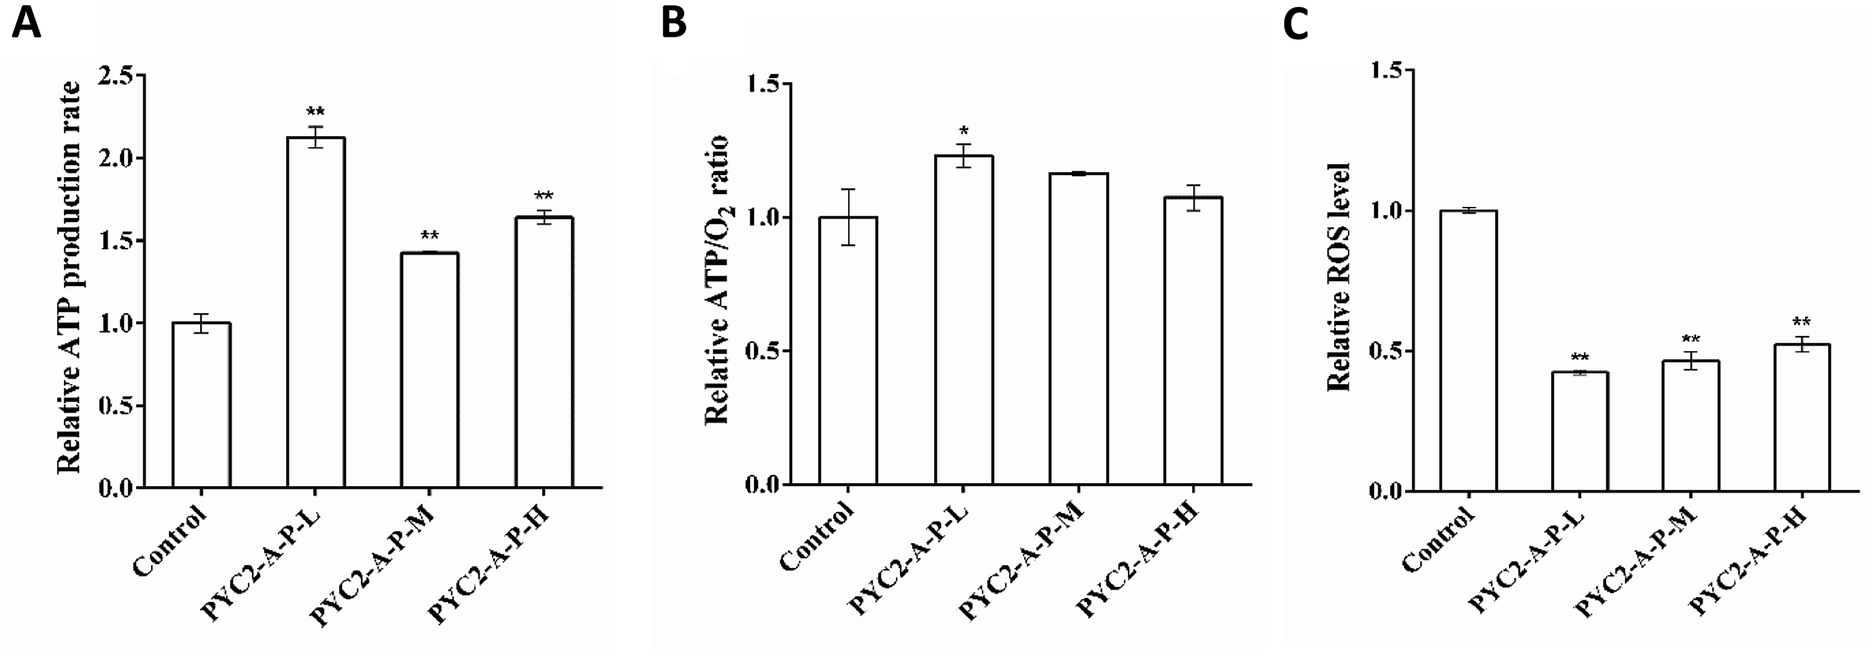 | ||
| Fig. 4 Effects of co-overexpression of three genes on the ATP production rate, ATP/O2 ratio and ROS. (A) The ATP production rate relative to that in the control cells. (B) The ATP/O2 ratio relative to that in the control cells. (C) Effects of co-overexpression of three genes on ROS levels. Values are expressed as the mean ± SD of three independent replicate experiments. Asterisks indicate significant differences (*p < 0.05; **p < 0.01). | ||
Reactive oxygen species (ROS) are the by-products of aerobic metabolism mainly produced in the mitochondrial respiration.31 Analysis of the intracellular ROS concentration revealed that the ROS levels in the three recombinant cell clones were decreased compared with that in the control cells (Fig. 4C); the PYC2-A-P-L cells showed the highest decrease in the ROS levels down to 60% of that detected in the control cells. The results indicate that co-overexpression of the three genes can efficiently reduce the production of by-products of the aerobic metabolism; thereby, the cells have more efficient energy metabolism.
Effects of co-overexpression of the aralar1, pkm2 and pyc2 genes on HAdV proliferation
The HAdV titres of the control cells and the three gene co-overexpressing recombinant cell clones showed that the HAdV titre of the PYC2-A-P-L cells was increased approximately 30-fold compared with that in the control cells; the PYC2-A-P-M cells had a 7-fold increase and the PYC2-A-P-H cells showed no improvement (Fig. 5). In combination with the previous data of the gene and protein expression levels, cell growth, substance metabolism and energy metabolism, appropriate aralar1 gene-expressing cell clone shows the highest μmax, maximum cell density, ΔLac/ΔGlc, ΔNH3/ΔGln, ATP production rate, and the lowest ROS level, improving the metabolic performance and adenovirus reproduction capacity in HEK-293 cells.32 Therefore, the higher the aralar1 gene expression level, the greater the extra burden on HEK-293 cells. This seriously limits the increase in the ability of the HAdV reproduction. The results indicate that the appropriate gene overexpression level can promote the reproductive capacity of HAdV with higher efficiency.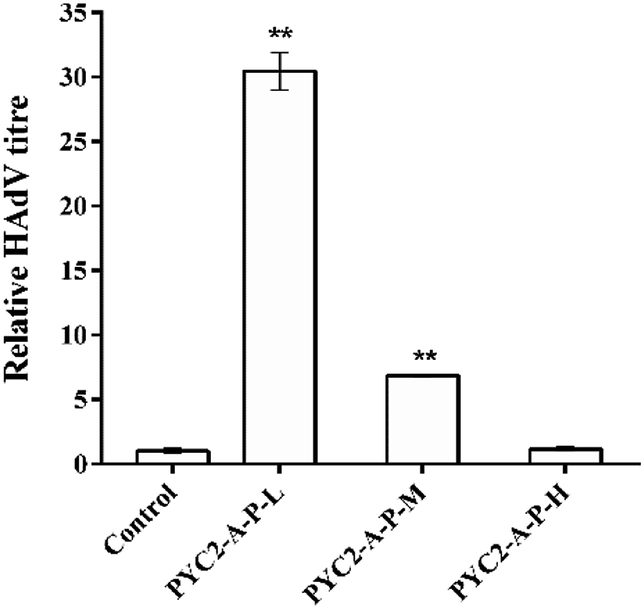 | ||
| Fig. 5 Effects of co-overexpression of the three genes on the HAdV titre. Values are expressed as the mean ± SD of three independent replicate experiments. Asterisks indicate significant differences (**p < 0.01). | ||
Therefore, the co-overexpression of the aralar1, pkm2 and pyc2 genes synergistically promoted the HAdV reproduction in HEK-293 cells. The PYC2-A-P-L recombinant cell clone had the most significant effect on HAdV reproduction and the titre was increased approximately 30-fold compared with that in the control cells; the single gene regulation data showed that the highest increase in the HAdV titre in HEK-293 cells was only approximately 15-fold. These results indicate that co-overexpression of the key regulatory genes based of the pyruvate metabolism node can improve the metabolic performance of HEK-293 cells and enhance the efficiency of the HAdV reproduction.
Discussion
Mammalian cells cultured in vitro maintain the substance synthesis and energy production through the central carbon metabolic pathway. The TCA cycle is an important pathway for synthesis of ATP. The initial substance of the TCA cycle is acetyl-CoA; pyruvate produced in the last step of the glycolytic pathway is the main precursor of acetyl-CoA. An increase in the flux of pyruvate into mitochondria can improve the efficiency of oxidative phosphorylation and the TCA cycle to synthesize ATP. When the flux of pyruvate to TCA cycle is reduced, pyruvate is converted to lactate and is eventually accumulated as a by-product of glycolysis that significantly influences cell growth and virus reproduction.33–36To improve the efficiency of pyruvate metabolism in the cells, this study used a systematic metabolic engineering of the upstream and downstream regulatory genes related to pyruvate metabolism. Initially, a series of recombinant monoclonal cell clones with overexpression of the pyc2, pdhα, pkm2, aralar1, and mpc3 genes and knockdown of the ldha and pdk1 genes were constructed. The data indicate that overexpression of the pyc2, pkm2, mpc3 and aralar1 genes and the knockdown of the pdk1 and ldha genes can reduce the ΔLac/ΔGlc and ΔNH3/ΔGln in HEK-293 cells to significantly regulate the metabolism of lactate and ammonia and improve the utilization efficiency of glucose and glutamine. Therefore, the metabolic performance of HEK-293 cells was improved to eventually promote efficient HAdV reproduction.
To understand whether the key regulatory genes involved in pyruvate metabolism have synergistic effects, we performed the polygene regulation study based on the results of the monogene regulation experiments. Three genes were co-overexpressed, including the upstream pkm2 gene and the downstream S. cerevisiae pyc2 and transporter aralar1 genes, which had the most significant effects on regulation of pyruvate metabolism. Six recombinant cell clones, including PYC2-A-P-1, PYC2-A-P-2, PYC2-A-P-3, PYC2-A-P-4, PYC2-A-P-5 and PYC2-A-P-6, were selected by screening and had variable expression levels of the aralar1, pkm2 and pyc2 genes. The mRNA levels of the aralar1 and pkm2 genes in six recombinant cell clones were assayed; three recombinant cell clones were selected, including PYC2-A-P-1, PYC2-A-P-3, and PYC2-A-P-5, with low, moderate and high mRNA levels of the aralar1 gene, respectively; the corresponding clones, including PYC2-A-P-L, PYC2-A-P-M, and PYC2-A-P-H, respectively, were used in the subsequent experiments.
The mRNA levels of the aralar1, pkm2 and pyc2 genes were assayed in three selected recombinant cell clones. The mRNA levels of the pkm2 gene were similar to that observed in the case of single gene overexpression under CMV promoter versus the levels in the control cells (Fig. 1A). However, the mRNA levels of the aralar1 gene were significantly different and substantially higher than that detected in the case of the single gene overexpression (Fig. 1A). Since the dual promoter expression vector was used for co-overexpression of three genes, the EF-1α promoter was used to drive the aralar1 gene expression. The CMV promoter was used for single aralar1 gene overexpression. Studies have shown that EF-1α promoter can significantly increase the expression level of a target gene compared with that achieved in the case of the CMV promoter,37 and differences in promoter strength result in different gene overexpression levels.
The improvement in the μmax and maximum cell density of the PYC2-A-P-L cell clones were the most pronounced out of three recombinant cell clones. The μmax of the other two recombinant cell clones were increased; however, the maximum cell density did not change. The mRNA levels of the aralar1 gene in the PYC2-A-P-L cell clones were increased only 21-fold, while those in the PYC2-A-P-M and PYC2-A-P-H clones were increased 60-fold and 117-fold, respectively. Apparently, excessive gene expression may impose an additional burden on the cells thus limiting cell growth. The PYC2-A-P-L recombinant clones with moderate co-overexpression of three genes had the most pronounced effect on the growth of HEK-293 cells.
Previous studies have shown that enhancing the activity of the Aralar1 protein in the NADH shuttle pathway can reduce the production of lactate or increase the consumption of lactate resulting in a decrease in the accumulation of lactate in the medium.30 Overexpression of S. cerevisiae PYC2 in BHK-21 cells resulted in a 2-fold increase in glucose consumption rate and product yield. Similar results were obtained in this study.38 The ΔLac/ΔGlc and ΔNH3/ΔGln ratios in the PYC2-A-P-L cells were reduced by 26% and 27%, respectively, thus reducing the accumulation of lactate and ammonia and enhancing the utilization efficiency of glucose and glutamine. Since the rate of glutamine consumption is related to the activity of the TCA cycle,39 the rate of glutamine consumption in the polygene-overexpressing cells is increased, indirectly indicating that the TCA cycle activity in HEK-293 cells is enhanced and higher amounts of pyruvate are transferred into the mitochondria for oxidative phosphorylation. In the single gene regulation study, overexpression of MPC3 significantly reduced the ΔLac/ΔGlc and ΔNH3/ΔGln ratios by 48.1% and 66.2%, respectively. Moreover, substantial lactate and ammonia consumption occurred after 3 to 4 days of cell culture. It is possible that the mpc3 gene, which regulates the pyruvate transport, may have an additional regulatory effect on the transport of cytoplasmic lactate to mitochondria for recycling. The specific regulatory mechanism remains to be studied.
The ROS level was decreased by 60% in the recombinant PYC2-A-P-L cells, suggesting that the cells respond to oxidative stress and that their oxidative balance is improved. This decrease confirms the conclusion that appropriate co-overexpression of the aralar1 gene can regulate cellular oxidative stress and provide a good growth environment for the cells.40 Mohanty proposed that reduction in glucose consumption can reduce intracellular ROS level.41 A decrease in the ROS levels in three recombinant cell clones may be related to an increase in the efficiency of glucose metabolism and a reduction in glucose consumption (Table 7). Since the energy production of the cells is correlated with oxidative stress,42 a decrease in ROS levels indicates that additional pyruvate enters the TCA cycle to generate energy.
An increase in the flux of pyruvate into the mitochondria increases the efficiency of oxidative phosphorylation and the TCA cycle to synthesize ATP.43 The ATP production rate and the ATP/O2 ratio of the recombinant PYC2-A-P-L cells were increased by 110% and 20%, respectively. Compared with single gene modification, the higher proportion of oxygen is consumed by HEK-293 cells to synthesize ATP. The pyruvate metabolism becomes more balanced, and the energy metabolism of the cells is improved ultimately improving the HAdV reproduction. The HAdV titre was increased by approximately 30 times compared with that in the control cells; this value is substantially higher than the maximum virus titre in the case of the single gene regulation.
Conclusion
We have studied the effects of the monogene and polygene modifications of pyruvate metabolism on cell growth, substance and energy metabolism, and HAdV reproduction; the results indicate that moderate regulation of multiple key genes of pyruvate metabolism had a positive cooperative effect on the substance and energy metabolism and HAdV reproduction in HEK-293 cells. The overexpression significantly reduced the formation of lactate and ammonia and increased the amount of oxygen in the cells that was used to synthesize ATP. Consequently, the pyruvate metabolism became more balanced, and the substance and energy metabolism became more efficient, thereby ultimately improving HAdV proliferation. This study provides a method for the systematic metabolic engineering of pyruvate metabolism and the polygene regulation in the animal cells cultured in vitro.Conflicts of interest
No conflict of interest.Acknowledgements
This work was supported by grants from the Shanghai Zhangjiang National Innovation Demonstration Zone Key projects of Special Development Funds (201310-FX-B2-002) and the Chinese National Programs for High Technology Research and Development (2015AA020801).References
- F. Jönsson and F. Kreppel, Virus Genes, 2017, 53, 692–699 CrossRef.
- C. Caravokyri, C. R. Pringle and K. N. Leppard, J. Gen. Virol., 1993, 74, 2819–2824 CrossRef CAS PubMed.
- M. O. Lasaro and H. C. Ertl, Mol. Ther., 2009, 17, 1333–1339 CrossRef CAS.
- L. H. Haut and H. C. J. Ertl, J. Leukocyte Biol., 2009, 86, 779 CrossRef CAS.
- A. V. S. Hill, A. Reyes-Sandoval, G. O'Hara, K. Ewer, A. Lawrie, A. Goodman, A. Nicosia, A. Folgori, S. Colloca and R. Cortese, Hum. Vaccines, 2010, 6, 78–83 CrossRef CAS.
- H. Mcshane and A. Hill, Microbes Infect., 2005, 7, 962–967 CrossRef CAS.
- A. Kamen and O. Henry, J. Gene Med., 2004, 6(1), S184–S192 CrossRef CAS.
- D. Sharon and A. Kamen, Biotechnol. Bioeng., 2018, 115, 25–40 CrossRef CAS.
- N. Wu, H. Zhang, F. Deng, R. Li, W. Zhang, X. Chen, S. Wen, N. Wang, J. Zhang, L. Yin, Z. Liao, Z. Zhang, Q. Zhang, Z. Yan, W. Liu, D. Wu, J. Ye, Y. Deng, K. Yang, H. H. Luu, R. C. Haydon and T. C. He, Gene Ther., 2014, 21, 629–637 CrossRef CAS.
- O. Henry, M. Perrier and A. Kamen, Metab. Eng., 2005, 7, 467–476 CrossRef CAS.
- L. Liste-Calleja, M. Lecina, J. Lopez-Repullo, J. Albiol, C. Sola and J. J. Cairo, Appl. Microbiol. Biotechnol., 2015, 99, 9951–9960 CrossRef CAS.
- O. Henry, M. Jolicoeur and A. Kamen, Bioprocess Biosyst. Eng., 2011, 34, 263–273 CrossRef CAS.
- A. F. Rodrigues, M. J. Carrondo, P. M. Alves and A. S. Coroadinha, Trends Biotechnol., 2014, 32, 602–607 CrossRef CAS.
- J. Lin, X. Yi and Y. Zhuang, RSC Adv., 2019, 9, 27369–27377 RSC.
- J. Neermann and R. Wagner, J. Cell. Physiol., 1996, 166, 152–169 CrossRef CAS.
- G. Kroemer and J. Pouyssegur, Cancer Cell, 2008, 13, 472–482 CrossRef CAS.
- D. Petch and M. Butler, J. Cell. Physiol., 1994, 161, 71–76 CrossRef CAS.
- F. Monteiro, V. Bernal and P. M. Alves, Biotechnol. Bioeng., 2017, 114, 674–684 CrossRef CAS.
- Z. Xia, X. Yi and Y. Zhuang, RSC Adv., 2016, 6, 61268–61277 RSC.
- N. H. Jeoung, C. R. Harris and R. A. Harris, Rev. Endocr. Metab. Disord., 2014, 15, 99–110 CrossRef CAS.
- J. C. Alves-Filho and E. M. Palsson-McDermott, Front. Immunol., 2016, 7, 145 CrossRef.
- S. Y. Lunt, V. Muralidhar, A. M. Hosios, W. J. Israelsen, D. Y. Gui, L. Newhouse, M. Ogrodzinski, V. Hecht, K. Xu, P. N. Acevedo, D. P. Hollern, G. Bellinger, T. L. Dayton, S. Christen, I. Elia, A. T. Dinh, G. Stephanopoulos, S. R. Manalis, M. B. Yaffe, E. R. Andrechek, S. M. Fendt and M. G. Vander Heiden, Mol. Cell, 2015, 57, 95–107 CrossRef CAS.
- N. H. Jeoung, Diabetes Metab. J., 2015, 39, 188–197 CrossRef.
- M. S. Patel, N. S. Nemeria, W. Furey and F. Jordan, J. Biol. Chem., 2014, 289, 16615–16623 CrossRef CAS.
- E. Karengera, A. Robotham, J. Kelly, Y. Durocher, G. D. Crescenzo and O. Henry, J. Biotechnol., 2016, 242, 73–82 CrossRef PubMed.
- S. K. Gupta, A. Sharma, H. Kushwaha and P. Shukla, Front. Pharmacol., 2017, 8, 463 CrossRef.
- C. Vallee, Y. Durocher and O. Henry, J. Biotechnol., 2014, 169, 63–70 CrossRef CAS.
- D. W. Jeong, I. T. Cho, T. S. Kim, G. W. Bae, I. H. Kim and I. Y. Kim, Mol. Cell. Biochem., 2006, 284, 1–8 CrossRef CAS.
- D. K. Bricker, E. B. Taylor, J. C. Schell, O. Thomas, B. Audrey, C. Yu-Chan, J. E. Cox, C. M. Cardon, J. G. Van Vranken and D. Noah, Science, 2012, 337, 96–100 CrossRef CAS.
- B. Rubi, A. del Arco, C. Bartley, J. Satrustegui and P. Maechler, J. Biol. Chem., 2004, 279, 55659–55666 CrossRef CAS.
- H. Zhao, J. Li, B. Han, X. Li and J. Chen, J. Ind. Microbiol. Biotechnol., 2014, 41, 869–878 CrossRef CAS.
- E. Petiot, M. Cuperlovic-Culf, C. F. Shen and A. Kamen, Vaccine, 2015, 33, 5974–5981 CrossRef CAS PubMed.
- A. A. F. Desalles, H. A. Kontos, D. P. Becker, M. S. Yang, J. D. Ward, R. Moulton, H. D. Gruemer, H. Lutz, A. L. Maset and L. Jenkins, Neurosurgery, 1986, 65, 615 CAS.
- S. Inao, A. Marmarou, G. D. Clarke, B. J. Andersen, P. P. Fatouros and H. F. Young, J. Neurosurg., 1988, 69, 736–744 CAS.
- B. A. F. Mizock and L. Jay, Crit. Care Med., 1992, 20, 80 CrossRef CAS.
- S. Magnoni, L. Ghisoni, M. Locatelli, M. Caimi, A. Colombo, V. Valeriani and N. Stocchetti, J. Neurosurg., 2003, 98, 952–958 Search PubMed.
- X. Wang, Z. Xu, Z. Tian, X. Zhang, D. Xu, Q. Li, J. Zhang and T. Wang, J. Cell. Mol. Med., 2017, 21, 3044–3054 CrossRef CAS PubMed.
- N. Irani, A. J. Beccaria and R. Wagner, J. Biotechnol., 2002, 93, 269–282 CrossRef CAS.
- R. O. Erich Roth, N. Manhart, R. Exner, B. Wessner, E. Strasser and A. Spittler, Nutrition, 2002, 18, 217 CrossRef.
- A. Dimitrios, P. George, J. M. Asara, M. B. Boxer, J. Jian-Kang, S. Min, B. Gary, A. T. Sasaki, J. W. Locasale and D. S. Auld, Science, 2011, 334, 1278–1283 CrossRef PubMed.
- B. C. Mulukutla, S. Khan, A. Lange and W. S. Hu, Trends Biotechnol., 2010, 28, 476–484 CrossRef CAS.
- F. Monteiro, V. Bernal, X. Saelens, A. B. Lozano, C. Bernal, A. Sevilla, M. J. Carrondo and P. M. Alves, Biotechnol. Bioeng., 2014, 111, 816–828 CrossRef CAS.
- J. Stafkova, J. Mach, M. Biran, Z. Verner, F. Bringaud and J. Tachezy, Mol. Microbiol., 2016, 100, 442–456 CrossRef CAS.
| This journal is © The Royal Society of Chemistry 2019 |