
 Open Access Article
 This Open Access Article is licensed under a Creative Commons Attribution-Non Commercial 3.0 Unported Licence
Birnessite-coated sand filled vertical flow constructed wetlands improved nutrients removal in a cold climate†
Ning Zhanga,
Yixiao Yanga,
Lihua Huang c,
Huijun Xie*a and
Zhen Hub
c,
Huijun Xie*a and
Zhen Hub
aEnvironment Research Institute, Shandong University, Jinan 250100, China. E-mail: xiehuij@sdu.edu.cn; Fax: +86-531-8836978; Tel: +86-531-88361185
bShandong Key Laboratory of Water Pollution Control and Resource Reuse, School of Environmental Science and Engineering, Shandong University, Jinan, Shandong 250100, China
cSchool of Resources and Environment, Linyi University, Linyi, Shandong 276005, China
First published on 4th November 2019
Abstract
At low temperature, plants wither and microbial activities decrease, leading to a decline in the pollutant-treatment performance of constructed wetlands (CWs). In this study, vertical flow CWs (VFCWs) with birnessite (Mn oxides)-coated sand (Mn-CWs) were developed to investigate the pollutant removal performance and mechanism in a cold climate. The results showed that the average removal efficiencies for NH4–N, NO3–N, TN, and TP were 73.81%, 90.66%, 82.44%, and 57.89% in Mn-CWs, respectively, while the average removal efficiencies for NH4–N, NO3–N, TN, and TP were 29.07%, 90.40%, 62.80%, and 26.32% in the control, respectively. Mn-CWs enhanced microbial denitrification and matrix storage, as well as inhibited P release in Mn-CWs at low temperature. According to GC-MS analysis of the organic compounds, the Mn-CWs matrix contained much more short-chain volatile organic compounds, such as carboxylic acid derivatives, while the control matrix had more ethyl acetate. The absolute quantities of bacterial 16S rRNA, amoA, narG, nirS, and nosZ were significantly higher than the control at 20 cm height from the bottom (p > 0.05). Illumina high-throughput sequencing analysis revealed that the relative abundances of nitrifying and denitrifying bacteria were both higher in Mn-CWs than that of the control. CWs filled with birnessite-coated sand represent an innovative approach for improving nutrient removal performance in cold climates through chemical absorption and microbial transformation.
1. Introduction
Constructed wetlands (CWs) are engineered systems to simulate natural wetlands, which are capable of removing organic matter, nutrients, and other pollutants through plant absorption, supportive matrix storage, and an associated microbial mechanism.1,2 Compared with traditional wastewater treatment technologies, CWs are cost-effective, easy to operate, and environmental-friendly,3 and have been widely used as an advanced wastewater treatment process.4Wetland plants and microbes play the main role in nutrients removal, especially total nitrogen (TN) and total phosphate (TP) removal. It has reported that more than 50% of TN are removed by the microbial nitrification and denitrification process,5 while plant uptake accounts for up to 43%.6 Moreover, more than 50% of TP removal was attributed to plant uptake in one study.7 However, wetland plants and microbes are sensitive to the variation of seasonal temperature. Microbial activities decrease and plants wither in winter, thus causing fluctuations of the nutrients removal performance.8 Apart from plant and microbes, the support matrix is also a vital component, in which it not only removes nutrients through adsorption, but also provides support for the biota and influences their development in CWs. Unlike biotic processes, adsorption processes are less affected by climate change and may moderate the seasonal effects on the performance of CWs. However at present, the most popularly used support matrix of CWs, such as gravel and sand,9 typically have a small adsorptive capability and cannot sustain satisfactory pollution removal performance at low temperature, which largely hinder the application of CWs in warm or cold areas, such as northern regions of China.
Recent studies focused on improving the microbial activities to improve the performance of CWs in winter involved reducing the hydraulic loading,10 enriching the psychrotrophic bacteria,11 plant selection,8 carbon sources addition,12 and insulation.13 Although many studies have modified the support matrix with calcium (Ca),14 iron (Fe),15,16 aluminum (Al),17 and magnesium (Mg)18 to enhance nutrients removal in CWs, few studies have covered operation performance in the winter. CWs with light ceramsite as a matrix could enhance TN, NO3–N, and NH4–N removal performance.19 Matrices with reactive Fe and Al hydroxide or calcareous materials on their surfaces promote phosphate precipitation and the TP removal in CWs.20,21 However, most modifications of the support matrix to date have just been concentrated on either N or P removal, failing to obtain a simultaneous removal of both N and P. Manganese (Mn) oxides, as powerful oxidants with a high adsorptive capability, have been used as a modified support matrix to simultaneously remove N and P in CWs, and not only accomplished N transformations in the presence of specific microorganisms through a series of complex biochemical processes22 but could also adsorb P through forming a surface complex.23 Nonetheless, the performance of CWs with Mn oxides matrices at low temperature needs further study.
Consequently, this study applied birnessite-coated sand as a modified support matrix to develop a vertical flow CW (VFCW) system. The main objectives of this study were: (1) to ascertain whether the addition of birnessite-coated sand could enhance N and P removal in CWs at low temperature; (2) to investigate the nutrients removal mechanisms.
2. Materials and methods
2.1 Experimental setup
The study site was located in Jinan, China, with a temperate monsoon climate with temperatures ranging from −1 °C to 8 °C in winter (Fig. S1†). Birnessite-coated sand was artificially synthesized in a batch using a modified method (Text S1†) described by McKenzie (1981).24 A SEM image of the birnessite-coated sand is presented in Fig. S2.† The average Mn oxidation state in the birnessite-coated sand was 3.75.Six lab-scale VFCWs were constructed outdoors under a transparent shelter to eliminate the impact of rainfall. Each experimental CWs was 15 cm in diameter and 60 cm in height with a 10 cm gravel layer (Φ = 1–3 cm) at the bottom. Those CWs were divided into 2 groups: one group, named the control group, contained a 40 cm layer of washed river sand (Φ = 1–3 mm) at a height of 10–50 cm from the bottom, and another group, named the Mn-CWs group, constructed with a 20 cm layer of birnessite-coated sand with a diameter of 1–3 mm substituting for the washed river sand from 10–30 cm from the bottom.
To investigate the nutrient removal performance along the column within each CW, five outlets were set at different column heights of 10, 20, 30, 40, and 50 cm from the bottom to the top. Phragmites australis were selected for its powerful ability to purify wastewater, and the planting density was 6 plants per unit.
2.2 Operation of the lab-scale vertical flow constructed wetlands
All the CWs were fed with simulated sewage treatment plant level 1 B effluent,25 mainly containing sucrose, NH4Cl, CaNO3, CaCl2, KH2PO4, and KNO3. The characteristics of the influent water were as follows: pH 7.85 ± 0.27, TN 19.65 ± 0.65 mg L−1, NH4–N 7.98 ± 0.39 mg L−1, NO3–N 11.67 ± 0.97 mg L−1, TP 0.95 ± 0.07 mg L−1, and chemical oxygen demand (COD) 65.79 ± 7.35 mg L−1 (Table S1†). The hydraulic retention times were 3 days and the hydraulic loading rate was 20 cm d−1. All the CWs were operated for more than 1 year from September 2017 to September 2018. This study only selected the data in the winter covering three months during December 2017 and February 2018, when the influent water temperature during the experiment period was 5.50 ± 1.70 °C (Table S1†). An aquarium heater was adopted to avoid freezing when the temperature was below zero.262.3 Water sampling and analysis
The conventional water quality indicators of the effluent in the system were continuously monitored during the system operation. Water samples were taken from the inlet and outlet of the CWs device every 7 days. In addition, 10, 20, 30, 30, and 40 cm effluent from the bottom of the experimental CWs were regularly taken to analyze the water quality changes along the height. The water sample volume was 50 mL, and it was stored in a polyethylene plastic bottle at 4 °C. According to the standard methods, the water quality indexes (NH4–N, NO3–N, NO2–N, COD, and TP) were measured as soon as possible.2.4 Sampling and analysis of N and P contents in the matrix
On December 1, 2017, and February 28, 2018, matrix samples at different heights were taken without destroying the stability of the system. The sediment samples were dried at −60 °C for 36 h using a freeze dryer (Unicryo MC 2L Freeze Dryer, Germany), then ground and passed through 1.0 mm sieves. One part was mixed homogeneously and used to measure the matrix TN and TP, the other part was stored at −20 °C for other analysis. The mixed homogeneously matrix samples were wet-digested and analyzed for TN and TP using a 3-AA3 AutoAnalyzer (BRAN-LUEBBE, Inc., Germany). The contents of TN and TP in the matrix were the dry weight multiplied by the dry weight per unit.2.5 Identification of the carbon components in the matrix
A gas chromatographic system equipped with a mass spectrometer (GC-MS, GCMS-QP 2020, Shimadzu, Japan) was used to analyze the carbon components in the matrix samples at the height of 20 cm from the bottom in the control and Mn-CWs following the method described by Kang et al. (2018).27 The separation was carried out using an Rtx-5 MS column (Restek, 60 m × 0.25 mm inner diameter; film thickness, 0.25 μm), 30 m × 0.25 mm i.d., containing 5% phenyl-methylpolysiloxane with a thickness of 0.25 μm. Pure helium (99.995%) was used as the carrier gas at a flow rate of 2 mL min−1. The mass spectrometer conditions were as follows: EI mode, ion source temperature 230 °C, interface temperature 280 °C, and full scan mode. The injector and detector temperatures were maintained at 280 °C. The oven temperature was held at 40 °C for 5 min and increased to 160 °C at a rate of 6 °C min−1. Then, the oven was operated at 160 °C/6 min at a rate of 20 °C min−1 up to 230 °C. For chemical identification of the peaks, the mass of fragments was confirmed by searching in the MS spectral library (NIST11 library, http://www.nist.gov/srd/mslist.htm) with a match greater than 95%. The retention time index was applied to confirm the identification of the carbon components in the GC-MS analysis. The GC-MS analysis was carried out in the Shandong Environmental Protection Scientific Research and Design Institute. Besides, the relative contents of the identified organic compounds were calculated according to the peak area normalization method.2.6 Quantitative real-time PCR and pyrosequencing
Extraction of community DNA from the matrix samples of 20 and 50 cm heights of Mn-CWs and the control was performed using a MOBIO PowerSand DNA Isolation Kit (MoBio Laboratories, Inc., Carlsbad, CA, USA). DNA purity was measured using a Nanodrop ND-1000 UV-vis spectrophotometer (NanoDropTechnologies, Wilmington, DE, USA). Quantitative real-time PCR (qPCR) was performed to characterize the absolute abundance of bacterial 16S rRNA genes and nitrogen-related genes, including ammonia monooxygenase (amoA), nitrous oxide reductase (nosZ), nitrate reductase (narG), cytochrome cd1-containing nitrite reductase (nirS), and Cu-dependent nitrite reductase (nirK). Quantitative PCR was performed as described by Liu et al. (2017).28The extraction of DNA samples were sent to Beijing Baimax for DNA sequencing on a MiSeq machine using Illumina miseq Qualcomm sequencing technology. After obtaining the original data, all the sequences were classified by OTU with a similarity of 97%, and the indexes, including coverage, abundance, and diversity, were further analyzed, and the abundance of the bacteria was further divided. Differences between groups were analyzed using STAMP software (http://kiwi.cs.dal.ca/Software/STAMP). Sequencing service was performed using an Illumina MiSeq instrument supported by Yuanxu Biotechnology Co., Ltd (Shanghai, China). The sequences were deposited in the NCBI Sequence Read Archive under the accession numbers SRR10022680–SRR10022683.
2.7 Statistics
All the experimental data, including the mean and variance calculations, were calculated using Microsoft excel 2013 software. Intra-group and inter-group variability analyses of the data were used for the analysis of variance (ANOVA) in IBM SPSS Statistics 17.0 software. The significance level was p < 0.05. Data visualization was done using ORIGIN 9.0 software, and all word processing used Microsoft Word 2013 software.3. Results
3.1 Nitrogen removal performance
As shown in Fig. 1, there were little NO3–N concentration changes in the effluent, while it had a noticable effect on NH4–N and TN effluent with the temperature decreasing from 3 °C to 0 °C (Fig. S1†). The removal performances of NH4–N, NO3–N, and TN along the height of CWs are presented in Fig. 1d–f. In the Mn-CWs group, the NH4–N concentration was reduced from 8.0 mg L−1 in the influent to a minimum equal to 0.2 mg L−1 in the effluent, for an average removal efficiency of 73.81%, while the minimum in the effluent of the control was up to 5.0 mg L−1, with an average removal efficiency as low as 29.07% (Fig. 1a). As shown in Fig. 1d, NH4–N was removed faster in the 10–20 cm section in the Mn-CWs group compared to in the control group as its concentration decreased by 2.0 mg L−1 and 0.7 mg L−1 in the Mn-CWs and control groups, respectively. In cold winter, the average removal efficiencies of NO3–N in Mn-CWs and the control reached 90.66% and 90.40% (Fig. 1b), respectively. In CWs, the 0–10 cm section contributed largely to the NO3–N removal owing to denitrification, as the NO3–N concentration decreased from 11.7 mg L−1 to 0.7 mg L−1 and 1 mg L−1 in the control and Mn-CWs, respectively (Fig. 1e). The extra NO3–N derived from the oxidation of NH4–N by the birnessite-coated sand might account for its little impact on NO3–N removal in Mn-CWs. In the section taken 10–20 cm from the bottom, the values of decreased NO3–N concentration were similar between the Mn-CWs and control (Fig. 1e). As for TN removal, the birnessite-coated sand significantly improved the TN removal in Mn-CWs with low effluent NH4–N concentrations, whose average removal efficiency was 82.44%, exceeding that of the control by nearly 20% (Fig. 1c). Besides, the reduced TN concentration was 2.2 mg L−1 in the 10–20 cm section in the Mn-CWs, while it was only 0.8 mg L−1 in the control (Fig. 1f).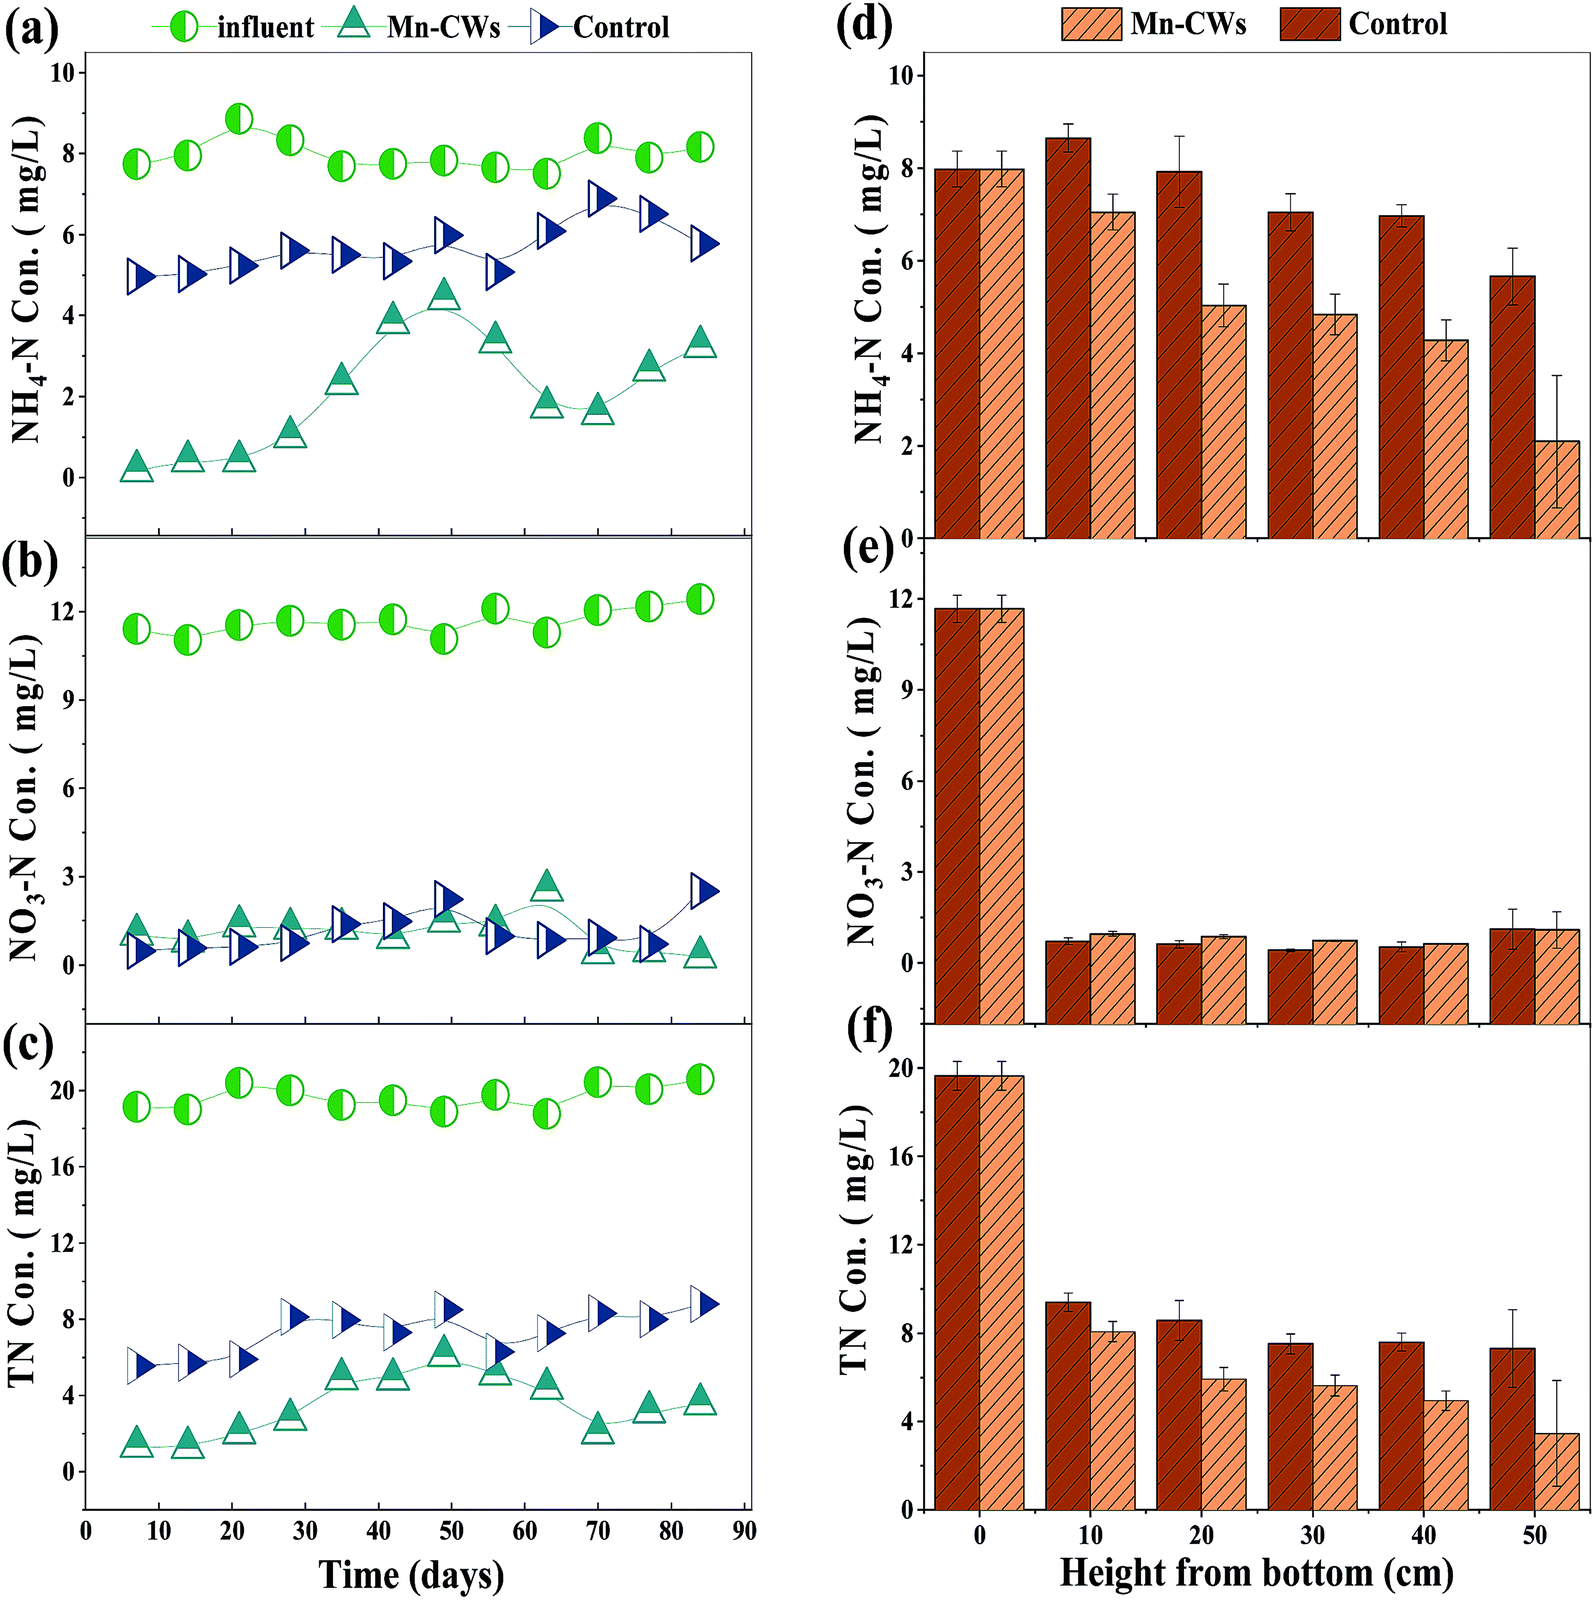 | ||
| Fig. 1 Influent and effluent concentrations of NH4–N (a), NO3–N (b), and TN (c), and concentrations of NH4–N (d), NO3–N (e), and TN (f) along the heights in the Mn-CWs and control throughout the experiment period. | ||
3.2 Total phosphate removal performance
It was obvious that the birnessite-coated sand significantly enhanced the TP removal in Mn-CWs compared to the control (p < 0.05). In the control, the effluent TP concentrations sharply fluctuated and even exceeded the influent concentration of 1 mg L−1 (Fig. 2a). The average removal efficiency of TP in Mn-CWs was 57.89%, with the minimum concentration of 0.1 mg L−1. As shown in Fig. 2b, the TP removal largely occurred in the 10–20 cm section of Mn-CWs, during which the TP concentration declined by almost 0.5 mg L−1.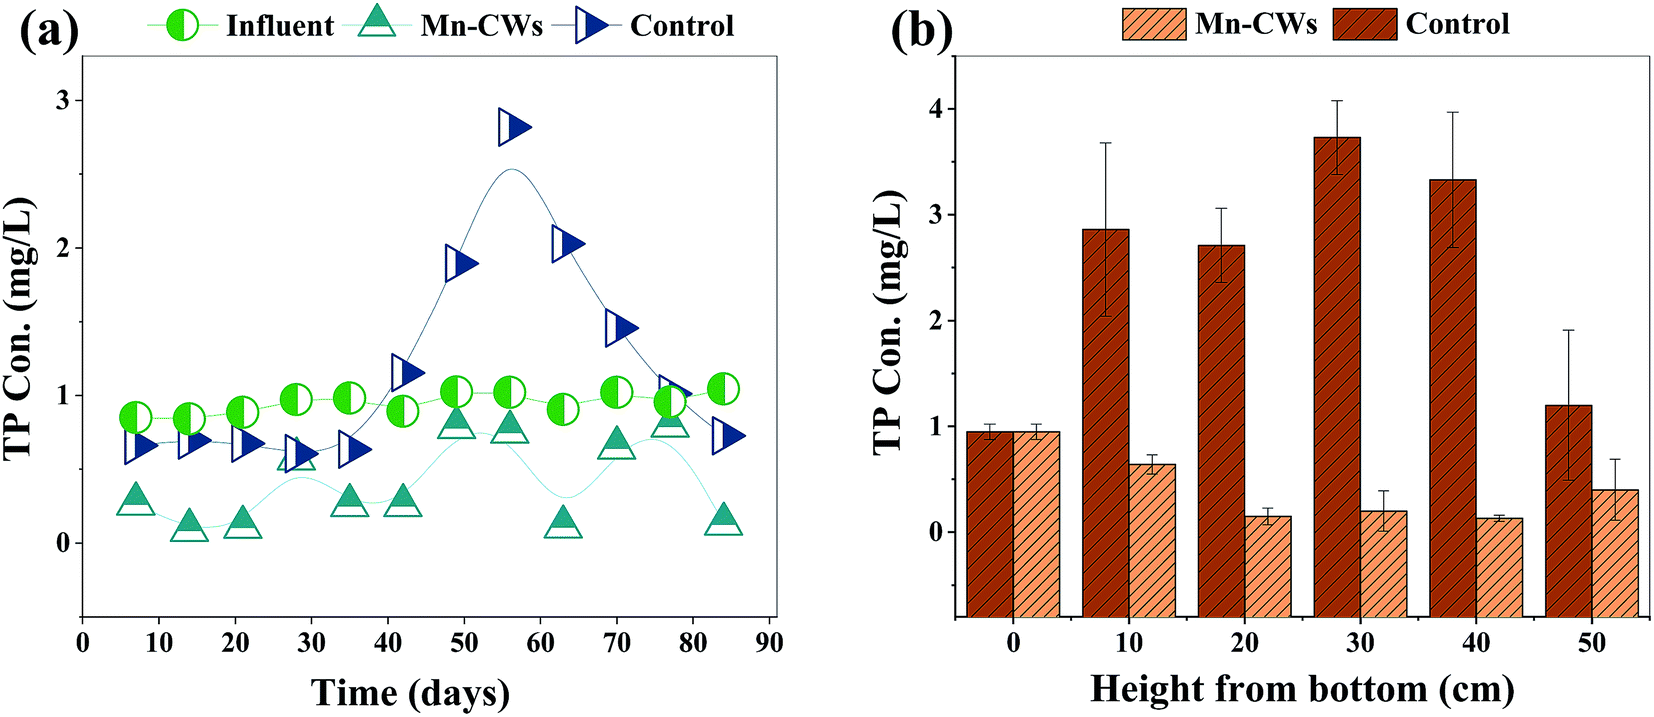 | ||
| Fig. 2 Influent and effluent concentrations of TP (a) and concentrations of TP (b) along the heights in the Mn-CWs and control throughout the experiment period. | ||
3.3 Nutrient mass balance in wetland systems
To quantify the contributions of different N and P removal pathways in each CW system throughout the experiment, the mass balance method was used based on the assumption that the TN and TP inputs were equal to the TN and TP outputs. The TN input into CWs was 3930 mg per m2 per day (Table 1). Among the different N removal pathways, the matrix storage accounted for most of the TN input, with the proportions of 40.02% and 36.65% in the Mn-CWs and control, respectively (Fig. 3). Other losses (mainly microbial nitrification and denitrification) accounted for 42.42% and 26.15% of the TN input in the Mn-CWs and control, respectively.| Parameter | Treatment systems | Input load mg per m2 per day | Output load g per m2 per day | ||
|---|---|---|---|---|---|
| Influent | Effluent | Media storage | Other lossa | ||
| a Other loss involve denitrification for N loss and microbiota uptake, dead leaves loss for P loss. | |||||
| TN | Mn-CWs | 3930.00 | 690.00 | 1572.62 | 1667.38 |
| Control | 1462.00 | 1440.48 | 1027.53 | ||
| TP | Mn-CWs | 190.00 | 80.00 | 56.61 | 53.39 |
| Control | 240.00 | −64.32 | 14.32 | ||
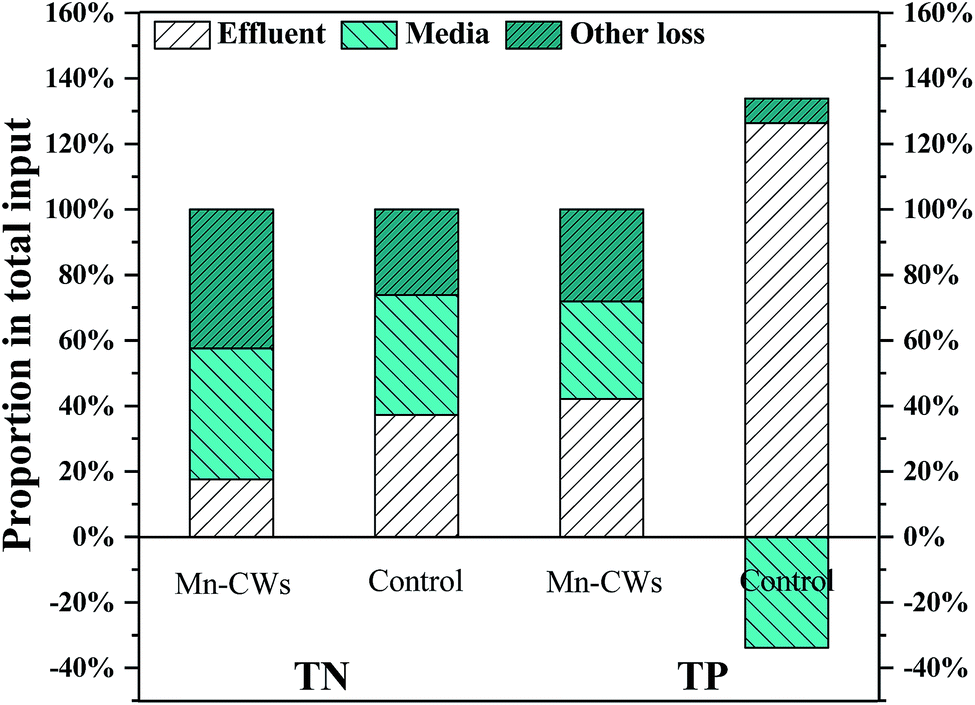 | ||
| Fig. 3 Proportions of TN and TP removed through different pathways in CWs with and without birnessite-coated sand (Mn-CWs and control) throughout the experiment period. | ||
The TP input into the CWs was 190 mg per m2 per day (Table 1). In the control, the TP output through the effluent exceeded the input owing to the desorption of P from the support matrix, which indicated an ineffective treatment of P from synthetic wastewater in the control group. TP removal by other processes accounted for 7.53% of the TP input in the control. In the Mn-CWs, most of the TP was removed by matrix storage of 29.79%. Other losses such as microbial transformations removed 28.10% of the influent TP.
3.4 Identification of organic compounds in wetland systems
To investigate the influence of the birnessite-coated sand in carbon metabolism in CWs, the volatile organic compounds (VOCs) products in each CW system at the end of the experiment were analyzed by GC-MS technique. As shown in Table 2 and Fig. S4,† a total of 12 compounds were identified ranging from C3 to C15, which mainly included long-chain alkanes and aromatic compounds as well as low molecule weight esters. After the experiment, long-chain alkanes, including dodecane and tridecane, were the most abundant and accounted for 49.64% and 58.89% of the total products content in the Mn-CWs and control, respectively. Furthermore, the identified compound with the longest chain was pentadecane, which was only detected in the control. Some short-chain alkanes, including n-hexane and heptane, coupled with toluene and o-xylene were only detected in the Mn-CWs.| No. | Component | Systems | Relative content (%) | No. | Component | Systems | Relative content (%) |
|---|---|---|---|---|---|---|---|
| 1 | Acetoxy-2-methoxyethane | Mn-CWs | — | 7 | o-Xylene | Mn-CWs | 3.93 |
| Control | 3.35 | Control | — | ||||
| 2 | Methyl acetate | Mn-CWs | 4.16 | 8 | Decane | Mn-CWs | 5.10 |
| Control | 0.87 | Control | — | ||||
| 3 | n-Hexane | Mn-CWs | 4.11 | 9 | Undecane | Mn-CWs | 13.53 |
| Control | — | Control | 3.32 | ||||
| 4 | Ethyl acetate | Mn-CWs | 15.44 | 10 | Dodecane | Mn-CWs | 27.69 |
| Control | 30.55 | Control | 22.73 | ||||
| 5 | Heptane | Mn-CWs | 2.74 | 11 | Tridecane | Mn-CWs | 21.95 |
| Control | — | Control | 36.16 | ||||
| 6 | Toluene | Mn-CWs | 1.35 | 12 | Pentadecane | Mn-CWs | — |
| Control | — | Control | 3.02 |
3.5 Microbial quantity of nitrogen-related genes and shift of the microbial community structure
The amount of bacterial 16S rRNA gene determined by qPCR is typically used to estimate the amount of intact bacterial cells and the removal efficiency of organics in a system. To investigate the microbial quantity of the nitrogen-related genes, the samples at 20 and 50 cm heights from the bottom were selected from the Mn-CWs and control for qPCR analysis, and named Mn-20, Mn-50, Control-20, and Control-50, respectively. The absolute abundance of bacterial 16S rRNA varied from 8–12 orders of magnitude (Table 3). At 50 cm height of CWs from the bottom, there was no significant difference in the abundances of the nitrification- and denitrification-related genes (amoA, narG, nirS, nirK, nosZ) between the two treatment groups (p > 0.05) (Table 3). However, at 20 cm height of CWs from the bottom, the abundances of the nitrification- and denitrification-related genes (amoA, narG, nirS, nosZ) were significantly higher than in the control (p < 0.05), corresponding with the better performance of Mn-CWs (Fig. 1).| Genes (copies per g) | Systems | The height of the wetland system (cm) | |
|---|---|---|---|
| 20 | 50 | ||
| a a and b – standard deviation of the single factor analysis. | |||
| amoA | Mn-CWs | 4.14 ± 0.27 × 10⁹a | 2.44 ± 0.15 × 10⁸a |
| Control | 1.09 ± 0.18 × 10⁹b | 9.60 ± 0.99 × 10⁸a | |
| narG | Mn-CWs | 1.83 ± 0.15 × 10¹⁰a | 1.61 ± 1.51 × 10⁹a |
| Control | 1.93 ± 0.31 × 10⁹b | 1.10 ± 0.75 × 10⁹a | |
| nirS | Mn-CWs | 1.82 ± 0.06 × 10¹⁰a | 1.70 ± 0.38 × 10⁹a |
| Control | 1.21 ± 0.05 × 10⁹b | 1.10 ± 0.16 × 10⁹a | |
| nirK | Mn-CWs | 5.95 ± 0.48 × 10⁹a | 1.62 ± 0.74 × 10⁹a |
| Control | 1.59 ± 0.54 × 10⁹a | 1.95 ± 0.62 × 10⁹a | |
| nosZ | Mn-CWs | 4.96 ± 0.13 × 10¹²a | 3.71 ± 0.1 × 10¹¹a |
| Control | 3.37 ± 0.73 × 10¹¹b | 4.54 ± 0.86 × 10¹¹a | |
Due to the abundances of the nitrification- and denitrification-related genes at 20 cm height of each CWs system from the bottom showing significant differences, 20 cm height samples of each CWs system from the bottom were analyzed using Illumina High-Throughput Sequencing to evaluate the impact of the birnessite-coated sand on the microbial community composition and structure. A total of 220![[thin space (1/6-em)]](https://www.rsc.org/images/entities/char_2009.gif) 864 high-quality sequences were obtained (Table S2†) and the species coverage estimates ranged from 99.56% to 99.64%, with OTUs ranging from 1041 to 1199. The Chao and ACE indexes represent the community richness, while the Shannon index is a reflection of species diversity. In this study, the Chao, ACE, and Shannon indexes were in the range of 1139.50–1303.70, 1153.13–1321.92, and 5.13–5.20, respectively. There was no difference in Shannon index at the 20 cm height between the Mn-CWs and control. There were differences in the Chao and ACE indexes between the Mn-CWs and control.
864 high-quality sequences were obtained (Table S2†) and the species coverage estimates ranged from 99.56% to 99.64%, with OTUs ranging from 1041 to 1199. The Chao and ACE indexes represent the community richness, while the Shannon index is a reflection of species diversity. In this study, the Chao, ACE, and Shannon indexes were in the range of 1139.50–1303.70, 1153.13–1321.92, and 5.13–5.20, respectively. There was no difference in Shannon index at the 20 cm height between the Mn-CWs and control. There were differences in the Chao and ACE indexes between the Mn-CWs and control.
Microbial composition at the phylum level is shown in Fig. 4a. Among the different phylums, Proteobacteria was dominant in nearly all the samples, followed by Bacteroidetes, Chloroflexi, Firmicutes, Actinobacteria, and Patescibacteria, which was consistent with previous studies about natural wetlands or CWs.29 The result showed that the relative abundance of Proteobacteria in Control-20 was 40.92%, higher than that in Mn-20, which was only 33.70%. Proteobacteria is ubiquitous in nature and also dominant in the microbial community of wastewater treatment systems. It was reported that Proteobacteria was closely associated with the global carbon and nitrogen cycles, which play an important role in pollutants removal processes in the treatment systems.30 The relative abundance of nitrifying and denitrifying bacteria is shown in Table S3† and Fig. 4b. The result presented that the relative abundance of nitrifying and denitrifying bacteria in Mn-20 was 37.07% and 42.47%, higher than that in Control-20 of 19.87% and 33.76%.
 | ||
| Fig. 4 Major bacterial distribution (a) and nitrifying and denitrifying bacteria distribution (b) at 20 cm height in the Mn-CWs and control. | ||
4. Discussion
4.1 Nutrients removal performance in vertical flow constructed wetlands
A significant enhancement of NH4–N and TN removal efficiencies (p < 0.05) were observed in Mn-CWs compared to the control, while there was no significant difference in the NO3–N removal between the Mn-CWs and control (Fig. 1). The reason may be that denitrifying bacteria are more resistant to low temperatures than ammonia oxidizing bacteria (AOB). As the main mechanism for the NH4–N removal in CWs, microbial nitrification is subject to temperature changes and turns out to be weakened in winter,31 which may be responsible for the poor NH4–N removal performance in the control group (Fig. 1a). It has been proved that Mn oxides could transform NH4–N to NO3–N through the redox reaction,5 which indicates it is tolerant to temperature variations. In this study, compared with the control (Fig. 1d), the Mn-CWs showed the fastest removal rate of NH4–N at the height of 10–20 cm with the birnessite-coated sand.Most NO3–N removal in CWs is accomplished via microbial denitrification.32 Although in cold winter, the average removal efficiencies of NO3–N in the two CWs showed no significant difference (Fig. 1b), which could be explained by the deep position where denitrification took place and the cold resistance of the denitrification microbes.33 At the height of 10–20 cm in the Mn-CWs from the bottom (Fig. 1e), the results implied that more NO3–N, including those derived from the oxidation of NH4–N, was removed through denitrification in Mn-CWs, which is consistent with the better removal performance of COD (Fig. S3†). This results is different from those of Xie et al. (2018),23 which may be related to the different operation temperature. That is, CWs with the matrix containing birnessite-coated sand, combined chemical and microbial process, could enhance CWs performance in both warm and cold seasons.
TP is mainly removed by matrix adsorption, plant uptake, and microbial action in CWs.34 During winter, plants as well as microbial biomass are decomposed, and the adsorption capacity of the support matrix on TP is decreased, resulting in phosphorus release to the aqueous phase.35 As shown in Fig. 2a, the effluent TP concentration sharply increased and even exceeded the influent concentration in the control. However, the low temperature presented had effect on the adsorption capacity of the support matrix with birnessite-coated sand, which led to a good removal performance of TP in the Mn-CWs in winter.
4.2 Role of the matrix with birnessite-coated sand in pollutant removal
Matrix adsorption plays a main role in pollutants removal in CWs. Among different TN removal pathways, matrix storage accounted for most of the TN input in the Mn-CWs and control (Fig. 3), which were both slightly higher than the results reported by Wu et al. (2013)31 within range 20.5–34.4% in warm season. Nonetheless, previous studies showed that the proportions of denitrification were more than 50%.36 The relatively lower microbial activities could explain the higher matrix storage proportion and lower other contribution in cold temperature. However, the matrix storage of TP presented different trends. In Mn-CWs, the TP proportion of matrix storage accounted for 29.80%, while P was released from the matrix in winter, corresponding with the results reported by Wittgren and Maehlum (1997).33Furthermore, various matrices had different capacities for P adsorption; for instance, washed gravel or crushed rock usually provide very low capacity for sorption and precipitation.34 This could explain why there is a desorption phenomenon of P from the support matrix in the control. Compared with sand, the birnessite-coated sand improved the matrix adsorption activity in winter, which could provide relatively stable contribution to the TP removal with microbial action inhibited. Nonetheless, as a kind of abiotic processes, adsorption by the support matrix was also affected by temperature. The proportion of matrix storage in the Mn-CWs declined a lot compared to the result of 50.13% reported by Yang et al. (2019)5 using Mn ore as a support matrix in warm seasons.
4.3 Microbial mechanisms in the Mn-CWs
Microbial processes could not be neglected even in winter. The enhanced denitrification in Mn-CWs was speculated on regarding the bioavailable carbon sources with the birnessite having an effect on organics degradation. Long-chain alkanes are generally insoluble and recalcitrant, making them partially or completely unavailable for microbial assimilation.37 Some short-chain alkanes, including n-hexane and heptane, coupled with toluene and o-xylene were only detected in Mn-CWs (Table 2 and Fig. S4†), which implied the carbon metabolism changes in the presence of the birnessite-coated sand, which was in favor of microbial degradation or denitrification. Low molecule weight esters are easily utilized by microbes.38 Although the relative content of methyl acetate in the control group (0.87%) was a little lower than that in the Mn-CWs (4.16%), the relative content of ethyl acetate (30.55%) was almost twice as high as that in the Mn-CWs (Table 2 and Fig. S4†), which indicated the Mn-CWs consumed these two kinds of compounds more easily. That is, compared with the control, the Mn-CWs had more microbial available carbon sources for denitrification.The abundances of bacteria and related genes capable of nitrification and denitrification can reflect the removal performance of NH4–N and NO3–N.39 The qPCR results (Table 3) showed that the nitrification- and denitrification-related microorganisms also play a certain role in Mn-CWs in addition to matrix adsorption. Beside the microbial quantity, the microbial community composition could also impact the pollution removal in the ecosystem. The influences of the microbial communities on nutrient cycling have been described in many studies.40,41 Both the values of the OTUs as well as the Chao, ACE, and Shannon indexes (Table S2†) were relatively low compared to previously reported ranges in warm seasons because of depressed microbial growth caused by the low temperature.23,42 These results showed that the community richness at the 20 cm height from the bottom was inhibited in the Mn-CWs in the presence of the birnessite-coated sand, indicating a shift of microbial community composition with the addition of the birnessite-coated sand. The relative abundance of nitrifying and denitrifying bacteria in Mn-20 was higher than that in Control-20 (Table S3† and Fig. 4b), which was consistent with the qPCR results (Table 3). Swathi et al. (2017)43 observed that an anoxic Mn(II) oxidation coupled with denitrification simultaneously occurred. Furthermore, the abundance of organic carbon was the most important factor in the heterotrophic denitrification process.44 The birnessite-coated sand degradated organics to bioavailable carbon sources, which enhanced denitrification in the Mn-CWs. Thus, the lower COD concentration was correlated with the higher nitrate removal efficiency, meaning that more COD was utilized for denitrification (Fig. S3†).
5. Conclusions
Mn-CWs improved the removal performance of NH4–N, TN, and TP in CWs due to the high related microbial abundance and the matrix's strong adsorptive capability. Birnessite-coated sand addition in CWs increased the proportion of available carbon sources for denitrifying bacteria, which contributed to COD removal and microbial denitrification efficiency. Furthermore, the matrix layer containing birnessite increased the abundances of nitrifying and denitrifying bacteria, which were responsible for NH4–N and NO3–N removal. The adsorption capacity of the Mn-CWs matrix was much higher than that of the control, which led to a better removal performance of TP and avoided TP desorption in winter. Therefore, constructing CWs with a modified support matrix containing birnessite-coated sand may assist the application and popularity of VFCWs in temperate areas in the future.Conflicts of interest
There are no conflicts to declare.Acknowledgements
This work was supported by National Natural Science Foundation of China (No. 51720105013, 51978385) and China Major Science and Technology Program for the Water Pollution Control and Treatment (No. 2017ZX07101003).References
- M. Wang, D. Q. Zhang, J. W. Dong and S. K. Tan, J. Environ. Sci., 2017, 57, 293–311 CrossRef PubMed.
- H. Wu, J. Fan, J. Zhang, H. H. Ngo, W. Guo, S. Liang, J. Lv, S. Lu, W. Wu and S. Wu, Bioresour. Technol., 2016, 210, 101–107 CrossRef CAS.
- Y. Li, G. Zhu, W. J. Ng and S. K. Tan, Sci. Total Environ., 2014, 468, 908–932 CrossRef PubMed.
- Y. Kang, J. Zhang, H. Xie, Z. Guo, H. H. Ngo, W. Guo and S. Liang, Bioresour. Technol., 2017, 224, 157–165 CrossRef CAS.
- Y. Yang, J. Liu, N. Zhang, H. Xie, J. Zhang, Z. Hu and Q. Wang, Ecotoxicol. Environ. Saf., 2019, 170, 446–452 CrossRef CAS.
- T. Koottatep and C. Polprasert, Water Sci. Technol., 1997, 36, 1–8 CrossRef CAS.
- M. Greenaway and A. Woolley, Water Sci. Technol., 2001, 44, 303–310 CrossRef.
- J. Zhang, H. Sun, W. Wang, Z. Hu, X. Yin, H. H. Ngo, W. Guo and J. Fan, Bioresour. Technol., 2017, 224, 222–228 CrossRef CAS.
- A. V. Dordio and A. J. P. Carvalho, J. Hazard. Mater., 2013, 252, 272–292 CrossRef.
- J. Zhang, W. Shao, M. He, H. Hu and B. Gao, Huanjing Kexue, 2006, 27, 1560–1564 Search PubMed.
- Z. Liu, H. Xie, Z. Hu, J. Zhang, J. Zhang, H. Sun and W. Lan, Water, Air, Soil Pollut., 2017, 228, 356 CrossRef.
- L. Songliu, H. Hongying, S. Yingxue and Y. Jia, J. Environ. Sci., 2009, 21, 1036–1043 CrossRef.
- Y. Li, Y. Zhang and X. Zhang, Procedia Environ. Sci., 2011, 10, 2182–2188 CrossRef CAS.
- H. Yin, X. Yan and X. Gu, Water Res., 2017, 115, 329–338 CrossRef CAS.
- I. Blanco, P. Molle, L. E. S. de Miera and G. Ansola, Water Res., 2016, 89, 355–365 CrossRef CAS.
- S. Lu, X. Zhang, J. Wang and L. Pei, J. Cleaner Prod., 2016, 127, 325–330 CrossRef.
- A. Babatunde, Y. Zhao, A. Burke, M. Morris and J. Hanrahan, Environ. Pollut., 2009, 157, 2830–2836 CrossRef CAS.
- W. Lan, J. Zhang, Z. Hu, M. Ji, X. Zhang, J. Zhang, F. Li and G. Yao, Chem. Eng. J., 2018, 335, 209–214 CrossRef CAS.
- W. Cao, Y. Wang, L. Sun, J. Jiang and Y. Zhang, Ecol. Eng., 2016, 88, 77–81 CrossRef.
- A. Drizo, C. Frost, J. Grace and K. Smith, Water Res., 1999, 33, 3595–3602 CrossRef CAS.
- C. Arias, M. Del Bubba and H. Brix, Water Res., 2001, 35, 1159–1168 CrossRef CAS.
- T. P. Joshi, G. Zhang, H. Cheng, R. Liu, H. Liu and J. Qu, Water Res., 2017, 116, 126–134 CrossRef CAS PubMed.
- H. Xie, Y. Yang, J. Liu, Y. Kang, J. Zhang, Z. Hu and S. Liang, Water Res., 2018, 143, 457–466 CrossRef CAS.
- R. McKenzie, Soil Res., 1981, 19, 41–50 CrossRef CAS.
- H. Wu, J. Zhang, P. Li, J. Zhang, H. Xie and B. Zhang, Ecol. Eng., 2011, 37, 560–568 CrossRef.
- J. Fan, J. Zhang, H. H. Ngo, W. Guo and X. Yin, Bioresour. Technol., 2016, 218, 1257–1260 CrossRef CAS.
- Y. Kang, J. Zhang, B. Li, Y. Zhang, H. Sun, H. H. Ngo, W. Guo, H. Xie, Z. Hu and C. Zhao, Chem. Eng. J., 2018, 353, 699–707 CrossRef CAS.
- J. Liu, J. Wang, C. Zhao, J. Liu, H. Xie, S. Wang, J. Zhang and Z. Hu, Appl. Microbiol. Biotechnol., 2017, 101, 1653–1660 CrossRef CAS.
- G. Ansola, P. Arroyo and L. E. S. de Miera, Sci. Total Environ., 2014, 473, 63–71 CrossRef PubMed.
- T. Tian, N. F. Tam, Q. Zan, S. Cheung, P. K. Shin, Y. Wong, L. Zhang and Z. Chen, Mar. Pollut. Bull., 2017, 124, 1096–1105 CrossRef CAS.
- H. Wu, J. Zhang, R. Wei, S. Liang, C. Li and H. Xie, Environ. Sci. Pollut. Res., 2013, 20, 443–451 CrossRef CAS.
- H. Roh, N. Subramanya, F. Zhao, C.-P. Yu, J. Sandt and K.-H. Chu, Chemosphere, 2009, 77, 1084–1089 CrossRef CAS PubMed.
- H. B. Wittgren and T. Maehlum, Water Sci. Technol., 1997, 35, 45–53 CrossRef CAS.
- J. Vymazal, Sci. Total Environ., 2007, 380, 48–65 CrossRef CAS PubMed.
- B. Gardner and J. P. Jones, Commun. Soil Sci. Plant Anal., 1973, 4, 83–93 CrossRef CAS.
- D. C. Seo and R. DeLaune, Water Res., 2010, 44, 2441–2450 CrossRef CAS.
- A. Wentzel, T. E. Ellingsen, H.-K. Kotlar, S. B. Zotchev and M. Throne-Holst, Appl. Microbiol. Biotechnol., 2007, 76, 1209–1221 CrossRef CAS.
- Q. Tian, L. Zhuang, S. K. Ong, Q. Wang, K. Wang, X. Xie, Y. Zhu and F. Li, Water Res., 2017, 119, 267–275 CrossRef CAS.
- F. Oehl, E. Frossard, A. Fliessbach, D. Dubois and A. Oberson, Soil Biol. Biochem., 2004, 36, 667–675 CrossRef CAS.
- W. J. Landesman and J. Dighton, Soil Biol. Biochem., 2010, 42, 1751–1758 CrossRef CAS.
- K. Song, H. Kang, L. Zhang and W. J. Mitsch, Ecol. Eng., 2012, 38, 130–134 CrossRef.
- G. Hua, Y. Cheng, J. Kong, M. Li and Z. Zhao, Bioresour. Technol., 2018, 248, 104–112 CrossRef CAS.
- D. Swathi, P. Sabumon and S. M. Maliyekkal, Int. Biodeterior. Biodegrad., 2017, 119, 499–510 CrossRef CAS.
- W. Wan, D. He and Z. Xue, Ecol. Eng., 2017, 99, 199–208 CrossRef.
Footnote |
| † Electronic supplementary information (ESI) available. See DOI: 10.1039/c9ra07364g |
| This journal is © The Royal Society of Chemistry 2019 |