 Open Access Article
Hydrogenation of alkyl-anthraquinone over hydrophobically functionalized Pd/SBA-15 catalysts
Li Wanga,
Yue Zhanga,
Qingqing Maa,
Zhiyong Panb and
Baoning Zong *b
*b
aKey Laboratory for Green Chemical Technology of Ministry of Education, School of Chemical Engineering and Technology, Tianjin University, Tianjin, 300072, China. E-mail: wlytj@tju.edu.cn
bResearch Institute of Petroleum Processing, SINOPEC, Beijing, 100083, China. E-mail: zongbn.ripp@sinopec.com
First published on 28th October 2019
Abstract
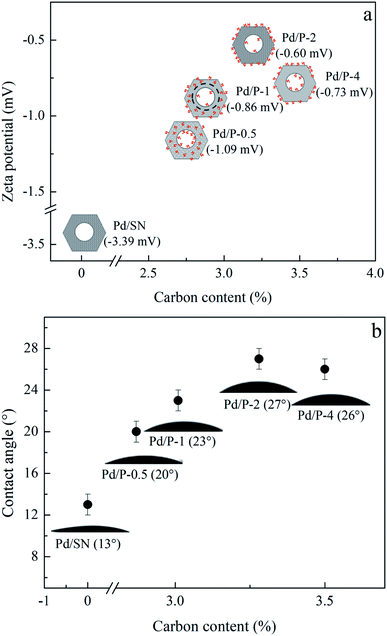
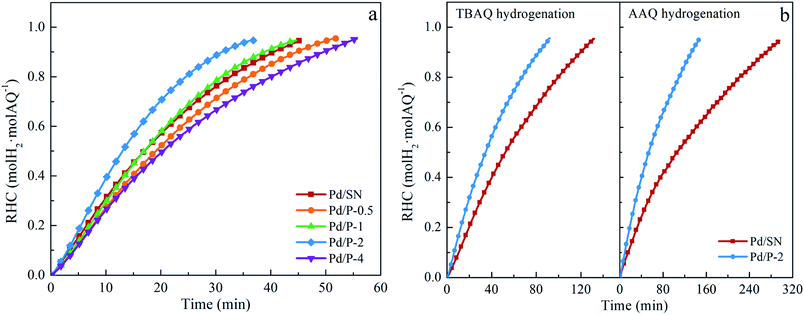
Organosilane-functionalized mesoporous silica SBA-15 was prepared by the co-condensation method and then applied as a support of Pd catalysts for hydrogenation of 2-alkyl-anthraquinone (AQ, alkyl = ethyl, tert-butyl and amyl). The as-prepared Pd catalysts were characterized by X-ray diffraction, Fourier transform infrared spectroscopy, thermogravimetric analysis, N2 adsorption–desorption, zeta potential, water contact angles measurement and transmission electron microscopy. By extending the pre-hydrolysis time of the silica source, the content of functional groups in the catalysts slightly increases. However, there is an initial increase in zeta potential and water contact angles up to a maximum at 2 h, followed by a decrease as the pre-hydrolysis time was further prolonged. The hydrophobicity created by organic functionalization has positive effects on AQ hydrogenation. The catalyst with the highest hydrophobicity exhibits the highest catalytic activity, with increments of 33.3%, 60.0% and 150.0% for hydrogenation of ethyl-, tert-butyl- and amyl-anthraquinone compared with the unfunctionalized one.
1 Introduction
Hydrogen peroxide (H2O2) is a green oxidant in line with ecological requirements and has been widely used in many domains.1–3 The worldwide consumption of hydrogen peroxide tends to raise yearly and annual production of hydrogen peroxide reached 6 million tons in 2016 (based on 100% H2O2).4,5 At present, the anthraquinone process is almost the only industrial production method of hydrogen peroxide.6 It involves four main processes: hydrogenation of a 2-alkyl-anthraquinone (AQ), such as 2-ethyl-anthraquinone (EAQ) and 2-amyl-anthraquinone (AAQ) in a nonpolar–polar mixed solvent (working solution), oxidation of produced 2-alkyl-anthrahydroquinone (AQH2), extraction of hydrogen peroxide with water from the working solution and regeneration of the working solution. There are two routes of side reactions in hydrogenation of AQ: hydrogenation of the aromatic ring and carbonyl hydrolysis of AQH2.7 Among the by-products formed via deep hydrogenation reactions, 2-alkyl-tetrahydro-anthraquinone is active and others are identified as degradation products because they cannot be further oxidized to produce H2O2.8Supported Pd-based catalysts have been widely employed in hydrogenation of AQ.9,10 Surface area and pore size, acidity/basicity and hydrophilicity/hydrophobicity of support are demonstrated to be the crucial parameters affecting the catalytic performance. Tang et al. prepared an Al2O3 support by extrusion method with pseudoboehmite as precursor and found the Pd catalyst on it to be highly effective for EAQ hydrogenation due to the higher surface area and ordered pore structure.11 Chen et al. reported that large-diametered uniform mesopore of SBA-15 was conducive to the hydrogenation of EAQ.12 The similar result that catalytic activity of EAQ hydrogenation remarkably increased with expanding the pore size of Pd/SBA-15 was also observed by Yuan and Wang et al.13,14 Li et al. proposed that the large-pored catalyst was beneficial to the diffusion of both EAQ and EAQH2, restraining the occurrence of deep hydrogenation.15 Hong et al. drew the same conclusion by performing hydrogenation of EAQ over anodic alumina oxide supported Pd catalyst with different pore sizes.16
Kosydar et al.17 and Chen et al.18 reported that alkali-modification of Al2O3 support could resulted in significant suppression of deep hydrogenation reactions. Drelinkiewicz et al. proposed that the Pd catalyst on SiO2 support was more durable and could suppress the formation of degradation products compared with that on Al2O3.19 Feng et al. considered that acid sites in Al2O3–SiO2 support could facilitate the adsorption of EAQ molecules and thus improve the hydrogenation activity.20 Yuan et al. found the selectivity of EAQ hydrogenation over Pd/SBA-15 to be significantly promoted by incorporating Mg into SBA-15 and the rate of EAQ hydrogenation to be accelerated by incorporating Al into SBA-15.13 Li et al. observed the addition of MgO into Pd/SiO2/cordierite monolith catalyst to be favourable to the catalytic activity of EAQ hydrogenation and attributed it to the facilitated activation and adsorption of C![[double bond, length as m-dash]](https://www.rsc.org/images/entities/char_e001.gif) O group.21
O group.21
Polymer supports are attended by researchers as well. Bombi et al. prepared resin supported Pd catalyst and achieved high activity but ordinary selectivity.22 Biffis et al. designed suitable tailor-made resin supported Pd catalyst and improved the selectivity to EAQH2 due to the lipophilic micro-environments around Pd particles.23 Drelinkiewicz et al. employed polyaniline (PANI) coated SiO2 as the support of Pd catalysts, and showed them to be high activity and selectivity for EAQ hydrogenation.24 In previous work, the Pd catalysts were prepared on SBA-15 post-grafted with alkyltriethoxysilane and evaluated using hydrogenation of EAQ. It was found that the catalytic activity increased with the content of carbon in the catalysts.25 But it is difficult to further increase grafting amount due to the limitation of silanol groups available.26
The co-condensation of silica source and organotrialkoxysilane is another common approach of organic functionalization of SBA-15, by which the higher functionalization degree can be achieved.27 3-Aminopropyl-triethoxysilane (APTES) is the most commonly used functional reagent. Chong et al. prepared APTES functionalized SBA-15 with ordered structure and uniform pore size distribution.26 Niu et al. found that 3-aminopropyl functionalized SBA-15 could control the delivery of baicalin more efficiently than pure SBA-15.28 Other organic functionalization agents are also used for the functionalization of SBA-15 by the co-condensation method. Barczak et al. reported the synthesis of functionalized SBA-15 by the condensation of 2-(2-pyridyl)ethyltrimethoxysilane (PETS) and tetraethyl orthosilicate (TEOS).29 Pt catalyst supported on 3-mercaptopropyletrimethoxysilane (MPTMS) functionalized SBA-15 was prepared by Khan et al. and applied to the decomposition of sulfuric acid in Sulfur–Iodine cycle.30 Zhu et al. used aldehyde functionalized SBA-15 as ammonia sensor, which exhibited excellent sensitivity, response speed and reversibility.31
In this work, hydrophobically functionalized SBA-15 was synthesized by the co-condensation method with propyl-triethoxysilane (PTES) as modification agent and supported Pd catalyst was prepared on the as-synthesized SBA-15. The influences of pre-hydrolysis time of silica source on the content and distribution of organosilane in the catalysts and thereby on physicochemical properties and catalytic performance of catalysts were investigated. The hydrogenation of AQ (2-alkyl-anthraquinone, alkyl = ethyl, tert-butyl and amyl) was selected for performance test of catalysts.
2 Experimental
2.1 Preparation
For comparison, a conventional SBA-15 was also synthesized using the same procedures and conditions as those mentioned-above, without the addition of PTES. And a calcination procedure at 550 °C for 6 h in air replaced the extraction with ethanol to remove P123.
For conventionally synthesized SBA-15 support, Pd(NO3)2·2H2O (≥99.0%, Macklin Biochemical Co., Ltd., Shanghai) was used as Pd source25 and the resulting catalyst is denoted as Pd/SN.
2.2 Characterization
Powder X-ray diffraction (XRD) patterns were recorded on a Philips X′Pert MPD diffractometer (Cu-Kα radiation). Fourier transform infrared (FTIR) spectra were obtained on a FTIR Bruker Equinox Vertex 70 spectrometer using a KBr wafer (60 mg with 1![[thin space (1/6-em)]](https://www.rsc.org/images/entities/char_2009.gif) :
:![[thin space (1/6-em)]](https://www.rsc.org/images/entities/char_2009.gif) 50 in the mass ratio of sample to KBr and 0.63 cm in a diameter for each measured catalyst) in an in situ cell at a residual pressure of 10−4 mbar. Prior to measurement, the powder sample was dried in a vacuum drying oven at 50 °C for 12 h. Elemental analysis was performed on an Elementar Vario EL elemental analyzer with high sensitivity thermal conductivity detector (TCD) in the mode of CHN. Thermogravimetric analysis (TGA) was recorded on a TQ500 Thermal analyzer from TA instrument under air atmosphere from room temperature to 700 °C with the heating rate of 10 °C min−1. Nitrogen adsorption–desorption measurements were carried out at liquid nitrogen temperature on an APSP 2020 volumetric adsorption analyzer, samples were pre-degassed at 200 °C to remove water and other physical adsorbed species. Zeta potential was measured by a Malvern Nano ZS laser granulometer with a 4 mW and 633 nm He–Ne laser. Water contact angles were measured on a Powereach JC2000D2M Drop Shape Analyzer. The TEM images were obtained using a JEOL JEM-2100F transmission electron microscopy.
50 in the mass ratio of sample to KBr and 0.63 cm in a diameter for each measured catalyst) in an in situ cell at a residual pressure of 10−4 mbar. Prior to measurement, the powder sample was dried in a vacuum drying oven at 50 °C for 12 h. Elemental analysis was performed on an Elementar Vario EL elemental analyzer with high sensitivity thermal conductivity detector (TCD) in the mode of CHN. Thermogravimetric analysis (TGA) was recorded on a TQ500 Thermal analyzer from TA instrument under air atmosphere from room temperature to 700 °C with the heating rate of 10 °C min−1. Nitrogen adsorption–desorption measurements were carried out at liquid nitrogen temperature on an APSP 2020 volumetric adsorption analyzer, samples were pre-degassed at 200 °C to remove water and other physical adsorbed species. Zeta potential was measured by a Malvern Nano ZS laser granulometer with a 4 mW and 633 nm He–Ne laser. Water contact angles were measured on a Powereach JC2000D2M Drop Shape Analyzer. The TEM images were obtained using a JEOL JEM-2100F transmission electron microscopy.
2.3 Hydrogenation test
AQ hydrogenation was carried out in a batch reactor with the volume of 100 mL. Firstly, dried AQ (2-ethyl-anthraquinone, EAQ, ≥99.0%, Wuhan Fude Chemical Co., Ltd., China; 2-tert-butyl-anthraquinone, TBAQ, >98.0%, TCI Tokyo Chemical Industry Co., Ltd., Japan; 2-amyl-anthraquinone, AAQ, ≥99.0%, Shanghai Ruisi Chemical Co., Ltd., China) was dissolved in a mixture solvent of 1,3,5-trimethylbenzene (TMB, 97%, Aladdin Industrial Corporation, China) and trioctyl phosphate (TOP, 98%, TCI Tokyo Chemical Industry Co., Ltd., Japan) with the volume ratio of 1![[thin space (1/6-em)]](https://www.rsc.org/images/entities/char_2009.gif) :
:![[thin space (1/6-em)]](https://www.rsc.org/images/entities/char_2009.gif) 1, yielding a working solution with the AQ concentration of 0.38 mol L−1. Then, 0.2 g reduced catalyst and 30 mL working solution were added into the reactor. N2 was fed to replace air and the reactor was heated to 60 °C in a water bath. Finally, H2 was fed into the reactor. When the pressure reached 0.3 MPa, the mechanical agitation was turned on and the reaction was started. H2 consumption was measured by a mass flowmeter. After the reaction finished, the hydrogenated working solution was completely oxidized with O2 at room temperature and atmospheric pressure and then hydrogen peroxide was extracted with deionized water for 4 times. H2O2 in the water phase was determined by titration with KMnO4 solution. The raffinate was analyzed by a gas chromatography (Bruker 456-GC) with DB-17 column (60 m × 0.32 mm × 0.25 μm) and FID detector.
1, yielding a working solution with the AQ concentration of 0.38 mol L−1. Then, 0.2 g reduced catalyst and 30 mL working solution were added into the reactor. N2 was fed to replace air and the reactor was heated to 60 °C in a water bath. Finally, H2 was fed into the reactor. When the pressure reached 0.3 MPa, the mechanical agitation was turned on and the reaction was started. H2 consumption was measured by a mass flowmeter. After the reaction finished, the hydrogenated working solution was completely oxidized with O2 at room temperature and atmospheric pressure and then hydrogen peroxide was extracted with deionized water for 4 times. H2O2 in the water phase was determined by titration with KMnO4 solution. The raffinate was analyzed by a gas chromatography (Bruker 456-GC) with DB-17 column (60 m × 0.32 mm × 0.25 μm) and FID detector.
3 Results and discussion
3.1 Characterization of catalysts
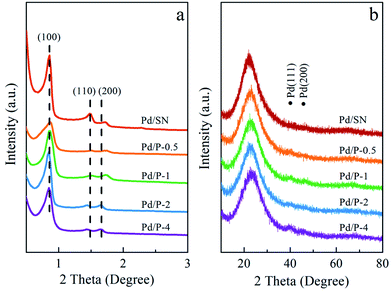
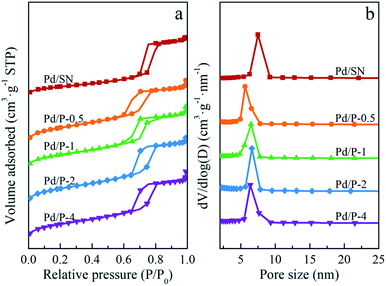
The wide angle XRD patterns are shown in Fig. 1(b). The diffraction peak at 2θ = 22° corresponds to amorphous silica.34 In addition, two extremely weak diffraction peaks are observed at 2θ = 40.1° and 46.5°, indexed to (111) and (200) reflections of palladium lattice.35 Among all catalysts, the signals of Pd0 in Pd/P-0.5 can almost not be observed, which are similar to those in Pd/SN. This may be due to the slightly higher dispersion of Pd particles in Pd/P-0.5 and Pd/SN than in others.36
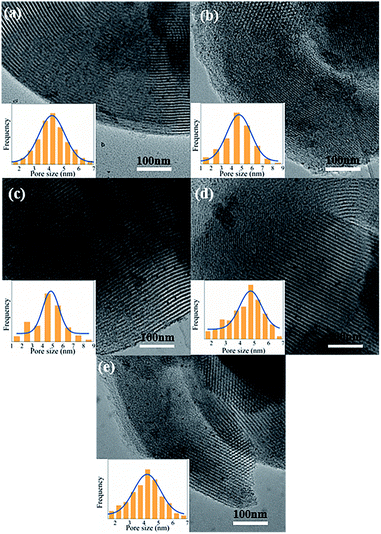
| Catalysts | mcEAa (%) | mLb (%) | mcGAc (%) | SBETd (m2 g−1) | VPe (cm3 g−1) | dPf (nm) | twall/a0g (nm) | DPdh (nm) |
|---|---|---|---|---|---|---|---|---|
| a Carbon content of catalysts determined by elemental analysis.b Weight loss at 200–700 °C determined by thermogravimetric analysis.c Difference in mL between Pd/P-Xs and Pd/SN.d Specific surface area calculated by BET method.e Total pore volume obtained at 0.9 in the relative pressure of P/P0.f Pore size calculated from the desorption branch by BJH method.g Pore wall thickness (twall = a0 − dP)/crystal cell parameter.h Average size of Pd particles estimated from TEM images. | ||||||||
| Pd/P-0.5 | 2.87 | 4.20 | 2.63 | 789 | 1.02 | 5.6 | 6.1/11.7 | 4.3 |
| Pd/P-1 | 3.01 | 4.65 | 3.08 | 813 | 1.09 | 6.5 | 5.4/11.9 | 4.6 |
| Pd/P-2 | 3.28 | 4.94 | 3.37 | 829 | 1.15 | 6.6 | 5.4/12.0 | 4.6 |
| Pd/P-4 | 3.50 | 5.10 | 3.53 | 822 | 1.12 | 6.4 | 5.6/12.0 | 4.7 |
| Pd/SN | — | 1.57 | — | 497 | 1.05 | 8.0 | 3.8/11.8 | 4.4 |
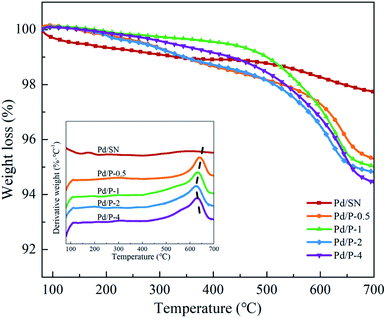
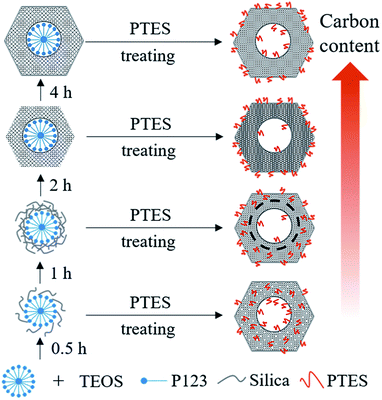
As shown in the DTG curves of catalysts, the maximum peak temperature in the range of high temperature slightly decreases with extending the pre-hydrolysis time from 0.5 to 2 h and achieves the lowest value at 2 h. Then, it rises slightly as the pre-hydrolysis time further extended to 4 h. It can be explained by the different distribution of organic groups. The decomposition temperature of the organic groups distributed on the outer surface of SBA-15 should be relatively low. At the early stage of synthesis, a small amount of TEOS is hydrolyzed and formed silanol groups are not yet self-assembly around the P123 micelles. The functional groups could be dispersed homogeneously in the mixture of TEOS and P123, which is similar to the description by Kecht et al. in their studies on selective functionalization of CMS materials.42 Hence, the functional groups added at 0.5 h would co-condense with silanol groups around P123 and a small part of functional groups may penetrate into P123 micelles, resulting in more distribution on the pore wall and inside pores of SBA-15 as shown in Scheme 1. With any extension of TEOS pre-hydrolysis time longer than 0.5 h (1 h and 2 h), the amount of hydrolyzed TEOS increases and silanol groups gradually condense around P123, which makes more functional groups gradually distributed on the outer surface. At 4 h, the compact structure between P123 and silica forms, which compels functional groups to concentrate on the channel opening. The change in distribution of functional groups in SBA-15 with the pre-hydrolysis time of TEOS is in good agreement with that of the pore size of Pd/P-Xs (Table 1).
3.2 Catalytic test
| Catalysts | Reactants | r0a (mol H2 per g Pd per min) | Sb, % | |||
|---|---|---|---|---|---|---|
| AQH2 | H4AQ | EAN | iso-H4EAQ | |||
| a Initial hydrogen consumption rate defined as hydrogen consumption per unit reaction time and Pd mass in the linear region of RHC curve (Fig. 7).b Selectivity at RHC of about 0.95. | ||||||
| Pd/P-0.5 | EAQ | 0.14 | 94.9 | 3.6 | 1.3 | 0.2 |
| Pd/P-1 | EAQ | 0.16 | 95.1 | 3.5 | 1.2 | 0.2 |
| Pd/P-2 | EAQ | 0.20 | 95.3 | 3.4 | 1.1 | 0.2 |
| Pd/P-4 | EAQ | 0.13 | 94.6 | 3.8 | 1.4 | 0.2 |
| Pd/SN | EAQ | 0.15 | 94.3 | 4.1 | 1.4 | 0.2 |
| Pd/P-2 | TBAQ | 0.08 | 93.2 | 6.4 | 0.4 | — |
| Pd/SN | TBAQ | 0.05 | 93.3 | 6.4 | 0.3 | — |
| Pd/P-2 | AAQ | 0.05 | 92.9 | 6.7 | 0.4 | — |
| Pd/SN | AAQ | 0.02 | 93.1 | 6.6 | 0.3 | — |
The selectivity to target product 2-ethyl-anthrahydroquinone (EAQH2) and by-products detected including 2-ethyl-anthrone (EAN), 2-ethyl-5,6,7,8-tetrahydroanthraquinone (H4EAQ), and 2-ethyl-1,2,3,4-tetrahydroanthraquinone (iso-H4EAQ) at about 0.95 in RHC are shown in Table 2. Bombi et al.22 and Biffis et al.23 reported that the lipophilic catalysts could reduce the probability of deep hydrogenation, improving the selectivity. In this work, however, the selectivity to EAQH2 is very close (approximately 95%). This might be ascribed to the low polarity of EAQH2. Moreover, the hydrophobicity of Pd/P-Xs is much lower than that of lipophilic supports used in their work. Under this circumstance, the improvement effect of hydrophobicity created by organic functionalization on the selectivity is slight and it is easy to be neutralized by the negative effects of decreased pore size of functionalized catalysts on the selectivity.
For hydrogenation of TBAQ and AAQ, the by-products detected in this work are only corresponding H4AQ (2-tert-butyl- and 2-amyl-5,6,7,8-tetrahydroanthraquinone, H4TBAQ and H4AAQ) and AN (2-tert-butyl- and 2-amyl-anthrone, TBAN and AAN). As can be seen in Table 2, the selectivity to the target products and by-products over functionalized and unfunctionalized catalysts is very close, which is similar to the results of the EAQ hydrogenation. Moreover, the selectivity of TBAQ and AAQ hydrogenation is also very close.
4 Conclusions
PTES functionalized SBA-15 was synthesized by the co-condensation method and used as the support for preparation of Pd catalyst. The hydrophilicity/hydrophobicity and pore size of catalysts were shown to be greatly affected by the pre-hydrolysis time of TEOS. The organic functional groups in SBA-15 support synthesized at the pre-hydrolysis time of 2 h trend to distribute on its outer surface and the Pd catalyst prepared on it (Pd/P-2) has the highest hydrophobicity and largest pore size. The combination of the high hydrophobicity and largest pore size benefits the activity of catalyst. The highest initial hydrogen consumption rate for the EAQ hydrogenation (0.2 mol H2 per g Pd per min) was obtained over Pd/P-2.The positive effect of support hydrophobicity on catalyst activity increases with the length of alkyl side chain in 2-alkyl-anthraquinone. The initial hydrogen consumption rate for the AAQ hydrogenation obtained over Pd/P-2 increased by 150.0% compared with that over the catalyst prepared on unfunctionalized SBA-15 support.
Conflicts of interest
There are no conflicts to declare.Acknowledgements
This work is supported by financial support from the National Natural Science Foundation of China (21676184).References
- R. Guan, X. Yuan, Z. Wu, L. Jiang, Y. Li and G. Zeng, Chem. Eng. J., 2018, 339, 519–530 CrossRef CAS.
- R. Ciriminna, L. Albanese, F. Meneguzzo and M. Pagliaro, ChemSusChem, 2016, 9, 3374–3381 CrossRef CAS.
- Y. Guo, C. Dai and Z. Lei, Chem. Eng. Process., 2019, 136, 211–225 CrossRef CAS.
- S. Yang, A. Verdaguer-Casadevall, L. Arnarson, L. Silvioli, V. Čolić, R. Frydendal, J. Rossmeisl, I. Chorkendorff and I. E. L. Stephens, ACS Catal., 2018, 8, 4064–4081 CrossRef CAS.
- H. Li, B. Zheng, Z. Pan, B. Zong and M. Qiao, Front. Chem. Sci. Eng., 2017, 12, 124–131 CrossRef.
- H. Yao, C. Shen, Y. Wang and G. Luo, RSC Adv., 2016, 6, 23942–23948 RSC.
- A. Drelinkiewicz and A. Waksmundzka-Góra, J. Mol. Catal. A: Chem., 2006, 246, 167–175 CrossRef CAS.
- R. Kosydar, A. Drelinkiewicz and J. P. Ganhy, Catal. Lett., 2010, 139, 105–113 CrossRef CAS.
- E. Yuan, C. Wu, X. Hou, M. Dou, G. Liu, G. Li and L. Wang, J. Catal., 2017, 347, 79–88 CrossRef CAS.
- R. E. Albers, M. Nyström, M. Siverström, A. Sellin, A.-C. Dellve, U. Andersson, W. Herrmann and T. Berglin, Catal. Today, 2001, 69, 247–252 CrossRef.
- P. Tang, Y. Chai, J. Feng, Y. Feng, Y. Li and D. Li, Appl. Catal., A, 2014, 469, 312–319 CrossRef CAS.
- X. Chen, S. Wang, J. Zhuang, M. Qiao, K. Fan and H. He, J. Catal., 2004, 227, 419–427 CrossRef CAS.
- E. Yuan, C. Wu, G. Liu, G. Li and L. Wang, J. Ind. Eng. Chem., 2018, 66, 158–167 CrossRef CAS.
- N. Wang, Q. Ma, E. Yuan and L. Wang, Trans. Tianjin Univ., 2019, 25, 595–602 CrossRef CAS.
- X. Li, H. Su, G. Ren and S. Wang, RSC Adv., 2015, 5, 100968–100977 RSC.
- R. Hong, J. Feng, Y. He and D. Li, Chem. Eng. Sci., 2015, 135, 274–284 CrossRef CAS.
- R. Kosydar, A. Drelinkiewicz, E. Lalik and J. Gurgul, Appl. Catal., A, 2011, 402, 121–131 CrossRef CAS.
- H. Chen, D. Huang, X. Su, J. Huang, X. Jing, M. Du, D. Sun, L. Jia and Q. Li, Chem. Eng. J., 2015, 262, 356–363 CrossRef CAS.
- A. P. A. Drelinkiewicz, R. Kangas and R. Laitinen, Catal. Lett., 2004, 94, 157–170 CrossRef CAS.
- J.-T. Feng, H.-Y. Wang, D. G. Evans, X. Duan and D.-Q. Li, Appl. Catal., A, 2010, 382, 240–245 CrossRef CAS.
- X. Li, H. Su, G. Ren and S. Wang, Appl. Catal., A, 2016, 517, 168–175 CrossRef CAS.
- G. Bombi, S. Lora, M. Zancato, A. A. D'Archivio, K. Jerabek and B. Corain, J. Mol. Catal. A: Chem., 2003, 194, 273–281 CrossRef CAS.
- A. Biffis, R. Ricoveri, S. Campestrini, M. Kralik, K. Jeroea¡bek and B. Corain, Chem.–Eur. J., 2002, 8, 2962–2967 CrossRef CAS.
- A. Drelinkiewicz, A. Waksmundzka-Góra, J. W. Sobczak and J. Stejskal, Appl. Catal., A, 2007, 333, 219–228 CrossRef CAS.
- Q. Ma, N. Wang, G. Liu and L. Wang, Microporous Mesoporous Mater., 2019, 279, 245–251 CrossRef CAS.
- A. S. M. Chong and X. S. Zhao, J. Phys. Chem. B, 2003, 107, 12650–12657 CrossRef CAS.
- D. Rath, S. Rana and K. M. Parida, RSC Adv., 2014, 4, 57111–57124 RSC.
- X. Niu, X. Zhou, Z. Lv, Y. Gao, J. Zhang and H. Wang, Mater. Res. Innovations, 2016, 20, 151–155 CrossRef CAS.
- M. Barczak, J. Solid State Chem., 2018, 258, 232–242 CrossRef CAS.
- H. A. Khan, A. Jaleel, P. Natarajan, S. Yoon and K.-D. Jung, Int. J. Hydrogen Energy, 2019 DOI:10.1016/j.ijhydene.2019.05.139.
- Y. Zhu, Z. Cheng, Q. Xiang, Y. Zhu and J. Xu, Sens. Actuators, B, 2018, 256, 888–895 CrossRef CAS.
- Z. Zhang, Y. Luo, Y. Guo, W. Shi, W. Wang, B. Zhang, R. Zhang, X. Bao, S. Wu and F. Cui, Chem. Eng. J., 2018, 344, 114–123 CrossRef CAS.
- X. Wang, Y.-H. Tseng, J. C. C. Chan and S. Cheng, Microporous Mesoporous Mater., 2005, 85, 241–251 CrossRef CAS.
- J. Sun, J. Zhang, H. Fu, H. Wan, Y. Wan, X. Qu, Z. Xu, D. Yin and S. Zheng, Appl. Catal., B, 2018, 229, 32–40 CrossRef CAS.
- F. Ulusal, E. Erünal and B. Güzel, J. Nanopart. Res., 2018, 20, 219 CrossRef.
- L. Li, L.-X. Zhang, J.-L. Shi, J.-N. Yan and J. Liang, Appl. Catal., A, 2005, 283, 85–89 CrossRef CAS.
- T. Ji, C. Ma, L. Brisbin, L. Mu, C. G. Robertson, Y. Dong and J. Zhu, Appl. Surf. Sci., 2017, 399, 565–572 CrossRef CAS.
- R. He, Z. Wang, L. Tan, Y. Zhong, W. Li, D. Xing, C. Wei and Y. Tang, Microporous Mesoporous Mater., 2018, 257, 212–221 CrossRef CAS.
- M. M. Abolghasemi, S. Hassani and M. Bamorowat, Microchim. Acta, 2015, 183, 889–895 CrossRef.
- J. Huang, M. Ye, Y. Qu, L. Chu, R. Chen, Q. He and D. Xu, J. Colloid Interface Sci., 2012, 385, 137–146 CrossRef CAS.
- H. Yang, F. Li, C. Shan, D. Han, Q. Zhang, L. Niu and A. Ivaska, J. Mater. Chem., 2009, 19, 4632–4638 RSC.
- J. Kecht, A. Schlossbauer and T. Bein, Chem. Mater., 2008, 20, 7207–7214 CrossRef CAS.
- T. Krajnovic, D. Maksimovic-Ivanic, S. Mijatovic, D. Draca, K. Wolf, D. Edeler, L. A. Wessjohann and G. N. Kaluderovic, Nanomaterials, 2018, 8, 322 CrossRef.
- Y. Xia, Z. Yang, R. Zhang, Y. Xing and X. Gui, Fuel, 2019, 239, 145–152 CrossRef CAS.
- J. M. Rosenholm and M. Lindén, Chem. Mater., 2007, 19, 5023–5034 CrossRef CAS.
- H. G. Hosseini, E. Doustkhah, M. V. Kirillova, S. Rostamnia, G. Mahmoudi and A. M. Kirillov, Appl. Catal., A, 2017, 548, 96–102 CrossRef CAS.
- X. Chen, J. Catal., 2003, 220, 254–257 CrossRef CAS.
- A. Drelinkiewicz, A. Waksmundzkagora, W. Makowski and J. Stejskal, Catal. Commun., 2005, 6, 347–356 CrossRef CAS.
- E. Yuan, X. Ren, L. Wang and W. Zhao, Front. Chem. Sci. Eng., 2017, 11, 177–184 CrossRef CAS.
| This journal is © The Royal Society of Chemistry 2019 |

