 Open Access Article
The effect of graphitization degree of carbonaceous material on the electrochemical performance for aluminum-ion batteries†
Junxiang Wanga,
Jiguo Tu *a,
Haiping Leia and
Hongmin Zhu*ab
aState Key Laboratory of Advanced Metallurgy, University of Science and Technology Beijing, Beijing 100083, PR China. E-mail: hzhu@material.tohoku.ac.jp; guo15@126.com
bDepartment of Metallurgy, Graduate School of Engineering, Tohoku University, Sendai, Miyagi 9808579, Japan
First published on 28th November 2019
Abstract
Aluminum-ion batteries are currently regarded as the most promising energy storage batteries. The recent development of aluminum-ion batteries has been greatly promoted based on the use of graphitic carbon materials as a positive electrode. However, it remains unclear whether all carbonaceous materials can achieve excellent electrochemical behaviour similar to graphite. In this study, the correlation between the graphitization degree and capacity of a graphite electrode is systematically investigated for aluminum-ion batteries. The results show that the higher the graphitization degree, the larger the charge/discharge capacity and the better the cycling stability. Moreover, graphite nanoflakes with the highest graphitization degree deliver an initial discharge capacity of 66.5 mA h g−1 at a current density of 100 mA g−1, eventually retaining 66.3 mA h g−1 after 100 cycles with a coulombic efficiency of 96.1% and capacity retention of 99.7%, exhibiting an ultra-stable cycling performance. More importantly, it can be concluded that the discharge capacity of different kinds of graphite materials can be predicted by determining the graphitization degree.
1. Introduction
Carbon, one of the most abundant elements in nature, usually exists in three main forms, namely graphite, diamond and amorphous carbon.1–3 Graphite has been widely proposed due to its unique physical and chemical properties which make it a promising candidate for a variety of applications, especially as an electrode material for electrochemical energy storage.4–7 On the other hand, amorphous carbon can be divided into graphitizable carbon (soft carbon) and non-graphitizable carbon (hard carbon), according to differences in the graphitization process.8–12 Both soft carbon and hard carbon have defects in the net plane, such as voids, and dislocation and impurity atoms, which limits their application in some fields.Additionally, previous studies showed that the graphitization degree or disorder probability plays an important role in the electrochemical properties of carbon materials as negative electrodes for lithium-ion batteries.13–16 Graphite material with high graphitization degree exhibits long voltage plateau and low discharge plateau.13 Moreover, Fan, et al.14 also found that the discharge capacity of graphite as negative electrode still depends strongly on graphitization degree. With the increase of calcining temperature, lithium storage capacity increases obviously. Moreover, in our previous results, graphite as positive electrode for aluminum-ion batteries (AIBs) exhibited higher capacity and greater intercalation/deintercalation behavior than amorphous carbon.17 However, there are still inadequate investigations to identify the key parameters of carbonaceous materials that provide the improved electrochemical properties for AIBs, as carbonaceous materials have large varieties in the microstructure, morphology, crystallinity and graphitization degree.
In this work, we discussed the morphology and structure evolution of carbon black to graphite nanoflakes in the further graphitization process. Furthermore, the relationship between the graphitization degree and discharge capacity of the as-prepared graphite electrode was systematically investigated for AIBs. It is of great significance to indicate that the change between the discharge capacity and graphitization degree is in the positive relationship, meaning that the higher the graphitization degree, the larger the charge/discharge capacity and the better the cycling stability.
2. Experimental
2.1. Electrochemical transformation of carbon black to graphite nanoflakes
The electrochemical transformation process of carbon black to graphite nanoflakes is similar to the previous study.17 Molten anhydrous CaCl2 and LiCl with a molar ratio of 65![[thin space (1/6-em)]](https://www.rsc.org/images/entities/char_2009.gif) :
:![[thin space (1/6-em)]](https://www.rsc.org/images/entities/char_2009.gif) 35 were used as the electrolyte, carbon black powder was pressed into pellet as cathode and SnO2 rod was applied as anode. Constant cell voltage electrolysis at 2.6 to 2.8 V was carried out in a vertical resistance furnace at 800–850 °C in Ar atmosphere using a two electrode configuration by the power supply (Solartron 1287). After electrolysis, the product was collected and washed in dilute HCl and distilled water to remove the adherent salt, and then dried in oven at 80 °C for 12 h. Accordingly, the products obtained under different electrolysis conditions were shown in Table S1.†
35 were used as the electrolyte, carbon black powder was pressed into pellet as cathode and SnO2 rod was applied as anode. Constant cell voltage electrolysis at 2.6 to 2.8 V was carried out in a vertical resistance furnace at 800–850 °C in Ar atmosphere using a two electrode configuration by the power supply (Solartron 1287). After electrolysis, the product was collected and washed in dilute HCl and distilled water to remove the adherent salt, and then dried in oven at 80 °C for 12 h. Accordingly, the products obtained under different electrolysis conditions were shown in Table S1.†
2.2. Material characterization
The graphitization degree and crystallinity of the obtained products were determined by an X-ray diffraction (XRD) measurement using a Rigaku SmartLab instrument using Cu Kα radiation (λ = 1.540593 Å) and high resolution Raman spectrometer at an incident laser wavelength of 532 nm (HORIBA, LabRAM HR Evolution). The morphologies and microstructures were characterized by field emission scanning electron microscopy (FESEM, JEOL, JSM-6701F). Nitrogen adsorption–desorption measurements were carried out at the liquid nitrogen temperature (77.3 K) using an automatic porosity analyzer (Quantachrome, Autosorb IQ MP).2.3. Fabrication of Al-ion batteries
The working electrodes were prepared by mixing the as-prepared electrolyzed materials, acetylene black as conducting agent and poly(vinylidene difluoride) (PVDF) as binder with a weight ratio of 7![[thin space (1/6-em)]](https://www.rsc.org/images/entities/char_2009.gif) :
:![[thin space (1/6-em)]](https://www.rsc.org/images/entities/char_2009.gif) 2
2![[thin space (1/6-em)]](https://www.rsc.org/images/entities/char_2009.gif) :
:![[thin space (1/6-em)]](https://www.rsc.org/images/entities/char_2009.gif) 1 in N-methyl-2-pyrrolidone (NMP) solvent. The mixture was then uniformly coated onto a tantalum (Ta) current collector (20 × 20 mm, 10 μm in thickness), and dried at 80 °C over 12 h. The positive electrode, Al foil, and glass fiber (GF/A) separator were assembled with Al plastic film. AlCl3 and 1-ethyl-3-methylimidazalium chloride ([EMIm]Cl) were mixed in a molar ratio of 1.3
1 in N-methyl-2-pyrrolidone (NMP) solvent. The mixture was then uniformly coated onto a tantalum (Ta) current collector (20 × 20 mm, 10 μm in thickness), and dried at 80 °C over 12 h. The positive electrode, Al foil, and glass fiber (GF/A) separator were assembled with Al plastic film. AlCl3 and 1-ethyl-3-methylimidazalium chloride ([EMIm]Cl) were mixed in a molar ratio of 1.3![[thin space (1/6-em)]](https://www.rsc.org/images/entities/char_2009.gif) :
:![[thin space (1/6-em)]](https://www.rsc.org/images/entities/char_2009.gif) 1 as the electrolyte. The assembled soft-package cells were dried in the blast air oven at 80 °C and then injected with the as-prepared ionic liquid electrolyte in a high purity argon atmosphere glove-box.
1 as the electrolyte. The assembled soft-package cells were dried in the blast air oven at 80 °C and then injected with the as-prepared ionic liquid electrolyte in a high purity argon atmosphere glove-box.
2.4. Electrochemical measurements
Galvanostatic charge–discharge tests of the as-prepared electrolyzed materials were performed at various current densities using Neware BTS-53 tester. Cyclic voltammetry (CV) measurements were carried out with CHI electrochemical analyser (CHI 660E) in the voltage range of 0.3 to 2.4 V (vs. Al3+/Al).3. Results and discussion
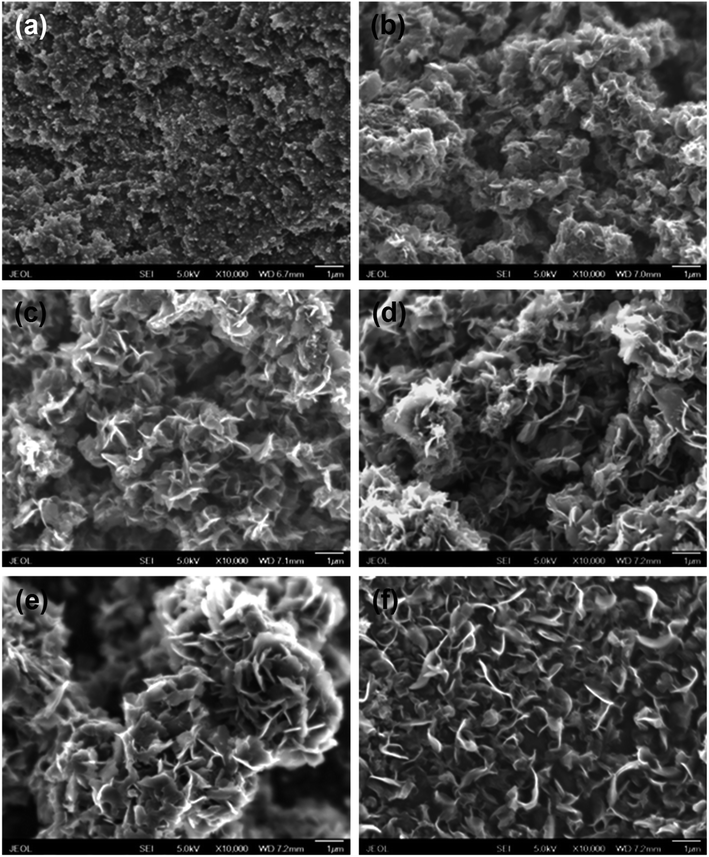
Carbon black pellets as cathode were electrolyzed through constant cell voltage electrolysis between 2.6 and 3.0 V at 800–850 °C. Fig. S1† is the representative current response when a cell voltage of 2.8 V at 850 °C was applied between the carbon black cathode and the SnO2 anode. The initial large current response features the double layer charging, which plummets to about 1.02 A in initial 5 min. The initial current decay can be attributed to the removal of the surface oxygen atoms of carbon black. Thereafter, the current firstly rises to about 1.34 A, then gradually decreases to around 1.23 A and levels off.Significant morphology and structure evolution of carbon black after the electrochemical graphitization under different conditions were observed by SEM, as shown in Fig. 1. The pristine carbon black consists of nanoparticles about 50–100 nm in size (Fig. 1(a)). After electrolysis under 2.6 V at 800 °C for 2 h (Fig. 1(b)), the product appears numerous nanoflakes. Meanwhile, with the increase of electrolysis cell voltage (Fig. 1(c)), it exhibits more distinct nanoflakes-like structure. Additionally, with the increase of electrolysis time (Fig. 1(d)–(f)), the products consist of more ultrathin nanoflakes. Based on our previous work, the thickness of single flake can decreases to about 12.7 nm when raising electrolysis temperature, cell voltage and time.17
XRD patterns of carbon black before and after cathodic electrolysis were then investigated to clarify the graphitization characteristics, as shown in Fig. 2(a). The characteristic peak of carbon black is around 24.76°, which is shifted to 26.19° after cathodic electrolysis under 2.8 V at 850 °C for 2 h. And, the (002) peak gradually shifts positively after electrolysis, suggesting that improving the electrolysis cell voltage and temperature, and prolonging electrolysis time are beneficial to the graphitization process. And the enlarged XRD patterns of all samples have been exhibited in Fig. S2.† It can be seen that some weak peaks are existent, which are assigned to these of graphite (JCPDS#89-7213), not impurities. Also, it can be found that the intensity of the peak at 44.5° represented to (101) lattice plane is increased with the increasing graphitization degree. Additionally, the elemental mapping of G2 sample was measured in Fig. S3.† According to the EDX element analysis (Fig. S3 and Table S2†), only C and O elements can be detected. Following the above results, it indicates that Ca and Li cations don't exist in the products. Moreover, based on the Bragg's Law, the interlayer spacing of G1–G5 samples under different electrolysis conditions has been calculated as 3.425, 3.423, 3.42, 2.41 and 3.4 Å, respectively. Furthermore, according to the Mering–Maire equation,18–20 the graphitization degrees of the products at different electrolysis conditions were calculated and shown in Fig. 2(b) and summarized in Table S1.† It can be found that the graphitization degree of carbon black is −103.804%, which signifies that there's basically non-graphitization. As the electrolysis cell voltage, electrolysis temperature and electrolysis time increase, the graphitization degree gradually increases. G1–G5 samples exhibit the graphitization degree of 16.165%, 19.477%, 23.084%, 35.057% and 46.067%, respectively.
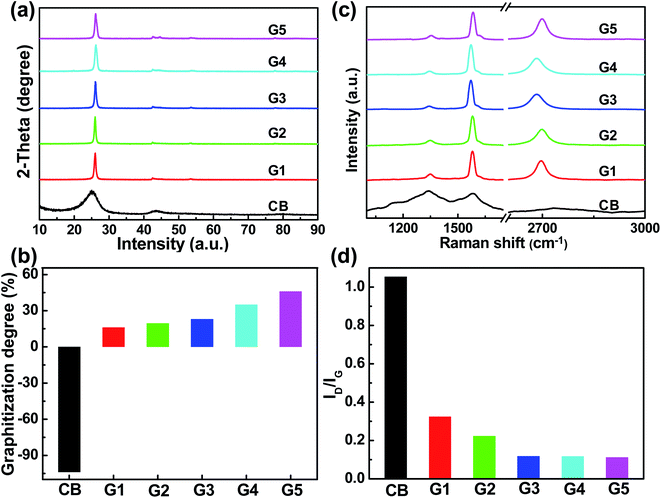 | ||
| Fig. 2 (a) XRD patterns, (b) graphitization degree, (c) Raman spectra, and (d) ID/IG of CB, G1, G2, G3, G4, and G5 samples. | ||
Fig. S4† displays the nitrogen adsorption–desorption isotherms and the corresponding pore size distribution (PSD) curves of the as-prepared graphite nanoflakes with the highest graphitization degree. It can be seen that the adsorption–desorption isotherms show the type IV and type I features with a H3 hysteresis loop, indicating the existence of mesoporous structure accompanied with a certain micropore. The relative pore size distribution displays the peak of 2.46 nm. Moreover, the Brunauer–Emmett–Teller (BET) surface area is measured as 165.7 m2 g−1, with the average pore diameter of 39.2 nm.
Raman spectra of carbon black before and after cathodic electrolysis under different electrolysis conditions were also investigated to clarify the graphitization characteristics, as displayed in Fig. 2(c). It can be seen that the pristine carbon black shows typical features of amorphous carbon with a higher-intensity D peak at about 1309 cm−1 and a lower-intensity G peak at about 1571 cm−1.21–23 After electrolysis, a weaker D peak and stronger G peak appears at about 1350 cm−1 and 1582 cm−1, respectively. The D peak is attributed to the disordered aromatic structure of sp3 bonded carbon, and the G peak is associated to the bond stretching of sp2 atoms of typical graphite.23–25 Notably, the 2D peak emerges at about 2700 cm−1, implying more graphitic crystallites and fewer defects of the electrolytic carbon. And the D/G peak intensity ratio (ID/IG) is known to be an indicator of the graphitization, where a smaller ID/IG ratio indicates a higher graphitization.26–28 Moreover, from Fig. 2(d) and Table S1,† it can be observed that ID/IG gradually decreases, signifying the ordered structure of carbon atoms and improved graphitization, which corresponds to the above results of XRD.
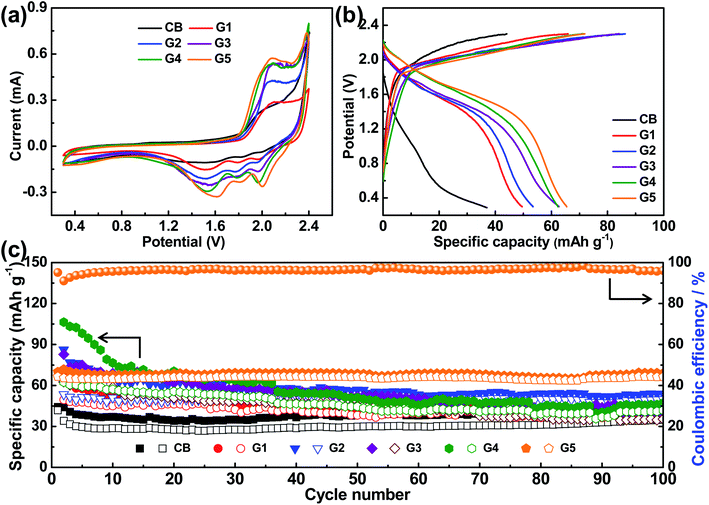
In order to identify the effect of graphitization degree of the as-electrolyzed products on the electrochemical performance for aluminum-ion batteries, CV measurements of G1–G5 electrodes were firstly carried out with a scan rate of 0.5 mV s−1, in the cut-off potential window from 0.3 V to 2.4 V (vs. Al3+/Al), as displayed in Fig. 3(a). For comparison, the carbon black was also measured as positive electrode. It can be observed that the CV curves of carbon black have no obvious redox peaks, signifying mainly capacitor behavior. On the other hand, the CV curves of the electrolyzed products display significant redox peaks. As the graphitization degree increases, the redox peaks become more obvious and the corresponding peak current grows higher. In particular, G5 electrode has shown the same electrochemical behaviors as the recent results of graphitic carbon as positive electrode for AIBs.29–32 It can be seen from the CV curve of G5 cathode that there are two oxidation/reduction peaks at 2.09 V/1.61 V vs. Al3+/Al and 2.33 V/2.01 V vs. Al3+/Al, which are resulted from the intercalation and deintercalation of AlCl4− anions. In addition, the above CV curves indicate that the graphite nanoflakes with the higher graphitization degree would effectively facilitate the entire electrochemical performance of AIBs based on highly graphitization feature and high-efficiency ionic transport capability.
Moreover, the charge–discharge behavior and cycling stability of the as-electrolyzed products were measured in the cut-off potential window of 0.3 to 2.3 V at a current density of 100 mA g−1, as exhibited in Fig. 3(b) and (c). It can be seen that there is no obvious charge/discharge potential plateaus featuring capacitive behavior for the CB electrode, which is consistent with the above CV results (Fig. 3(a)). As the graphitization degree increases, the charge plateaus shifts negatively and discharge plateaus shifts positively, indicating that the higher the graphitization degree, the weaker the polarization and the better the reversibility, and thus the higher the capacity. As displayed in Fig. 3(c), the initial discharge capacity of CB, G1, G2, G3, G4, and G5 is 41.7, 49.5, 53.4, 62.6, 62.3 and 66.5 mA h g−1, respectively. And the discharge capacity of CB finally keeps at 34.9 mA h g−1 with a very low coulombic efficiency of 76.1% over 100 cycles. G1–G4 presents a discharge capacity of 39.1, 49.8, 35.4, and 41.8 mA h g−1 over 100 cycles, respectively. It is worth noting that G5 eventually delivers a discharge capacity of 66.3 mA h g−1 after 100 cycles with a coulombic efficiency of 96.1% and capacity retention of 99.7%. Significantly, only the G5 electrode keeps a stable and high coulombic efficiency. The results indicate that the converted graphite nanoflakes with highest graphitization degree are comparable to other cathode materials (Table S3†). In addition, note that the change between the discharge capacity and graphitization degree is in the positive relationship.
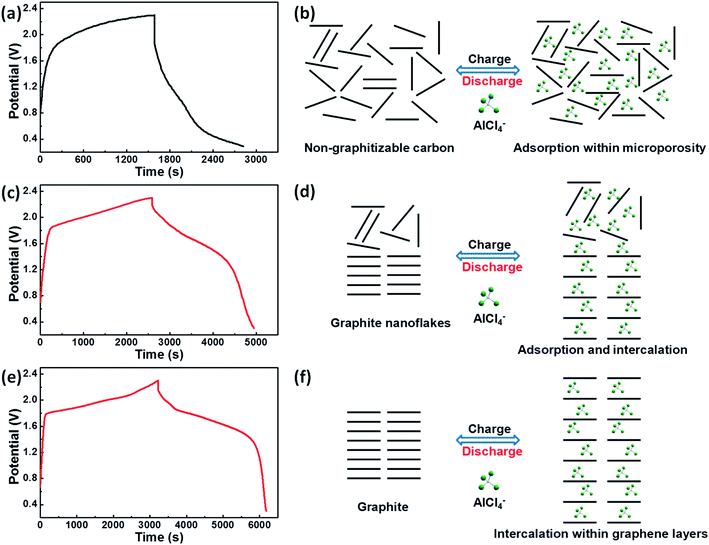
The reaction mechanism of non-graphitizable carbon and graphite nanoflakes with AlCl4− anions during the charge–discharge process can be summarized below, as shown in Fig. 4. Because the graphitization degree of the as-prepared graphite nanoflakes doesn't reach to 100%, the commercial flake graphite is selected to further illustrate the energy storage mechanism. When compared with the typical potential vs. time profiles of graphite nanoflakes and commercial flake graphite that display the conspicuous charge/discharge potential plateaus, the substantial energy penalty is apparently induced for non-graphitizable carbon. Actually, non-graphitizable carbon with the turbostratic disorder structure mainly exhibits capacitive behavior, related to the adsorption of AlCl4− anions in the micropores. By contrast, graphite with the ordered graphitic structure demonstrates the reversible battery behavior, which can be assigned to the intercalation of AlCl4− anions between the graphene layers.33–36 Moreover, for the as-prepared graphite nanoflakes, it can be deduced that AlCl4− anions can be reversibly adsorbed within microporosity and intercalated within graphene layers.
Therefore, CV curves of the as-prepared graphite nanoflakes at different scan rates from 0.2 to 1.0 mV s−1 were performed to quantify the contribution ratio of capacitive- and diffusion-controlled process based on the method proposed by Dunn and co-workers,37 as shown in Fig. S5a.† Eqn (1) can be utilized to plot ν1/2 vs. I/ν1/2 at different potentials, then one can calculate the k1 (slope) and k2 (intercept) (Fig. S5b†).
| I/ν1/2 = k1ν1/2 + k2 | (1) |
The current (I) can be quantified as k1ν (capacitive effect) and k2ν1/2 (diffusion-controlled process) at a given potential. Accordingly, the capacitive contribution of the G5 cathode can be quantified as 63.7% at a scan rate of 0.2 mV s−1, as shown in Fig. S5c† (shaded region, k1ν). The contribution ratios of the two processes at different scan rates were also determined, as presented in Fig. S5d.† With the increase of the scan rate, the capacitive contribution increases gradually, while the diffusion contribution is depressed as expected.
In addition, the charge–discharge behaviors and cycling stability of G5 positive electrode were further measured at 50 mA g−1 and 500 mA g−1. When charging/discharging at a current density of 50 mA g−1 (Fig. 5(a) and (b)), it is important to observe that the specific capacity can decrease for the first some cycles, then increase to a certain degree in the following cycles, and finally trend to be stable. The initial discharge capacity is 75.1 mA h g−1, and finally keeps at 65.8 mA h g−1 with a coulombic efficiency of 93.1% over 200 cycles. More importantly, when charging/discharging at a higher current density of 500 mA g−1 (Fig. 5(c) and (d) and S2†), the discharge capacity is 72.7 mA h g−1 in the first cycle, then gradually increases to 73.1 mA h g−1. Eventually, it holds at 49.1 mA h g−1 with a coulombic efficiency of 96.2% over 500 cycles. Note that the coulombic efficiency gradually increases during cycling, perhaps because AlCl4− anions can more easily diffuse into the graphite layers after the electrolyte has fully soaked through the cathodes over cycles.
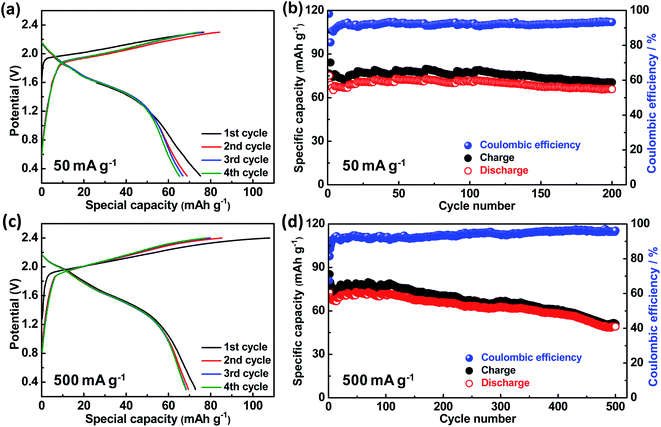 | ||
| Fig. 5 (a) and (c) The first four charge–discharge curves and (b) and (d) cycling stability of G5 electrode at a current density of 50 mA g−1 and 500 mA g−1. | ||
The results above clearly demonstrate that the graphite nanoflakes can be achieved by electrochemical transformation of non-graphitizable carbon materials by molten salt electrolysis and further apply to the high value-added positive electrode for Al-ion energy storage. It is of great significance to indicate that the higher the graphitization degree, the larger the charge/discharge capacity and the better the cycling stability. Importantly, the product exhibits more distinct redox peaks and higher discharge potential plateaus for aluminum-ion batteries with the increasing graphitization degree, which is beneficial for the enhanced energy storage property of batteries.
4. Conclusions
In summary, this work demonstrates that the capacity of the graphitic carbon as positive electrode for aluminum-ion batteries strongly depends on the graphitization degree. As the graphitization degree increases, the charge/discharge capacity accordingly increases. Furthermore, graphite nanoflakes show the typical intercalation/deintercalation behavior. It delivers an initial discharge capacity of 66.5 mA h g−1 at a current density of 100 mA g−1, eventually holds at 66.3 mA h g−1 after 100 cycles with a coulombic efficiency of 96.1% and capacity retention of 99.7%, exhibiting an ultra-stable cycling performance. It is also of great significance that the strategy is easy to extend to predict the discharge capacity of different kinds of graphites by determining the graphitization degree.Conflicts of interest
There are no conflicts of interest to declare.Acknowledgements
This work was supported by Fundamental Research Funds for the Central Universities (FRF-TP-18-003C2).References
- F. P. Bundy, W. A. Bassett, M. S. Weathers, R. J. Hemley, H. U. Mao and A. F. Goncharov, The pressure-temperature phase and transformation diagram for carbon; updated through 1994, Carbon, 1996, 34, 141–153 CrossRef CAS.
- E. A. Belenkov, Formation of graphite structure in carbon crystallites, Inorg. Mater., 2001, 37, 928–934 CrossRef CAS.
- C. G. Salzmann, B. J. Murray and J. J. Shephard, Diamond Relat. Mater., 2015, 59, 69–72 CrossRef CAS.
- K. Zaghib, K. Tatsumi, H. Abe, T. Ohsaki, Y. Sawada and S. Higuchi, J. Power Sources, 1995, 54, 435–439 CrossRef CAS.
- Y. Wen, K. He, Y. Zhu, F. Han, Y. Xu, I. Matsuda, Y. Ishii, J. Cumings and C. Wang, Nat. Commun., 2014, 5, 4033 CrossRef CAS PubMed.
- R. Raccichini, A. Varzi, S. Passerini and B. Scrosati, Nat. Mater., 2015, 14, 271–279 CrossRef CAS PubMed.
- S. Wang, K. V. Kravchyk, F. Krumeich and M. V. Kovalenko, ACS Appl. Mater. Interfaces, 2017, 9, 28478–28485 CrossRef CAS PubMed.
- R. E. Franklin, Proc. R. Soc. London, Ser. A, 1951, 209, 196–218 CrossRef CAS.
- J. Robertson, Curr. Opin. Solid State Mater. Sci., 1996, 1, 317–374 CrossRef.
- P. J. F. Harris, Int. Mater. Rev., 1997, 42, 206–218 CrossRef CAS.
- Y. Nishi, Chem. Rec., 2001, 1, 406–413 CrossRef CAS PubMed.
- M. Winter, B. Barnett and K. Xu, Chem. Rev., 2018, 118, 11433–11456 CrossRef CAS PubMed.
- I. Cameán, P. Lavela, J. L. Tirado and A. B. García, Fuel, 2010, 89, 986–991 CrossRef.
- C. L. Fan, H. He, K. H. Zhang and S. C. Han, Electrochim. Acta, 2012, 75, 311–315 CrossRef CAS.
- J. R. Dahn, T. Zheng, Y. Liu and J. S. Xue, Science, 1995, 270, 590–593 CrossRef CAS.
- M. Endo, C. Kim, K. Nishimura, T. Fujino and K. Miyashita, Carbon, 2000, 38, 183–197 CrossRef CAS.
- J. Tu, J. Wang, S. Li, W.-L. Song, M. Wang, H. Zhu and S. Jiao, Nanoscale, 2019, 11, 12537–12546 RSC.
- J. Maire and J. Mering, Chem. Phys. Carbon, 1970, 6, 125–189 CAS.
- F. R. Feret, Analyst, 1998, 123, 595–600 RSC.
- W. Feng, M. Qin, P. Lv, J. Li and Y. Feng, Carbon, 2014, 77, 1054–1064 CrossRef CAS.
- A. C. Ferrari and J. Robertson, Phys. Rev. B, 2000, 61, 14095–14107 CrossRef CAS.
- A. Kudelski, Chem. Phys. Lett., 2006, 427, 206–209 CrossRef CAS.
- A. C. Ferrari, Solid State Commun., 2007, 143, 47–57 CrossRef CAS.
- F. Tuinstra and J. L. Koenig, J. Chem. Phys., 1970, 53, 1126–1130 CrossRef CAS.
- S. Reich and C. Thomsen, Philos. Trans. R. Soc., A, 2004, 362, 2271–2288 CrossRef CAS PubMed.
- L. J. Hardwick, M. Hahn, P. Ruch, M. Holzapfel, W. Scheifele, H. Buqa, F. Krumeich, P. Novák and R. Kötz, Electrochim. Acta, 2006, 52, 675–680 CrossRef CAS.
- G. Yang, H. Han, T. Li and C. Du, Carbon, 2012, 50, 3753–3765 CrossRef CAS.
- Z. Chen, Y. Gu, L. Hu, W. Xiao, X. Mao, H. Zhu and D. Wang, J. Mater. Chem. A, 2017, 5, 20603–20607 RSC.
- H. Sun, W. Wang, Z. Yu, Y. Yuan, S. Wang and S. Jiao, Chem. Commun., 2015, 51, 11892–11895 RSC.
- S. Jiao, H. Lei, J. Tu, J. Zhu, J. Wang and X. Mao, Carbon, 2016, 109, 276–281 CrossRef CAS.
- P. Wang, H. Chen, N. Li, X. Zhang, S. Jiao, W.-L. Song and D. Fang, Energy Storage Mater., 2018, 13, 103–111 CrossRef.
- Q. Zhang, L. Wang, J. Wang, C. Xing, J. Ge, L. Fan, Z. Liu, X. Lu, M. Wu, X. Yu, H. Zhang and B. Lu, Energy Storage Mater., 2018, 15, 361–367 CrossRef.
- M. C. Lin, M. Gong, B. Lu, Y. Wu, D. Y. Wang, M. Guan, M. Angell, C. Chen, J. Yang, B. J. Hwang and H. Dai, Nature, 2015, 520, 325–328 CrossRef PubMed.
- S. Wang, K. V. Kravchyk, F. Krumeich and M. V. Kovalenko, ACS Appl. Mater. Interfaces, 2017, 9, 28478–28485 CrossRef CAS PubMed.
- L. Zhang, L. Chen, H. Luo, X. Zhou and Z. Liu, Adv. Energy Mater., 2017, 7, 1700034 CrossRef.
- H. Xu, T. Bai, H. Chen, F. Guo, J. Xi, T. Huang, S. Cai, X. Chu, J. Ling, W. Gao, Z. Xu and C. Gao, Energy Storage Mater., 2019, 17, 38–45 CrossRef.
- J. Wang, J. Polleux, J. Lim and B. Dunn, J. Phys. Chem. C, 2007, 111, 14925–14931 CrossRef CAS.
Footnote |
| † Electronic supplementary information (ESI) available. See DOI: 10.1039/c9ra07234a |
| This journal is © The Royal Society of Chemistry 2019 |

