 Open Access Article
The role of polysaccharides and proteins in bio-oil production during the hydrothermal liquefaction of algae species
Wenchao Yang a,
Zhaowei Wang
 b,
Jianbo Hana,
Shuang Songb,
Yong Zhangc and
Weimin Gong
 *b
*b
aKey Laboratory of Coastal Ecology and Environment of State Oceanic Administration, National Marine Environmental Monitoring Center, Linghe Road 42, Dalian 116023, China
bCollege of Environmental Science and Engineering, Dalian Maritime University, Linghai Road 1, Dalian 116026, China. E-mail: gongweimin315@163.com; Tel: +86-411-84723303
cDalian Marine Environmental Monitoring Center Station, State Oceanic Administration, Hutan Road 47A, Dalian 116015, China
First published on 17th December 2019
Abstract
In order to understand the effects of the major algal components-carbohydrates and proteins on the hydrothermal liquefaction (HTL) process of algae, the HTL of polysaccharides or proteins with lipids was performed at 220, 260, 300 °C, respectively. Bio-oil yields and qualities were investigated and compared with the individual liquefaction of the major algal components. Results show that the presence of polysaccharides or proteins has little effect on bio-oil yield but increased the HHV and significantly changed the boiling point distribution as compared with the HTL of lipids. The compositions of bio-oils from the HTL of binary mixtures were similar to that from the HTL of lipids. Heavy components in bio-oil were increased in the presence of polysaccharides or proteins, which was mainly caused by the hydrolysis product of polysaccharides/proteins being easily polymerized during the HTL process, forming macromolecular compounds into bio-oil.
1 Introduction
Algae are recognized as a potential biomass feedstock source for producing energy-dense fuels due to their unique characteristics such as high photosynthetic efficiency, fast growth rate, and no need for arable land.1–3 Among the various methods that convert algae into biofuels, hydrothermal liquefaction (HTL) is one of the most potential technologies for bio-oil production from algae.4 Algae mainly consist of carbohydrates, proteins and lipids. Lipids are the main component and provide quality assurance of bio-oil contribution.5 The type of algae has a significant effect on liquefaction reactions, resulting in the remarkable differences in the obtained bio-oil yield.6 In general, the higher the lipid content in algae, the higher the yield of bio-oil. However, the presence of carbohydrates and proteins in the algae liquefaction process leads to large changes in the bio-oil quality and yield. Since carbohydrates and proteins are inevitably present in algae, the contribution and influence on the liquefaction process cannot be ignored.Many researchers have focused on understanding the reaction pathways of the HTL technology of algae. Co-liquefaction of microalgae Spirulina and macroalgae Enteromorpha was investigated in subcritical water at 250–370 °C. The results indicated that a positive synergetic effect existed during the co-liquefaction, which significantly affected the relative amount of each component in the bio-oil.7 Fatty acids derived from Spirulina demonstrated a catalytic effect on the hydrolysis of protein and carbohydrates in the Enteromorpha, therefore promoting the conversion of algae. The biomass model component, instead of actual biomass, has been used to elucidate the biomass decomposition mechanisms under HTL conditions. Lipids in algae hydrolyzed rapidly into fatty acids and glycerol in near-critical or in supercritical water.8 In spite of the relatively high thermal stability, fatty acids can be partly degraded under hydrothermal conditions to produce long-chained hydrocarbons, which have excellent fuel properties. Glycerol is not converted into an oily phase during hydrothermal liquefaction, but rather into water-soluble compounds. The hydroxyl groups in long-chained fatty acids can react with ammonia from the deamination of amino acids from the hydrolysis of proteins to produce aliphatic amine compounds.9 Besides, a certain amount of long-chained fatty acids reacts with the alcohols, from the reduction of amino acids after deamination to produce esters. This reaction forms amides and other nitrogen-containing compounds and thus leads to the deterioration of the lipids in algae. The presence and effect of the Maillard reaction between glucose and glycine on the HTL process of algae have been proved by many studies.10 Biller and Ross11 investigated the liquefaction behavior of algae using a range of model biochemical components and actual algae. They found that the yields of bio-oil were obviously higher than the lipid content of the algae, and the contribution to bio-oil yield followed the trend of lipids > proteins > carbohydrates. Teri et al.12 found that the bio-oil yield exceeded the yield calculated from the pure compound results, indicating that the effects of the interactions among biomolecules on bio-oil formation really exist during the HTL of algae. Déniel et al.13 emphasized the representativeness of the model compounds selected and suggested that biomass biopolymers such as protein, cellulose, lignin and lipid should be used as model compounds to develop a prediction model instead of using their respective monomers (amino acid, glucose, fatty acid). They also observed the synergistic effect of the glucose and linoleic acid mixture on the bio-oil yield. A prediction model developed by Yang et al. for bio-oil and solid residue yields from the HTL of various biomass and model compounds14 found that interactions between cellulose and lipids had synergistic effects on the bio-oil yield during the HTL process. The contribution from each individual component in the biomass to the product distribution was also evaluated. The increase in the bio-oil yield at higher temperatures is attributed to the conversion of proteins and carbohydrates into low-polarity heterocyclic compounds via the Maillard reaction, amidation, esterification, and rearrangement reactions.15 Compounds derived from lipids are converted into the HTL organic phase by hydrolysis at lower temperatures.16 Pedersen and Rosendahl17 recommended that more research should be conducted to better understand the unsatisfactory predictability between model compounds and actual biomass. Leow et al.18 investigated the influence of variable microalgae biochemical compositions on the yields and characteristics of HTL products.
In general, previous studies were mainly focused on interactions between carbohydrates and proteins, the so-called Maillard reactions.19,20 The effects of interactions between carbohydrates/proteins and lipids on product yields and qualities during the HTL process have mostly been studied using the predictive model.14,21,22 However, the predictability was verified by using the model and actual feedstocks; the potential existing interactions between carbohydrates and lipids, proteins and lipids were still unclear. This study selected polysaccharides, proteins and lipids as model components of algae. The HTL process was conducted under different conditions, aiming to investigate the effect of interactions between carbohydrates and lipids, proteins and lipids on bio-oil yields and quality, respectively. The individual liquefaction of polysaccharides and proteins and the liquefaction of polysaccharide–protein mixtures were reported in our previous research and compared with this study with respect to bio-oil yield, elemental component, higher heating value (HHV), boiling point distribution, molecular component and functional group composition.23 The results could provide instructions for how to select algae species and regulate the liquefaction process conditions so as to lay the foundation for the mechanism of obtaining the target liquefied products.
2 Experimental and methods
2.1 Feedstock
Polysaccharides and proteins were purchased from Shanxi Pioneer Biotech Co. Ltd. The feedstock was milled to obtain a fine powder by passing through 40 mesh. The powder was dried at 100 °C for 24 h before use.Lipids can be rapidly hydrolyzed into fatty acids and glycerol in subcritical water environments. This research focused on investigating the possibility of further interactions between non-lipid components with fatty acids under subcritical water conditions. Therefore, oleic acid and glycerol, as hydrolysis products of lipids, were mixed in a molar ratio of 1![[thin space (1/6-em)]](https://www.rsc.org/images/entities/char_2009.gif) :
:![[thin space (1/6-em)]](https://www.rsc.org/images/entities/char_2009.gif) 3, representing a model lipid material in this study.
3, representing a model lipid material in this study.
2.2 Hydrothermal liquefaction
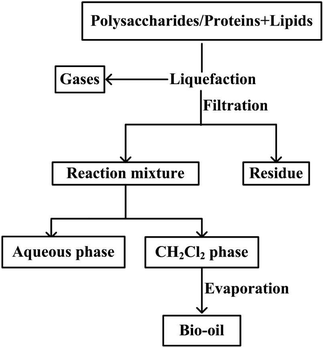
The hydrothermal processing of polysaccharides–lipids, proteins–lipids, and lipids was performed in stirred batch reactors. In a typical run, the reactor was charged with 5 g polysaccharides/proteins powder and 5 g oleic acid–glycerol mixtures, or 10 g oleic acid–glycerol mixtures, then 100 mL of deionized water was added to the reactor. The reactor was sealed and purged with nitrogen for 5 min. Then, the reaction was started by heating the reactor to a set temperature (220, 260, 300 °C) with a heating rate of approximately 15 °C min−1. The reactor was held at the final temperature for a period of 20 min. After reaching the desired residence time, the reactor was removed from the heat and then cooled to room temperature by quenching with a cold-water bath. The magnetic stirrer was stopped after cooling and the off-gas was vented into a fume hood. Experiments were carried out in duplicate. Average values were reported.Once the reactor was opened, the contents were poured into a beaker and the reactor was successively rinsed with 50 mL of deionized water and 50 mL of dichloromethane. The liquefaction mixture was filtered to remove the residue and subsequently combined in a separating funnel and allowed to separate. The DCM organic phase was separated and allowed to evaporate at 35 °C under reduced pressure to remove the solvent. The remaining liquid product was defined as bio-oil (Fig. 1).
2.3 Analysis of products
Elemental compositions of bio-oils were analyzed with a CHN elemental analyzer Flash 2000 with the uncertainties of <0.2% of the reported value, and the O content was calculated by the difference. HHV of bio-oils was calculated by the Dulong formula.24 Samples were analyzed in duplicate or triplicate, depending on the amount of sample available.The GC-MS analysis was carried out using an Agilent instrument equipped with an HP-5 column (30 m × 250 μm × 0.25 μm). The carrier gas was helium with a flow rate of 1.0 mL min−1. Following evaporation, a fraction of bio-oil was dissolved in methanol. The injector was set to the splitless mode. The injection temperature was 300 °C and the injection volume was 1 μL. The oven temperature was programmed to hold at 40 °C for 1 min and was then increased to 300 °C with a heating rate of 5 °C min−1. The main chemical compounds present in the bio-oil were identified using the National Institute of Standards and Technology (NIST) mass spectral library and the related literature. Computer matching was adopted to facilitate compound identification.
The boiling range of bio-oil was estimated using thermogravimetric analysis (TGA) which was performed in a nitrogen atmosphere, then 10 mg of the bio-oil was heated from 30 °C to 900 °C at a heating rate of 15 °C min−1 under nitrogen (20 mL min−1). The boiling curve was divided into the light fraction (<300 °C), the intermediate fraction (300–500 °C) and the heavy fraction (>550 °C).
3 Results and discussions
3.1 Bio-oil yield
The effect of polysaccharides on the HTL of algae was usually overlooked due to its tiny contribution to bio-oil yield. In order to systematically understand the effect of polysaccharides on the liquefaction process, the co-liquefaction process of the polysaccharides–lipids mixture was investigated. The resulting bio-oil yield is shown in Fig. 2(a), where the mixing ratio of polysaccharides and lipids is 1![[thin space (1/6-em)]](https://www.rsc.org/images/entities/char_2009.gif) :
:![[thin space (1/6-em)]](https://www.rsc.org/images/entities/char_2009.gif) 1. The test yield represents the yield from each run. Theoretical yield is calculated by the eqn (1), which assumes that the bio-oil yield is not affected by the mix or potential interactions between polysaccharides/proteins and lipids during the HTL process.11,23 Individual yields from lipids are also shown in Fig. 2 aiming to have a direct comparison with the interaction between carbohydrates and proteins with lipids.
1. The test yield represents the yield from each run. Theoretical yield is calculated by the eqn (1), which assumes that the bio-oil yield is not affected by the mix or potential interactions between polysaccharides/proteins and lipids during the HTL process.11,23 Individual yields from lipids are also shown in Fig. 2 aiming to have a direct comparison with the interaction between carbohydrates and proteins with lipids.
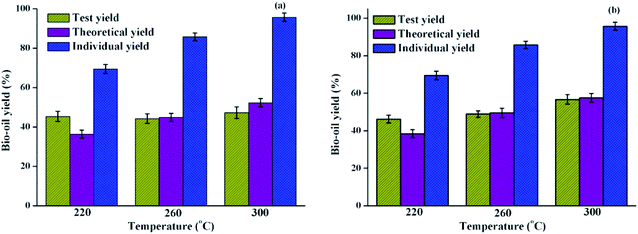 | ||
| Fig. 2 Bio-oil yield obtained from the HTL of (a) polysaccharides–lipids (b) proteins–lipids as compared with the HTL of lipids at different liquefaction temperatures. | ||
Compared with the trend that the theoretical yield of bio-oil gradually increases as the liquefaction temperature increases, the test yield does not change significantly with the increase of the liquefaction temperature. Compared with the bio-oil yield from individual liquefaction of polysaccharides/lipids, it was found that the large proportion of bio-oil yield obtained from the co-liquefaction of the polysaccharides–lipids mixture was contributed by lipids.25 It can be speculated that the introduction of polysaccharides may promote the formation of bio-oil products during the HTL process at 220 °C and cause the partial decomposition of bio-oil products when the liquefaction temperature is increased to 260 and 300 °C. This is probably due to the interaction between polysaccharides and lipids forming a solid residue, resulting in a decrease in the bio-oil yield. With the increase in liquefaction temperature, the interaction between polysaccharides and lipids during the HTL process had no obvious effect on the yield of bio-oil. In general, combined with the GC-MS analysis results, interactions between polysaccharides and lipids may not have existed or had no significant effect on the bio-oil yield.
As shown in Fig. 2(b), the effects of interactions between proteins and lipids on bio-oil yield were also examined by comparing the test yields and the theoretical yields used above. It was found that the test yield of the bio-oil and the theoretical yield have the same trend, and gradually increased as the liquefaction temperature increased. The difference between the two yields is significantly smaller than that of the polysaccharide–protein mixture liquefaction.23 However, there were differences in the results when the HTL process was performed at different temperatures. At 220 °C, the test yield was significantly higher than the theoretical yield, indicating that the potential interaction between proteins and lipids at this temperature is beneficial for increasing the bio-oil yield; however, there was no substantial difference between the theoretical yield and test yield of bio-oil at higher temperatures. This indicated that the interactions between proteins and lipids are limited by the liquefaction temperature. Changi26 systematically investigated the liquefaction process of the mixture of phenylalanine and ethyl oleate in the liquefaction of algae model compounds, which found that the addition of ethyl oleate promoted the conversion of phenylalanine. In addition, previous reports confirmed that fatty acid amides are the products of algae HTL processes,27,28 which are mainly formed from reactions between the amino acid degradation products of amines and lipid hydrolysis products of long-chain fatty acids. This reaction process, in turn, resulted in the change in a series of reaction rates associated with amines and fatty acids, which may have a certain effect on the final product distribution. The results were consistent with the co-liquefaction of microalgae and macroalgae, which could shift the decomposition temperature to a lower range as compared to their separate HTL process.7
| Theoretical yield (%) = polysaccharides/proteins yield% × polysaccharides/proteins content% + lipids yield% × lipids content% | (1) |
| Individual yield (%) = bio-oil yield from lipids% | (2) |
3.2 Elemental distribution of bio-oils
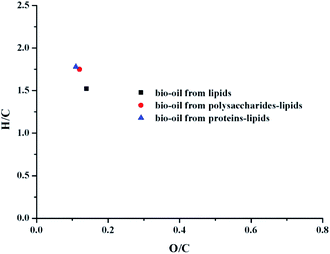
The elemental compositions (C, H, and N), H/C, O/C ratios, energy recovery rate, and the HHVs of bio-oil products from different conditions are presented in Table 1. van Krevelen diagrams are shown in Fig. 3. For the mixture liquefaction of polysaccharides–lipids, the H content was significantly higher as compared to the liquefaction of individual components, and the O content was lower as compared to the individual liquefaction. HHV improved significantly as compared to the individual liquefaction. Fig. 3 shows that the H/C ratio of the bio-oil obtained by the mixture liquefaction is higher than that of individual liquefaction, while the O/C ratio does not change significantly.| C (%) | H (%) | N (%) | O (%) | H/C | O/C | Energy recovery (%) | HHV (MJ kg−1) | |
|---|---|---|---|---|---|---|---|---|
| Lipids | 75.77 ± 0.83 | 9.61 ± 0.33 | 1.07 ± 0.05 | 13.55 ± 1.21 | 1.52 | 0.13 | 18.8 | 36.90 |
| Polysaccharides + lipids | 75.33 ± 0.55 | 11.05 ± 0.30 | 1.18 ± 0.09 | 12.44 ± 0.94 | 1.76 | 0.12 | 72.7 | 38.99 |
| Proteins + lipids | 74.83 ± 0.57 | 11.15 ± 0.29 | 3.44 ± 0.62 | 10.58 ± 1.48 | 1.79 | 0.11 | 73.3 | 39.29 |
Proteins–lipids liquefaction is similar to that of polysaccharides–lipids liquefaction.23 Compared with the results of individual liquefaction, the H content was significantly increased and the O content was decreased. The van Krevelen diagram in Fig. 3 shows that the H/C ratio of the bio-oil by mixture liquefaction of proteins–lipids is close to that of the bio-oil by mixture liquefaction of polysaccharides–lipids, which was higher than the results of individual liquefaction. It can be concluded that the mixture of proteins/polysaccharides and lipids is beneficial for the hydrogenation reaction, causing the HHV of the bio-oil to be obviously improved. Taken collectively, the hydrogenation process was enhanced by the presence of polysaccharides or proteins in algae during the HTL process. The results indicated that the presence of polysaccharides or proteins plays an important role in improving both the yield and qualities of bio-oil.
From the perspective of energy recovery (calculated by eqn (3)), mixture liquefaction could be more favorable to industrial production.29 The energy recovery rate from mixture liquefaction is much greater than individual liquefaction conditions. Assuming that the mutual interaction does not exist during mixture liquefaction, the energy recovery from the mixture liquefaction should be equal to the mean value (lipids + polysaccharides 14.9%; lipids + proteins 30.3%) of the individual liquefaction of the two major algal components (polysaccharides 11%, proteins 23%, lipids 18.8%). Therefore, interactions between the major components of algae during hydrothermal liquefaction play an important role in promoting the economics of the process.
 | (3) |
3.3 Bio-oil composition
The bio-oils obtained by the liquefaction of polysaccharides–lipids, proteins–lipids, and lipids were analyzed by GC-MS. The total ion chromatogram is shown in Fig. 4. The results for the bio-oil from the HTL of polysaccharides/proteins with lipids did not show the complex phenomenon obtained from the individual liquefaction of polysaccharides/proteins.25 On the contrary, the results were similar to those of the lipid liquefaction alone, and the products were relatively simple. The reason is partly that when polysaccharides or proteins with lipids are simultaneously presented in the algae in a considerable proportion, the contribution of the polysaccharides or proteins to the bio-oil in the low-boiling component is almost negligible. On the other hand, it can be inferred that the contribution of polysaccharides and proteins to bio-oil is mainly toward the composition of the higher boiling point, which is consistent with the relevant TG analysis results.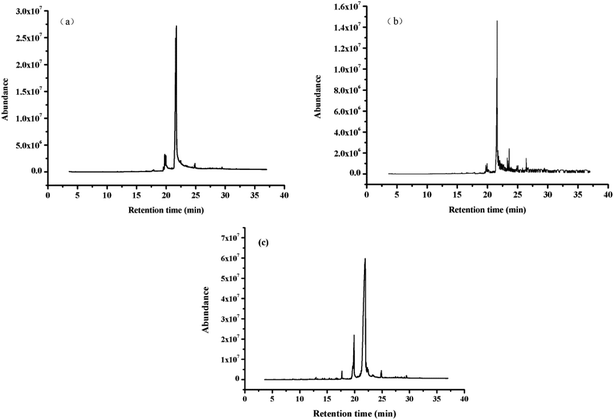 | ||
| Fig. 4 Total ion chromatogram of bio-oil obtained from HTL of (a) polysaccharides–lipids, (b) proteins–lipids, (c) lipids. | ||
Table 2 shows the results of GC-MS analysis of the bio-oil obtained by mixture liquefaction of polysaccharides–lipids. Compared with individual liquefaction results, bio-oil obtained by polysaccharides–lipids liquefaction, which was detected by GC-MS are only substances produced by lipid degradation such as fatty acids and esters (oleic acid, palmitic acid, ethyl palmitate and ethyl oleate). Major components of the bio-oil obtained from the HTL of polysaccharides such as ketones and phenols were not detected. Previous literature reported that carbohydrate-derived compounds are more likely to create aromatic compounds that are hard to upgrade.30 The bio-oil yield obtained from the HTL of polysaccharides is very low, which is almost negligible, especially when compared with the contribution of lipids. From this perspective, it is generally assumed that when the lipid content and polysaccharide content are equivalent in algae, bio-oil mainly contributed by lipids. On the other hand, compared with the results of lipid liquefaction, the introduction of polysaccharides significantly increases the content of esters in bio-oils, which is due to the degradation of polysaccharides producing intermediate product alcohols and then promoting esterification reactions between alcohols and linoleic acid/palmitic acid.
The GC-MS analysis results of bio-oil obtained from proteins–lipids liquefaction are shown in Table 3. Oleic acid and linoleic acid are components of hydrolysis products from lipids. Small amounts of esters are products of the combination of fatty acids and alcohols produced by the hydrolysis of lipids. The content of these substances accounted for about 90% of the bio-oil. In addition to the liquefaction products of lipids, a small amount of nitrogen-containing substances was detected, which were derived from the degradation of proteins. Overall, for the mixture liquefaction of proteins–lipids, the main component in bio-oil is still derived from the HTL of lipids, which is consistent with the results of the bio-oil yields obtained from individual liquefaction. Besides, the bio-oil also contains a small amount of oleic acid amides, which should be the reaction product of ammonium salt produced from protein degradation and oleic acid. Amides were the main product of the interaction between proteins and lipids in the HTL of algae.
The FT-IR spectra of the bio-oils obtained from the HTL of binary mixtures of polysaccharides/proteins and lipids are compared in Fig. 5. C–H vibrations at 2820 cm−1 and 2920 cm−1 and a C![[double bond, length as m-dash]](https://www.rsc.org/images/entities/char_e001.gif) O stretching vibration at 1710 cm−1 indicate the presence of oxygenated compounds.31 The band at 1410 cm−1 represents the stretching vibrations of C–C bonds in aromatic rings. The band at 1220 cm−1 is related to the vibration peak corresponding to C–O–C in esters. The band at 1100 cm−1 corresponds to the long-chain saturated aliphatic hydrocarbons. Overall, the obvious difference between the components of bio-oil obtained from HTL of polysaccharides–lipids/proteins–lipids mixtures and from HTL of lipids could not be found from FT-IR analysis.
O stretching vibration at 1710 cm−1 indicate the presence of oxygenated compounds.31 The band at 1410 cm−1 represents the stretching vibrations of C–C bonds in aromatic rings. The band at 1220 cm−1 is related to the vibration peak corresponding to C–O–C in esters. The band at 1100 cm−1 corresponds to the long-chain saturated aliphatic hydrocarbons. Overall, the obvious difference between the components of bio-oil obtained from HTL of polysaccharides–lipids/proteins–lipids mixtures and from HTL of lipids could not be found from FT-IR analysis.
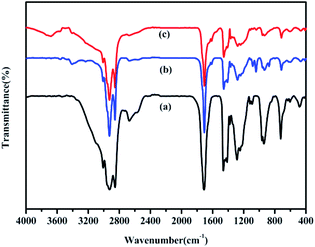 | ||
| Fig. 5 FT-IR spectra of bio-oils from HTL of (a) lipids; (b) polysaccharides–lipids; (c) proteins–lipids. | ||
3.4 Boiling point distribution of bio-oils
TG analysis in the previous reports showed that the TG curves of the bio-oils obtained by the liquefaction of polysaccharides and proteins were significantly different from those of lipids.2 This could also indicate that the boiling range of the bio-oil obtained by the HTL of lipids is significantly different from that of bio-oils from HTL of polysaccharides and proteins. Therefore, in the binary mixture liquefaction, the effect of polysaccharides or proteins on the boiling range of the bio-oil obtained by lipid liquefaction was investigated by TG analysis. The result is shown in Fig. 6. In this article, the weight loss portion of bio-oil at <300 °C is defined as a light component, while the bio-oil component lost between 300-550 °C is called a medium-mass component, and the bio-oil group lost above 550 °C is classified as a heavy component. The estimated boiling range distribution is shown in Table 4.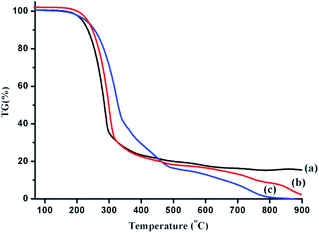 | ||
| Fig. 6 TG analysis of bio-oils obtained from HTL of lipids (a), polysaccharides–lipids (b) and proteins–lipids (c). | ||
| Distillate range (°C) | |||
|---|---|---|---|
| <300 | 300–550 | >550 | |
| Lipids | 64.8 | 16.1 | 19.1 |
| Polysaccharides–lipids | 47.6 | 35.0 | 17.4 |
| Proteins–lipids | 29.1 | 56.0 | 14.9 |
Compared with the results of lipid liquefaction, the proportion of the light component was significantly decreased when polysaccharides or proteins were present, and the content of the medium quality component was remarkably improved. In addition, the obtained bio-oil was free of residual substances at temperatures above 900 °C when introducing polysaccharides or proteins, which indicated that the interaction between major components of algae is beneficial for controlling the coking process in the formation of bio-oil. The bio-oil yield obtained from HTL of polysaccharides and proteins was very low as compared with lipids, and the results of GC-MS analysis showed that the effect of polysaccharides or proteins with lipids on the composition of low-boiling substances in bio-oil was relatively small. However, TG analysis indicated that the change in the boiling range of bio-oil from lipids with polysaccharides and proteins cannot be ignored.
3.5 Potential effects of interactions between polysaccharides/proteins and lipids
Previous studies have found that carbohydrates mainly formed solid residues and water-soluble organics during the HTL process. Lipids are the major contributor to the bio-oil. The correlation of proteins with bio-oil yield is not clearly defined. Interactions between lipids and proteins to form amides were caused by the chemical reactions between fatty acids from lipids and nitrogen-containing compounds from proteins. The mechanism of interaction between polysaccharides and lipids was not clear. In future studies, the ash content needs to be considered as one of the key factors affecting the product yield, and the effect of operating parameters such as the ratios of major algal components should be investigated to gain further deep insight into the HTL process.4 Conclusions
HTL of polysaccharides–lipids and proteins–lipids was performed at 220–300 °C. The effects of interactions between polysaccharides/proteins and lipids on bio-oil yields and qualities were investigated and compared with the HTL of polysaccharides, proteins, lipids and binary mixture of polysaccharides and proteins. Interactions between polysaccharides/proteins and lipids had little effect on the bio-oil yield but were beneficial to the HHV of bio-oil (HHV that was 36.9 MJ kg−1 obtained from lipid liquefaction increased to 39.0 MJ kg−1 and 39.3 MJ kg−1 in the case of polysaccharides–lipids liquefaction and proteins–lipids liquefaction). GC-MS of bio-oil obtained from HTL of polysaccharides–lipids, proteins–lipids only detected substances produced by lipid degradation such as fatty acids and esters. The contributions of polysaccharides and proteins to bio-oil composition were mainly in the medium-mass component (which was 16.1% from lipid liquefaction, increasing to 35% and 56% in the case of polysaccharides–lipids liquefaction and proteins–lipids liquefaction). Therefore, the boiling range of bio-oils was significantly changed by polysaccharides/proteins. The combination of polysaccharides/proteins and lipids has a negative effect on the viscosity of bio-oil.Conflicts of interest
There are no conflicts to declare.Acknowledgements
This work was supported by the National Natural Science Foundation of China (41806128) and Natural Science Foundation of Liaoning Province (2019-MS-135).References
- A. Galadima and O. Muraza, Renewable Sustainable Energy Rev., 2018, 81, 1037–1048 CrossRef CAS.
- C. Jazrawi, PhD thesis, University of Sydney, 2014.
- N. Neveux, A. K. Yuen, C. Jazrawi, M. Magnusson, B. S. Haynes, A. F. Masters, A. Montoya, N. A. Paul, T. Maschmeyer and R. de Nys, Bioresour. Technol., 2014, 155(2), 334–341 CrossRef CAS PubMed.
- G. Teri, L. Luo and P. E. Savage, Energy Fuels, 2014, 28(12), 7501–7509 CrossRef CAS.
- Y. Zhu, K. O. Albrecht, D. C. Elliott, R. T. Hallen and S. B. Jones, Algal Res., 2013, 2, 455–464 CrossRef.
- A. Dimitriadis and S. Bezergianni, Renewable Sustainable Energy Rev., 2017, 68, 113–125 CrossRef CAS.
- A. Jin, P. Duan, Y. Xu, F. Wang and Y. Fan, Bioresour. Technol., 2013, 149, 103–110 CrossRef PubMed.
- M. Sasaki, B. Kabyemela, R. Malaluan, H. Satoshi, T. Naoko, A. Tadafumi and A. Kunio, J. Supercrit. Fluids, 1998, 13(1–3), 261–268 CrossRef CAS.
- S. Chiaberge, I. Leonardis, T. Fiorani, G. Bianchi, P. Cesti, A. Bosetti, M. Crucianelli, S. Reale and F. De Angelis, Energy Fuels, 2013, 27, 5287–5297 CrossRef CAS.
- A. Peterson, R. P. Lachance and J. W. Tester, Ind. Eng. Chem. Res., 2010, 49, 2107–2117 CrossRef CAS.
- P. Biller and A. B. Ross, Bioresour. Technol., 2011, 102, 215–225 CrossRef CAS PubMed.
- G. Teri, L. G. Luo and P. E. Savage, Energy Fuels, 2014, 28(12), 7501–7509 CrossRef CAS.
- M. Déniel, G. Haarlemmer, A. Roubaud, E. Weiss-Hortala and J. Fages, Sustainable Energy Fuels, 2017, 1, 555–582 RSC.
- J. Yang, Q. He, H. Niu, K. Corscadden and T. Astatkie, Appl. Energy, 2018, 228, 1618–1628 CrossRef CAS.
- F. Cheng, Z. Cui, K. Mallick, N. Nirmalakhandan and C. E. Brewer, Bioresour. Technol., 2018, 258, 158–167 CrossRef CAS PubMed.
- N. Sudasinghe, H. Reddy, N. Csakan, S. Deng, P. Lammers and T. Schaub, BioEnergy Res., 2015, 8(4), 1962–1972 CrossRef CAS.
- T. H. Pedersen and L. A. Rosendahl, Biomass Bioenergy, 2015, 83, 206–215 CrossRef CAS.
- S. Leow, J. R. Witter, D. R. Vardon, B. K. Sharma, J. S. Guest and T. J. Strathmann, Green Chem., 2015, 17, 3584–3599 RSC.
- X. Wu, J. Liang, Y. Wu, H. Hu, S. Huang and K. Wu, RSC Adv., 2017, 7, 13768–13776 RSC.
- A. Zhang, X. Tang, L. Sheng and X. Yang, Green Chem., 2016, 18, 2542–2553 RSC.
- L. Sheng, X. Wang and X. Yang, Bioresour. Technol., 2018, 247, 14–20 CrossRef CAS PubMed.
- J. D. Sheehan and P. E. Savage, Bioresour. Technol., 2017, 239, 144–150 CrossRef CAS PubMed.
- W. C Yang, X. G. Li, Z. H. Li, C. H. Tong and L. J. Feng, Bioresour. Technol., 2015, 196, 99–108 CrossRef PubMed.
- R. A. Corbitt, Standard Handbook of Environmental Engineering, McGraw-Hill, New York, 1989 Search PubMed.
- W. C. Yang, X. G. Li, S. S. Liu and L. J. Feng, Energy Convers. Manage., 2014, 87, 938–945 CrossRef CAS.
- S. Changi, M. Zhu and P. E. Savage, ChemSusChem, 2012, 5(9), 1743–1757 CAS.
- T. M. Brown, P. Duan and P. E. Savage, Energy Fuels, 2010, 24(6), 3639–3646 CrossRef CAS.
- P. J. Valdez, J. G. Dickinson and P. E. Savage, Energy Fuels, 2011, 25(7), 3235–3243 CrossRef CAS.
- J. Ramirez, R. Brown and T. Rainey, Energies, 2015, 8(7), 6765–6794 CrossRef CAS.
- F. Cheng, Z. Cui, L. Chen, J. Jarvis, N. Paz, T. Schaub, N. Nirmalakhandan and C. E. Brewer, Appl. Energy, 2017, 206, 278–292 CrossRef CAS.
- S. P. Zou, Y. L. Wu, M. D. Yang, C. Li and J. M. Tong, Energy Fuels, 2009, 23, 3753–3758 CrossRef CAS.
| This journal is © The Royal Society of Chemistry 2019 |

