
 Open Access Article
 This Open Access Article is licensed under a Creative Commons Attribution-Non Commercial 3.0 Unported Licence
Luminescent properties of a new cyan long afterglow phosphor CaSnO3:Lu3+
ChangRan Zheng and
QuanSheng Liu*
and
QuanSheng Liu*
School of Materials Science and Engineering, Changchun University of Science and Technology, Changchun 130022, Jilin, China. E-mail: liuqs@cust.edu.cn
First published on 18th October 2019
Abstract
Persistent luminescence (PPL) materials have gained lots of attention and have been widely used in traffic signs, displays, medical diagnosis and architectural decoration. Single ion doped PPL materials with stable emission are excellent for practical applications, but it is difficult to cover the entire wavelength range. Here, a new cyan long-lasting phosphor CaSnO3:Lu3+ was successfully synthesized at 1200 °C by the conventional high temperature solid state method. From the X-ray photoelectron spectroscopy (XPS), it can be concluded that the Sn2+ ions exist in the crystal lattice because the doping of Lu3+ ions changes the valence state of the Sn ions. According to the thermally simulated luminescence (TSL), the continuous afterglow of CaSnO3:Lu3+ phosphors is produced by appropriate hole or electron traps, which are caused by doping the calcium stannate host with rare earth ions (Lu3+). The long-lasting phosphorescence (LLP) properties of the cyan phosphor were first discussed and the afterglow mechanism was expounded in detail. The excitation and the emission spectra of the phosphor revealed the characteristic broad peak of the Sn2+ ion. Typical afterglow behavior of the CaSnO3:Lu3+ phosphors was exhibited after power was turned off.
1. Introduction
Long afterglow material is a phosphorescent material that can produce visible light for a few seconds or even hours. Due to its unique luminescence properties, it has been made into a series of products, such as luminescent coatings, ceramics, plastics, films, fibers, etc.2,3 Currently, more and more reported excellent luminous properties gradually make cyan long afterglow materials meet the requirements of use and are widely used in various fields such as display and energy conversion.Life and luminous intensity are long-term problems in the study of long afterglow materials. The macroscopic factors affecting these two luminescent properties include the type and content of alkaline earth elements, the type and content of rare earth doping elements, and preparation methods. The experiment adopts high temperature solid phase method, the method is simple, the obtained product has stable performance and good luminescence performance. Unlike ordinary photoluminescent phosphors, long-lasting phosphors (LLP) materials absorb visible light or ultraviolet light, etc., and then store these energies in the crystal lattice and release the stored energy in the form of continuous visible light.4 Energy efficiency is high.
Since the discovery of SrAl2O4:Eu2+,Dy3+ (ref. 5) in 1996, the development of long afterglow (LAG) phosphors was rapid over the past years. A large number of outstanding LAG phosphors have gained considerable commercial value and have been applied on the various market, including SrAl2O4:Eu2+,Dy3+ (green), CaAl2O4:Eu2+,Nd3+ (blue) and Y2O3:Eu3+,Ti4+,Mg2+ (red).6–8 However, the existing LAG phosphors still face many shortcomings, such as easily deliquescent of aluminates and poor chemical stability of sulfides. Therefore, the materials industry needs to constantly find new substrates that can be used for LAG phosphors. Among the persistent phosphors, cyan phosphors with good LLP properties are rare, far from meeting the needs of market applications. Therefore, it's necessary to create a new cyan long-lasting phosphor to satisfy the growing demand for LLP materials.
Lately, alkaline earth thin oxides (MSnO3, M = Sr, Ca, Ba) have attracted lots of concentration in the last years because SnO42− anion group is an advantageous candidate for host materials. The CaSnO3 is more attractive and potent than sulfide as the results of its stable physical and chemical properties, environmental friendliness, simple synthesis process and low cost. Thence, in many cases it's a good choice to use the alkaline earth thin oxides as the matrix for LAG phosphors, such as CaSnO3:Sm3+,9 CaSnO3:Tb3+,10 CaSnO3:Eu3+,11 Ca2SnO4:Dy3+,12 Ca2SnO4:Er3+ (ref. 13) phosphors.
Among the rare earth elements, Lu3+ can be used not only as activated ions for upconversion luminescence and ultraviolet emission materials,14 but also as auxiliary ions, which are served as trap centers to improve LAG performance.15 As far as existing reports are concerned, there is no report on the phenomenon of Lu3+ ions as trap providers. Therefore, it is necessary to do a lot of work to clarify the afterglow characteristics and photoluminescence behavior of CaSnO3:Lu3+ phosphors.
In the research, CaSnO3:Lu3+ phosphors were well synthesized. The afterglow behaviors and the luminescence performance of the CaSnO3:Lu3+ phosphor were illustrated at length and the mechanism of the long-lasting afterglow of the phosphor was discussed.
2. Experimental
Ca1−xSnO3:x% Lu3+ (x = 0, 0.5, 1, 2, 3, 4, 5) were synthesized by the solid state reaction with SnO2 (A.R.), Lu2O3 (A.R.) and CaCO3 (A.R.) as raw materials. First, the standard stoichiometric starting materials were uniformly mixed and thoroughly ground in an agate mortar with appropriate ethanol addition for about 30 min.The resulting material was then compressed into tablets to enhance the synthesis process. The above tablets were required to be compressed into a disc having a diameter of 20 mm and a length of 4 mm (weight 3 g). After holding 1200 °C for 4 hours, the tablets were taken out and ground to obtain the new cyan phosphors.
The excitation and emission spectra were measured by the FLS920 photoluminescence spectrometer to study the luminescence performance of the phosphor. We studied the phase purity of the prepared phosphor samples by TD-3500 X-ray diffractometer (Cu Kα, 40 kV and 30 mA). The scanning speed of this process was 0.04, and the range of 2θ was between 10° and 70°. The valence state of the Sn ion is characterized by the X-ray photoelectron spectroscopy (Kratos Axis Ultra DLD) having Al Kα radiation. The sample was irradiated with ultraviolet light having a wavelength of 254 nm for 10 minutes, and then the afterglow attenuation curve of the phosphor was measured using FJ427-Al. The TL curve was measured using a FJ427-A1 thermal stimulation spectrometer (Beijing Nuclear Instrument Factory) at a heating rate of 1 K s−1 and a temperature range of 20 °C to 275 °C. All measurements except the TL curve were performed at room temperature standards.
3. Results and discussion
3.1 Phase determination
The phosphor samples were prepared by traditional solid state reaction, with a nominal composition of Ca1−xSnO3:x% Lu3+ (x = 0, 0.5, 1, 2, 3, 4, 5). These phosphors that contained different Lu concentrations were subjected to X-ray diffraction to obtain an XRD pattern as shown in Fig. 1. The figures lead us to the result that although the Lu concentration varies greatly from 0 to 5%, all samples show the same diffraction pattern. Obviously, all diffraction peaks are in good agreement with the standard of CaSnO3 (JCPDS standard card no. 031-0312), which indicates that it has a perovskite crystal structure with lattice parameters a = 5.532 Å, b = 5.681 Å, and c = 7.906 Å. The phenomenon illustrates that a bit of Lu3+ ions have no significant effects on the crystal structure and forms a fine solid solution.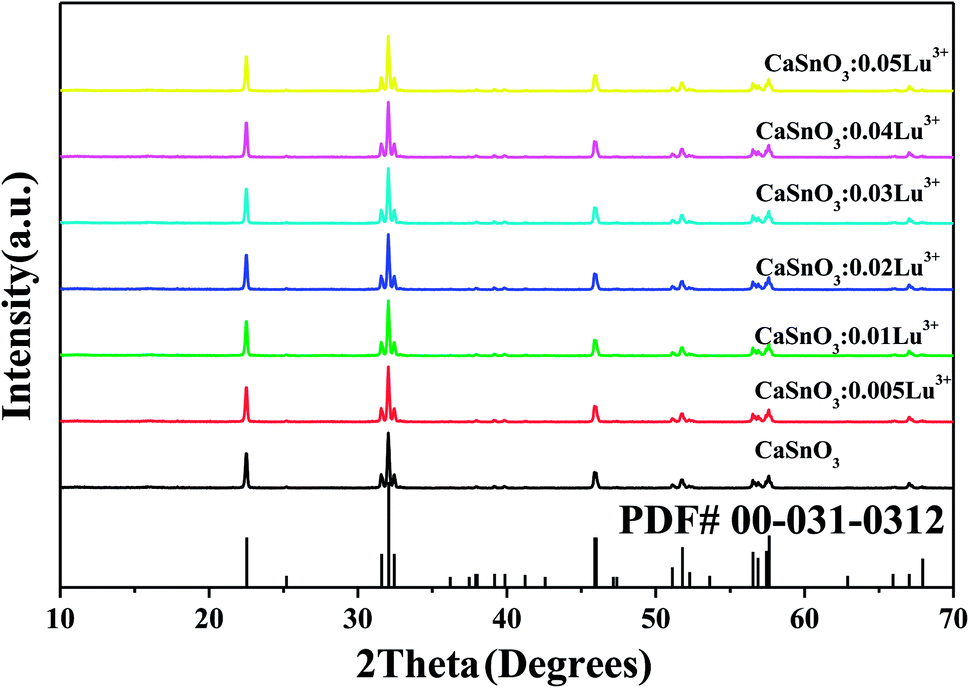 | ||
| Fig. 1 XRD pattern of the CaSnO3:Lu3+ powders with different Lu concentrations. | ||
3.2 Photoluminescent properties
To eliminate the influence of inherent defects that may exist in CaSnO3 phosphors. CaSnO3 phosphors without Lu3+ were prepared, and related experiments were carried out on the phosphors. After excitation by the UV source, it was observed that the phosphor did not have photoluminescence or afterglow emission. Therefore, we have a reason to believe that the main role of the experiment is due to the doping of Lu3+ ions in CaSnO3. The peak intensities, which usually correspond to trap concentration, increase until x = 2.0 mol%, when it reaches the strongest.1 Fig. 2 shows the excitation and emission spectra of CaSnO3:2 mol% Lu3+ phosphor. The excitation spectrum of the CaSnO3:Lu3+ phosphor was observed at the emission wavelength of the Sn2+ center (496 nm), which showed a relatively wide band. This is due to the singlet transition of the Sn2+ center (S0 → S1) with a maximum wavelength of 267 nm.16 After UV excitation, the Sn2+ ions transition from the triplet state to the singlet state (T1 → S0), and the phosphor emits visible light in a wide emission band of 496 nm, as mentioned in other literature.17 As shown in the inset of Fig. 2, the emission intensity first increases, reaches a maximum peak at the Lu3+ concentration of 2 mol%, and then gradually decreases as the Lu3+ concentration increases. Therefore, it can be safely said that the optimum doping concentration of Lu3+ is 2 mol%. At the same time, owing to the doping of Lu3+ ions, Sn2+ ions exist in the crystal lattice of CaSnO3.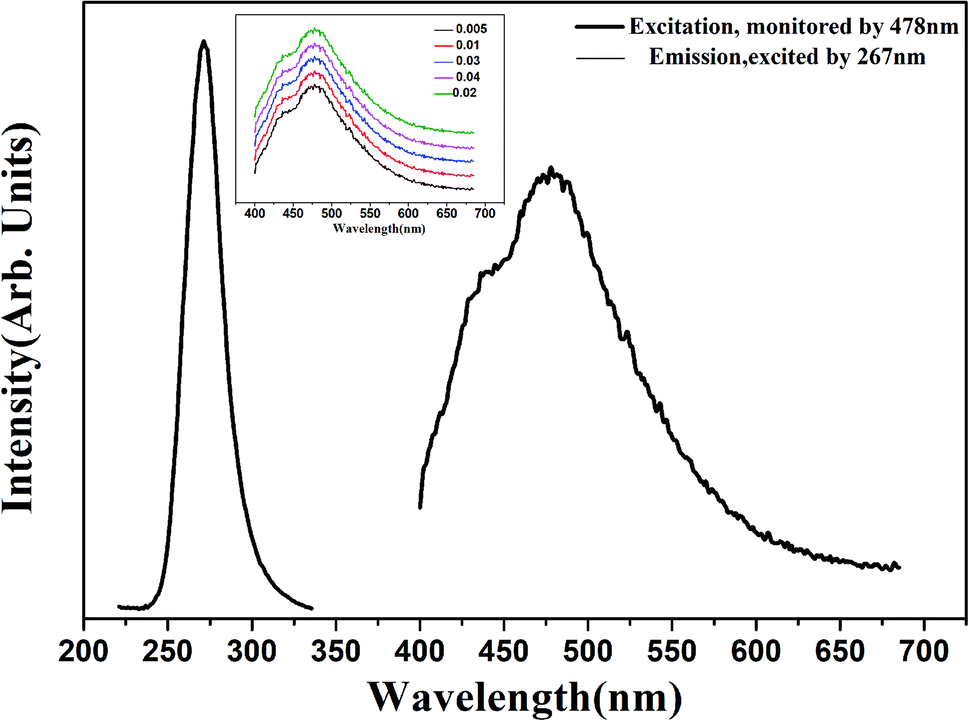 | ||
| Fig. 2 Excitation and emission spectra of CaSnO3:2 mol% Lu3+ phosphor, the inset shows emission spectra of CaSnO3:x% Lu3+ (x = 0.01, 0.02, 0.03, 0.04, 0.05) phosphors. | ||
The CIE 1931 diagram achieves the representation of all colors by continuously combining the three primary colors. The method can be used to quantify the tunability of the emission wavelength and the change in the intensity of the emission band. First, the emission spectrum of the prepared CaSnO3:2 mol% Lu3+ phosphor was converted into the CIE 1931 diagram to calculate x, y chromaticity coordinates. The x, y chromaticity coordinates obtained by the process are shown in the image in Fig. 3. The value of the chromaticity coordinates (x, y) is calculated to be (0.2131, 0.2643), and the precise emission color of the phosphor can be determined by the coordinates. In the experiment, the x, y chromaticity coordinates of the prepared CaSnO3:2 mol% Lu3+ phosphor were located in the cyan region, demonstrating the successful synthesis of a new cyan phosphor in this study.
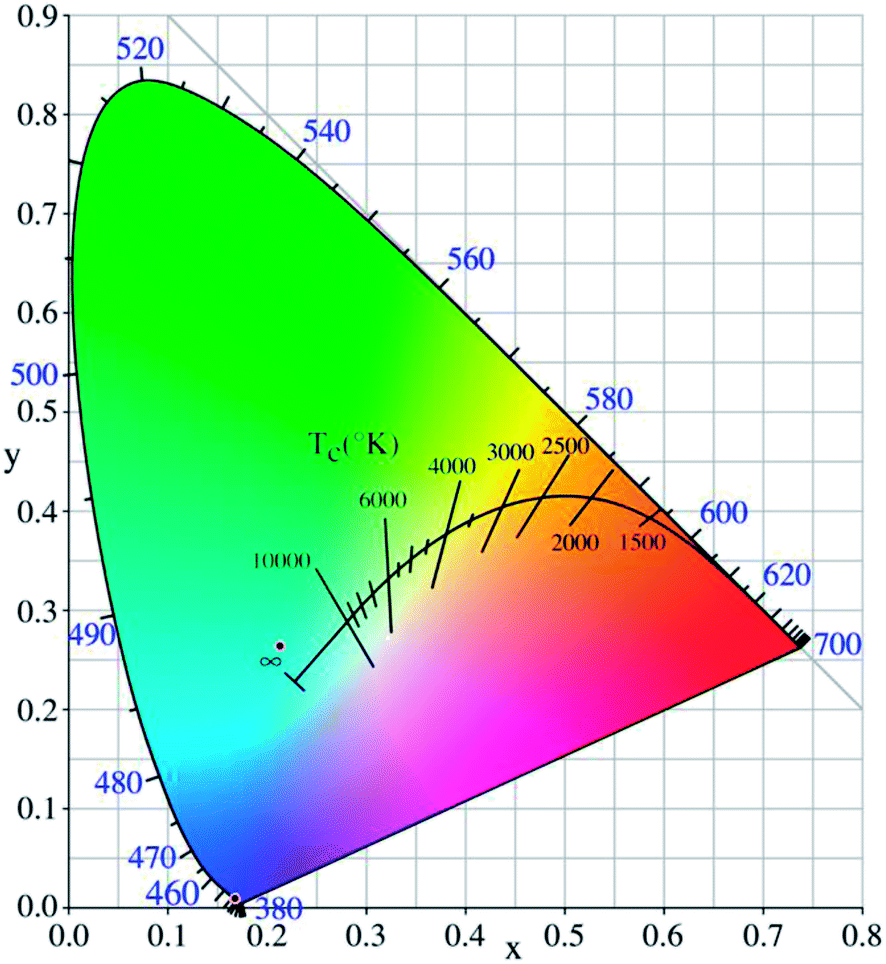 | ||
| Fig. 3 The CIE 1931 chromaticity coordinates of the CaSnO3:2 mol% Lu3+ phosphors. | ||
XPS studies were performed to further confirm the presence of Sn2+ in the CaSnO3:Lu3+ phosphor lattice. The results of XPS are shown in Fig. 4(a). From the image we can analyze that the curve of CaSnO3:Lu3+ phosphor is offset from the CaSnO3 phosphor. The phenomenon of a slight change in crystal binding energy indicates the presence of divalent tin ions, which may be caused by changes in the valence state of tin ions due to the incorporation of a small amount of Lu3+ ions into the crystal lattice. A detailed study of the Sn 3d5/2 XPS peak recorded for CaSnO3:Lu3+ phosphor is shown in Fig. 4(b). Usually doing this, it is unwrapped into two components, Sn2+ and Sn4+. The registered Sn 3d5/2 peak is flooded as a point, and the deconvolved component is submerged as a solid line. The Sn 3d5/2 binding energy obtained, the full width at half maximum, and the relative areas of each Sn component are listed in Table 1. The main focus of this paper is the relative content of the Sn species, which reveal their respective peaks and relative area. As shown in the experiment, the data indicates that the CaSnO3:Lu3+ phosphor contains most of the tin in the tetravalent state (99.44%). A small amount of divalent Sn ions are present in the phosphor lattice, which may be due to the doping of Lu3+ into the crystal lattice. Therefore, the XPS data supports the presence of Sn2+ that is responsible for the PL spectrum (Fig. 2).
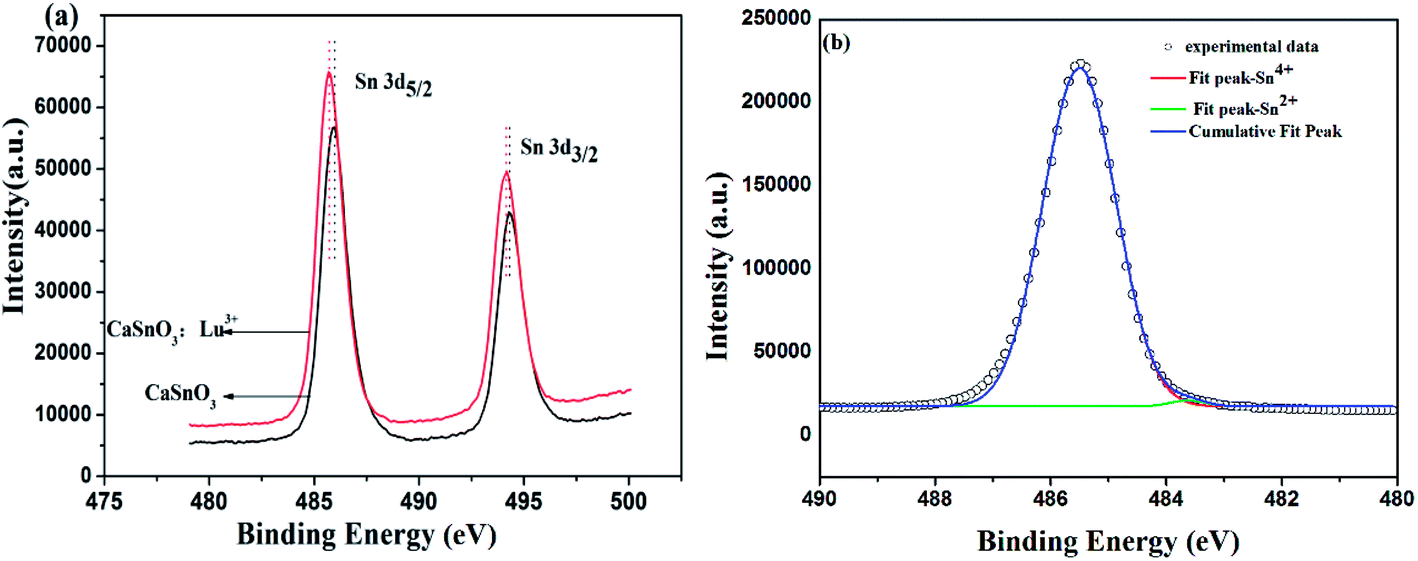 | ||
| Fig. 4 XPS spectra of the samples CaSnO3 and CaSnO3:Lu3+ (a) and registered Sn 3d5/2 XPS peak and spectral deconvolution into different valence states for the CaSnO3:Lu3+ phosphor (b). | ||
| Component | Sn 3d5/2 | ||
|---|---|---|---|
| BE/eV | FWHM/eV | Relative area/% | |
| Sn2+ | 483.62 | 0.72 | 56 |
| Sn4+ | 485.49 | 1.49 | 99.44 |
3.3 Long afterglow properties
The prepared CaSnO3:2 mol% Lu3+ phosphor was tested under switching light conditions, and the phosphor showed a persistent afterglow behavior. A bright cyan afterglow can be observed in the first few minutes, and then the intensity of the luminescence is continuously attenuated. From what has been presented in Fig. 5, it can be found that the initial luminescence attenuation of CaSnO3:Lu3+ is faster, but the luminescence decay rate is continuously decreasing, and finally stable emission is achieved.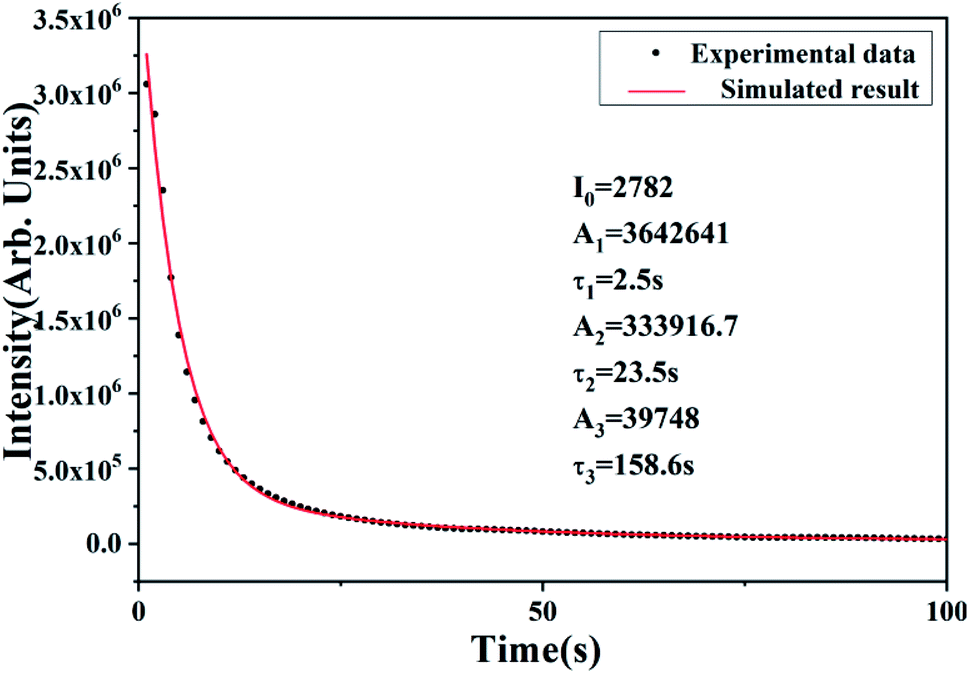 | ||
| Fig. 5 Afterglow curve of the CaSnO3:Lu3+ phosphor. | ||
Although the subsequent luminescence intensity is weak, continuous persistence can still be observed. We have established a three-index afterglow attenuation model for CaSnO3:Lu3+ phosphors, which is fully consistent with the behavior of rare earth doped long afterglow phosphors. To further investigate the decay process involved in afterglow behavior, we made the attenuation curve by curve fitting. This attenuation curve can be fitted as follows using a three-exponential equation.18,19
I = I0 + A1![[thin space (1/6-em)]](https://www.rsc.org/images/entities/char_2009.gif) exp(−t/τ1) + A2exp(−t/τ2) + A3exp(−t/τ3) exp(−t/τ1) + A2exp(−t/τ2) + A3exp(−t/τ3)
| (1) |
3.4 Thermoluminescence analysis
It is commonly recognized that appropriate trap depth and high trap density play a leading role in LAG performance. We use TSL measurements to explore the relevant information and properties of the traps, resulting in a TSL curve is shown in Fig. 6. The TL spectrum has a single broad peak with no obvious inflection points, indicating no other overlapping peaks. The trap depth and trap density in the phosphor can be obtained by analyzing the TL spectrum using the following equation:20–23,25
 | (2) |
 | (3) |
 | (4) |
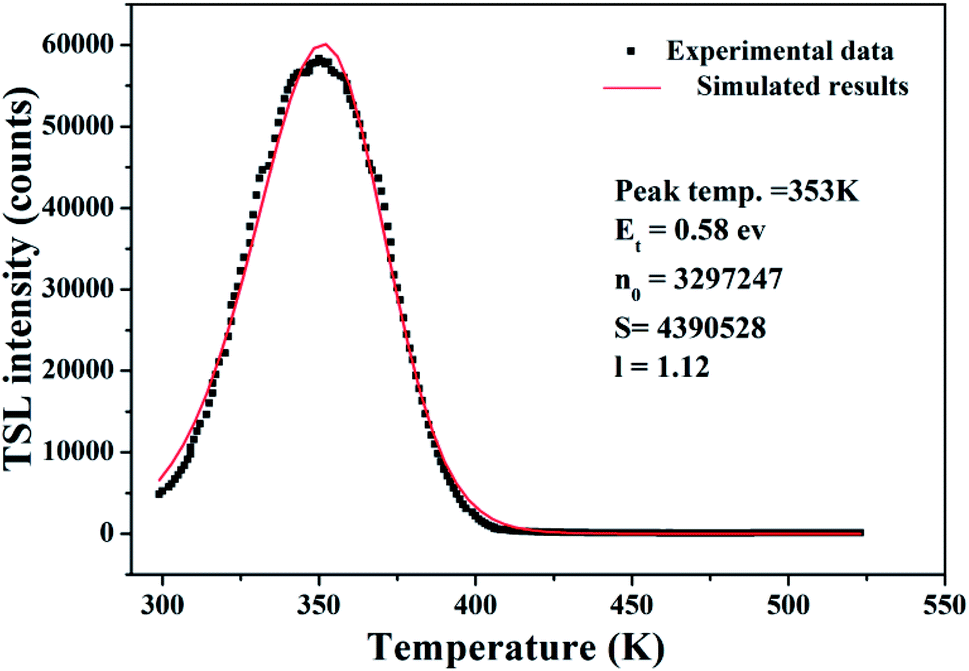 | ||
| Fig. 6 TSL curve of the CaSnO3:0.02Lu3+ phosphor. | ||
Considering j = 3, we got another expression as eqn (5):
 | (5) |
We fit the experimental data according to eqn (1) and (5) and calculate the parameters Et and n0, as listed in Fig. 6. According to previous studies, if the depth of the trap is between 0.4 eV and 0.6 eV, the fluorescent material will exhibit excellent LAG performance. It can be seen from Fig. 6 that the material exhibits excellent afterglow behavior when the trap depth is 0.55 eV, which means that more traps can capture more free electrons and produce brighter initial phosphorescence and longer afterglow duration.26,27
The TL curves as a function of Lu3+ are shown in Fig. 6, which clearly presents a peak at 353 K. From the empirical formula ET = Tm/500 (ET is the estimated depth with unit of eV and Tm is the temperature at which the TL curve reaches a maximum with a unit of kelvin), we calculated that the trap depth is 0.706 eV.1,28
3.5 Possible mechanism of long afterglow
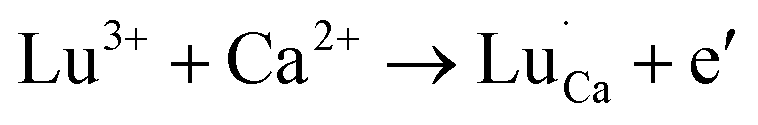
Derived from the above descriptions and analysis above, we attempt to explain the phosphorescence mechanism of CaSnO3:Lu3+ phosphors. In CaSnO3:Lu3+ phosphors, Lu3+ ions can bind to Ca2+ sites because they have very close ionic radii.25 This non-equivalent substitution process occurs in the following equation.
 | (6) |
There are two ways to ensure the conservation of charge in the experiment, one is electronic compensation, and the other is vacancy compensation. The first is electronic compensation, which captures the released electrons to maintain charge balance. The element Sn in the phosphor is considered to be a multivalent ion. Therefore, some Sn4+ ions may capture electrons released in eqn (5), and the valence state changes from tetravalent to divalent. The substitution of Sn2+ for the Sn4+ position will result in structural defects, which can be treated as positional locations for charge carrier (electrons) and act as hole traps. The other is vacancy compensation, and the metal ion vacancy generated in the crystal lattice compensates for the charge. Two Lu3+ ions will replace three Ca2+ ions to balance the charge of these phosphors, resulting in Ca2+ vacancy 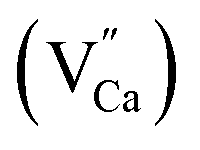 and positive defects
 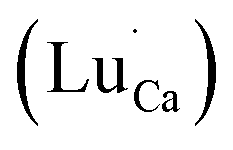 . The defect equation is expressed as follows:
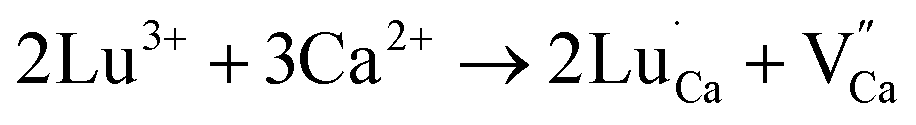 | (7) |
The mechanism of cyan LAG phenomenon in CaSnO3:Lu3+ can be interpreted as follows. The structure defects Sn2+ and the defects  may act as hole-trapping centers, while
  as electron trapping centers. In order to clarify the afterglow process more clearly, both Fig. 2 and 7 show schematic diagrams of the phosphorescence mechanism of CaSnO3:Lu3+. Under ultraviolet irradiation (process numbered ①), electrons in VB (valence band) are excited to CB (conduction band) and then transferred to the luminescent center Sn2+ through the body. Then, Sn2+ is subjected to feature transmission (process numbered ②). At the same time, many photon induced electrons or holes can be captured by electron traps or hole traps (process numbered ③). After the UV light switched off, the trapped electrons and holes can be released with the help of thermal disturbances at the room temperature (process numbered ④). The free electrons will move to the T1 level of Sn2+ and the holes will move to the ground state of Sn2+. At last, electrons recombine with holes and the energy released from the recombination will excite a characteristic emission of Sn2+ to generate PPL emission and long afterglow phosphorescence in the CaSnO3:Lu3+ phosphor.26,27,29,30
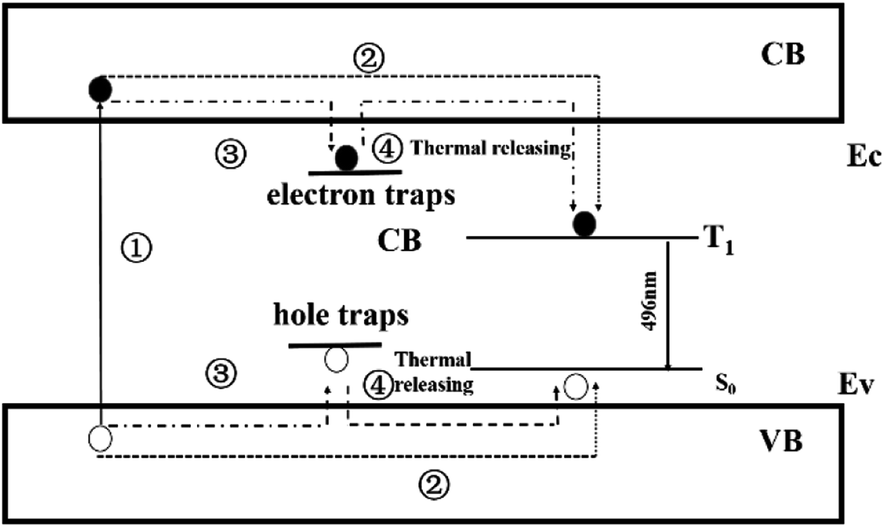 | ||
| Fig. 7 The schematic graph of persistent luminescence mechanism for CaSnO3:Lu3+ phosphor. | ||
4. Conclusions
In this paper, a new cyan glow afterglow phosphor CaSnO3:Lu3+ was successfully prepared by high temperature solid phase method. By observing the PL spectrum and the CIE 1931 chromaticity coordinates, it is concluded that the CaSnO3:Lu3+ phosphor emits cyan light due to the triplet to singlet (T1 → S0) transition of the Sn2+ ion. XPS measurements showed the presence of Sn2+ ions in the crystal lattice, and the relative ratio of Sn4+/Sn2+ in the CaSnO3:Lu3+ phosphor was 3.85. After the illumination source is turned off, long-lasting phosphorescence can be seen in the dark with the naked eye. TSL studies have shown that a suitable electron or hole trap depth is produced by doping Lu3+, which is beneficial for the phosphor to produce long-lasting phosphorescence. At the same time, it was concluded that the LAG phenomenon is caused by the thermal stimulation of holes and electrons escaping from the trap at room temperature.Conflicts of interest
There are no conflicts to declare.Acknowledgements
This work was supported by the projects of the National Natural Science foundation of China (No. 61307118), of the Science and Technology Department of Jilin Province (No. 201201117), of the Education Department of Jilin Province (No. JJKH20181094KJ), of innovation fund of Changchun University of Science and Technology (No. 000566).References
- P. Xiong and M. Peng, J. Mater. Chem. C, 2019, 7(27), 8303–8309 RSC.
- F. Shen, C. Deng, X. Wang, C. Zhang and W. Liu, J. Mater. Sci.: Mater. Electron., 2016, 27(9), 9067–9072 CrossRef CAS.
- I. P. Sahu, D. P. Bisen, N. Brahme and R. K. Tamrakar, J. Mater. Sci.: Mater. Electron., 2015, 27(1), 554–569 CrossRef.
- Q. Zhang, M. Rong, H. Tan, Z. Wang, Q. Wang and Q. Zhou, et al., J. Mater. Sci.: Mater. Electron., 2016, 27(12), 13093–13098 CrossRef CAS.
- Y. Zhu, Z. Pang, J. Wang, M. Ge and A. Ju, J. Mater. Sci.: Mater. Electron., 2016, 27(7), 7554–7559 CrossRef.
- W. Li, Y. Liu and P. Ai, Mater. Chem. Phys., 2010, 119(1–2), 52–56 CrossRef CAS.
- D. S. Kshatri and A. Khare, J. Alloys Compd., 2014, 588, 488–495 CrossRef CAS.
- Y. Mei, H. Xu, J. Zhang, Z. Ci, M. Duan and S. Peng, et al., J. Alloys Compd., 2015, 622, 908–912 CrossRef CAS.
- B. Lei, B. Li, H. Zhang and W. Li, Opt. Mater., 2007, 29(11), 1491–1494 CrossRef CAS.
- Z. Liu and Y. Liu, Mater. Chem. Phys., 2005, 93(1), 129–132 CrossRef CAS.
- J. Zhang, B. Chen, Z. Liang, X. Li, J. Sun and L. Cheng, et al., J. Alloys Compd., 2014, 612, 204–209 CrossRef CAS.
- M. Shi, D. Zhang and C. Chang, J. Alloys Compd., 2015, 639, 168–172 CrossRef CAS.
- D. Zhang, M. Shi, Y. Sun, Y. Guo and C. Chang, J. Alloys Compd., 2016, 667, 235–239 CrossRef CAS.
- J. F. Tang, J. Gou, G. N. Li, H. He, Y. Li and C. M. Li, J. Alloys Compd., 2016, 672, 1–6 CrossRef CAS.
- G. F. Ju, Y. H. Hu, L. Chen, Z. F. Yang, T. Wang, Y. H. Jin and S. A. Zhang, Ceram. Int., 2015, 41(10), 14998–15004 CrossRef CAS.
- J. A. Jiménez and C. Zhao, Mater. Chem. Phys., 2014, 147(3), 469–475 CrossRef.
- Hayakawa, Jpn. J. Appl. Phys., 2006, 45, 107–113 CrossRef.
- W. Xie, Y. Wang, C. Zou, J. Quan and L. Shao, J. Alloys Compd., 2015, 619, 244–247 CrossRef CAS.
- T. Katsumata, J. Electrochem. Soc., 1997, 144(9), L243 CrossRef CAS.
- M. S. Jahan, D. W. Cooke, W. L. Hults, J. L. Smith, B. L. Bennett and M. A. Maez, J. Lumin., 1990, 47, 85–91 CrossRef CAS.
- D. W. Cooke, B. L. Bennett, E. H. Farnum, W. L. Hults, R. E. Muenchausen and J. L. Smith, Appl. Phys. Lett., 1990, 70(26), 3594–3596 CrossRef.
- E. W. Forsythe, D. C. Morton, C. W. Tang and Y. Gao, Appl. Phys. Lett., 1998, 73(11), 1457–1459 CrossRef CAS.
- R. Chen, J. Electrochem. Soc., 1969, 116, 1524–1527 CrossRef.
- Z. Liang, J. Zhang, J. Sun, X. Li, L. Cheng and H. Zhong, et al., Phys. Rev. B: Condens. Matter Mater. Phys., 2013, 412, 36–40 CrossRef CAS.
- D. Zhang, M. Shi and Y. Sun, et al., J. Alloys Compd., 2016, 667, 235–239 CrossRef CAS.
- P. Xiong and M. Peng, J. Mater. Chem. C, 2019, 7, 6301–6307 RSC.
- P. Xiong and M. Peng, Optical Materials: X, 2019, 2, 100022 CrossRef.
- K. Van den Eeckhout, P. F. Smet and D. Poelman, Materials, 2010, 3, 2536–2566 CrossRef CAS.
- Y. Jin, Y. Hu and L. Chen, et al., Opt. Mater., 2013, 35(7), 1378–1384 CrossRef CAS.
- P. Xiong and M. Peng, et al., J. Am. Ceram. Soc., 2019, 102, 5899–5909 CrossRef CAS.
| This journal is © The Royal Society of Chemistry 2019 |