 Open Access Article
The direct electrochemistry and bioelectrocatalysis of nitrate reductase at a gold nanoparticles/aminated graphene sheets modified glassy carbon electrode
Ke Zhangab,
Hao Zhoua,
Ping Hu*a and
Qing Lu *a
*a
aInstitute of Environmental Medicine, State Key Laboratory of Environment Health (Incubation), Key Laboratory of Environment and Health, Ministry of Education, Key Laboratory of Environment and Health (Wuhan), Ministry of Environmental Protection, School of Public Health, Tongji Medical College, Huazhong University of Science and Technology, #13 Hangkong Road, Wuhan, Hubei 430030, China. E-mail: qi_weiliao@126.com
bDepartment of Clinical Laboratory, Union Hospital, Tongji Medical College, Huazhong University of Science and Technology, #1277 Jiefang Avenue, Wuhan, Hubei 430022, China
First published on 14th November 2019
Abstract
It is rather difficult to achieve the direct electrochemistry of nitrate reductase (NR) as it is a complex homodimeric enzyme. However, in this study, the direct electron transfer between NR's redox centers and the electrode surface was achieved with the aid of aminated graphene sheets (am-GSs) which could immobilize NR stably and control the orientation of the enzyme molecules on the surface of the modified electrode through electrostatic attractions. Moreover, when the gold nanoparticles (AuNPs) which could act as electronic wire were introduced to the modified electrode, the NR-based enzymatic reduction of nitrate was promoted and a sensitive electrochemical response regarding the electrochemical reduction of nitrate could be obtained at the NR/AuNPs/am-GSs/GC electrode. Under optimized conditions, a wide linear range from 1.0 × 10⁻⁶ mol L−1 to 2.0 × 10⁻³ mol L−1 was acquired with a low detection limit of 7 × 10⁻⁷ mol L−1 (S/N = 3). The biosensor was successfully employed to determine the total nitrogen in environmental water samples and the results were in good accordance with those obtained by ultraviolet-visible spectrophotometry.
1. Introduction
It is well-known that nitrate is a potential hazard to both human health and the environment. Nitrate may be metabolized into substances such as nitrosamine and N-nitrosamide, which can induce carcinogenicity, teratogenicity and mutagenicity.1 Excessive nitrate in environmental water systems may lead to ecological problems such as algal blooms, dissolved oxygen depletion and possibly eutrophication of surface waters.2–5 In recent decades, the incidences of nitrate pollution in water systems have been increasing at a terrifying speed due to the direct utilization of nitrogen-based fertilizers.6 In China, the situation is especially serious. It was reported that the nitrogen-based fertilizer consumption in China had increased from 8![[thin space (1/6-em)]](https://www.rsc.org/images/entities/char_2009.gif) 840
840![[thin space (1/6-em)]](https://www.rsc.org/images/entities/char_2009.gif) 000 tons in 1978 to 48
000 tons in 1978 to 48![[thin space (1/6-em)]](https://www.rsc.org/images/entities/char_2009.gif) 000
000![[thin space (1/6-em)]](https://www.rsc.org/images/entities/char_2009.gif) 000 tons in 2006, far more than the ceiling set for fertilizer use in developed countries to prevent water pollution.7,8 Consequently, high nitrate levels in environmental water were frequently detected in many areas of China. For example, a report in 2006 showed that the average nitrate level in hand pumping wells in Beijing plain agricultural area was 14.01 mg L−1, which exceeded the Environmental Protection Agency (EPA) standard by up to 46.3%.9
000 tons in 2006, far more than the ceiling set for fertilizer use in developed countries to prevent water pollution.7,8 Consequently, high nitrate levels in environmental water were frequently detected in many areas of China. For example, a report in 2006 showed that the average nitrate level in hand pumping wells in Beijing plain agricultural area was 14.01 mg L−1, which exceeded the Environmental Protection Agency (EPA) standard by up to 46.3%.9
In view of the serious situation of nitrate pollution, it is essential to develop some methods that could realize accurate and fast detection of nitrate. After efforts of researchers, some methods were reported, such as ion exchange chromatography combined with spectrometric,10 high performance liquid chromatography (HPLC),11,12 chemiluminescence,13 electrochemical methods14–16 and so on. Compared with other methods, electrochemical methods have unique merits of fast response, simple operation and low cost.14–16 However, the poor selectivity limits their applications to a large extent.15 To overcome this drawback, nitrate biosensors with good selectivity and sensitivity may be a good choice.17,18
Introducing redox mediators, such as azure A, methyl viologen and so on, is one of the ways for fabricating nitrate biosensors.19,20 However, the presence of mediators always brings interferences and complex reaction systems, which makes it necessary to develop nitrate biosensor based on the direct electrochemistry of nitrate reductase (NR). NR is an enzyme that can reduce nitrate to nitrite by specific recognition sites.21 Moreover, it is a complex homodimeric enzyme with a MW of 180 kDa and each monomer contains three redox cofactors, including Mo cofactor (Moco), Fe-heme and flavin adenine dinucleotide (FAD).22 Unfortunately, it is not easy to achieve the direct electron transfer between NR's redox centers and the surface of the electrodes. Several factors have been found to hinder the direct electron transfer, including the deepness of electroactive centers within the enzymes' structure, adsorptive denaturation of enzymes onto electrodes, and their unfavorable orientations at electrodes. In the process of looking for methods to achieve the direct electrochemistry of NR, an internal electron transfer pathway was found in prokaryotic NR (e.g. NR from Escherichia coli and NarGHI NR).23,24 Bernhardt's group also investigated the direct catalytic electrochemistry of a eukaryotic NR adsorbed on an edge plane pyrolytic graphite-working electrode modified by polyethyleneimine and polymyxin B.25 Nevertheless, the cyclic voltammetry (CV) trace in those studies did not reveal any clear responses in the absence of nitrate.23–25
Owning to the unique properties including fast electron transportation, high thermal conductivity and excellent mechanical flexibility, graphene sheets (GSs) have been applied widely in the construction of enzyme-based biosensors. As reported, GSs can shorten the electron transfer distance and enhance the electrical communication between the redox centers of enzymes and the electrode surface.16,26 Furthermore, GSs can immobilize enzyme well due to their large surface area and at the same time keep the original structures and the biological activities of enzymes because of their good biocompatibility. To control the driving forces of enzyme's adsorption and orientation, the functionalization tailored with charge groups, such as –COOH, –NH2 etc. on the surface of nanomaterials may be a facile method.27,28
Thus, in this study, aminated graphene sheets (am-GSs) was introduced and applied to fabricate NR-based nitrate biosensor. Based on the electrostatic attractions between am-GSs and NR, the NR molecules were firmly immobilized on the modified electrode and the direct electrochemistry of NR was achieved. Moreover, due to the Au–S bonding, gold nanoparticles (AuNPs) was introduced to the system, acting as “electronic wire” to transfer electron from the electrode surface to the enzyme's redox cofactors, and then promoting the enzymatic reduction of nitrate. The proposed biosensor showed a sensitive response to nitrate, which makes it a great potential for nitrate detection.
2. Experimental
Cyclic voltammetry (CV) was performed with a computer-controlled CHI830A electrochemical workstation (Chenhua Instrument Co., Shanghai, China). A conventional three-electrode system consisting of a modified glassy carbon electrode as the working electrode, a saturated calomel electrode (SCE) as the reference electrode, and a platinum wire as the counter electrode was applied. Field emission scanning electron microscopy (FESEM) was performed with Sirion 200 field-emission scanning electron microanalyzer (FEI, Netherlands). A Lambda 35 Ultraviolet-visible (UV-Vis) spectrophotometer (PerkinElmer, USA) was utilized to determine the total nitrogen in environmental water samples and the nitrate concentration in fresh vegetable samples.Nitrate reductase (NR, from Aspergillus niger, NAD(P)H-bispecific form, EC 1.7.1.2) and HAuCl4 were obtained from Sigma (USA) and utilized without further purification. Graphite oxide was purchased from Alfa Aesar (USA). NaNO3 and KCl were freshly prepared before use. The phosphate buffer solutions (PBS) contained 0.1 mol L−1 Na2HPO4 and NaH2PO4. The pH of PBS was adjusted with H3PO4 and NaOH to 7.0. Twice-distilled water was used throughout the experiments. All electrochemical experiments were carried out at 25 °C. Prior to each electrochemical experiment, the buffer solutions were purged with high-purity nitrogen for 20 minutes at least, and then a nitrogen atmosphere was kept over the solutions during the experimental process.
The glassy carbon (GC) electrode was firstly polished with 0.1 μm alumina slurry on a polishing cloth, then sonicated in nitric acid (1![[thin space (1/6-em)]](https://www.rsc.org/images/entities/char_2009.gif) :
:![[thin space (1/6-em)]](https://www.rsc.org/images/entities/char_2009.gif) 1), ethanol and water in sequence, each for 2 minutes, and at last, dried in air. The aminated graphene sheets (am-GSs) were prepared by an epoxide ring-opening reaction as previously reported.29 The obtained am-GSs (1.5 mg) were mixed with 1 mL anhydrous ethanol and then sonicated for 1 hour to make am-GSs suspension. Then, 3 μL homogenized am-GSs ethanol solution (1.5 mg mL−1) was cast onto the GC electrode surface by micropipette and dried under an infrared lamp to obtain the am-GSs/GC electrode. The gold nanoparticles (AuNPs) were directly electrodeposited on the am-GSs/GC electrode in 0.1 mol L−1 KCl solution containing 0.1 mol L−1 HAuCl4 at a working potential of −0.2 V for 60 s.30 The NR-based electrodes were prepared by immersing the am-GSs/GC electrode and the AuNPs/am-GSs/GC electrode in 2.0 mg mL−1 NR solution (pH 7.0) for 12 hours and then washed adequately with water to remove the unadsorbed enzyme molecules.
1), ethanol and water in sequence, each for 2 minutes, and at last, dried in air. The aminated graphene sheets (am-GSs) were prepared by an epoxide ring-opening reaction as previously reported.29 The obtained am-GSs (1.5 mg) were mixed with 1 mL anhydrous ethanol and then sonicated for 1 hour to make am-GSs suspension. Then, 3 μL homogenized am-GSs ethanol solution (1.5 mg mL−1) was cast onto the GC electrode surface by micropipette and dried under an infrared lamp to obtain the am-GSs/GC electrode. The gold nanoparticles (AuNPs) were directly electrodeposited on the am-GSs/GC electrode in 0.1 mol L−1 KCl solution containing 0.1 mol L−1 HAuCl4 at a working potential of −0.2 V for 60 s.30 The NR-based electrodes were prepared by immersing the am-GSs/GC electrode and the AuNPs/am-GSs/GC electrode in 2.0 mg mL−1 NR solution (pH 7.0) for 12 hours and then washed adequately with water to remove the unadsorbed enzyme molecules.
The proposed biosensor was applied to determine the total nitrogen in environmental water samples. Six water samples were collected from Han River and Yangtze River (Wuhan, China), respectively. Each sample was digested by the procedures as National Environmental Protection Standard of P.R.C. (HJ 636-2012) suggested. In brief, all nitrogen-containing compounds in water samples were oxidized to nitrate by alkaline potassium persulfate digestion. Then, the nitrate concentration was determined by the as-prepared biosensor. As a comparison, total nitrogen in the same samples was also analyzed by UV spectrophotometric method suggested by National Environmental Protection Standard of P.R.C. (HJ 636-2012). The proposed biosensor was also utilized to determine the nitrate concentration in fresh vegetable samples. Two vegetable samples (celery and cabbage) were bought from supermarket and prepared as National Environmental Protection Standard of P.R.C. (NY 1279-2007) suggested. Considering that no nitrate was found in celery and cabbage, the standard addition method was applied to investigate the performance of the proposed biosensor. And UV spectrophotometric method was also used to analyze the vegetable samples for comparison.
3. Results and discussion
3.1. Direct electrochemistry of NR at the am-GSs/GC electrode
As the isoelectric point of NR is 6.2,31 if dissolving the enzyme in 0.1 mol L−1 PBS with pH value of 7.0, NR will be negatively charged. Meanwhile, the prepared am-GSs was positively charged due to the large amount of amino on their surface. Thus, there were strong electrostatic attractions between NR and am-GSs, which could immobilize NR on the surface of the am-GSs/GC electrode stably.Cyclic voltammetry (CV) was applied to study the electrochemical behaviors of NR at different electrodes (Fig. 1). A pair of well-defined redox peaks at about −0.40 V is observed at the NR/am-GSs/GC electrode (curve c) in pH 7.0 PBS at the scan rate of 0.1 V s−1. The reduction and oxidation peak currents display nearly equal heights. The cathodic and anodic peak potentials are located at about −0.42 V and −0.39 V, respectively, with a peak potential separation of 30 mV. In contrast, no obvious peak appears at the NR/GC and the am-GSs/GC electrodes (curves a and b). The results suggest that the enzyme molecules are immobilized at the am-GSs/GC electrode stably and the pair of peaks located at about −0.40 V attributes to the direct electrochemistry of NR with the aid of am-GSs.
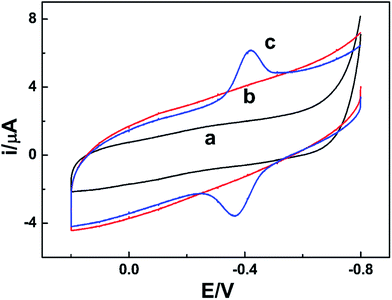 | ||
| Fig. 1 CV curves of (a) the NR/GC electrode, (b) the am-GSs/GC electrode and (c) the NR/am-GSs/GC electrode at the scan rate of 0.1 V s−1 in pH 7.0 PBS. | ||
In this study, NR from Aspergillus niger is a kind of typical eukaryotic NR. The enzyme contains three redox cofactors, including Mo cofactor (Moco), Fe-heme and flavin adenine dinucleotide (FAD). Usually, the Moco active site locates in the N terminal region, and FAD locates in the C terminal region as well. In addition, Fe-heme is deeply buried in the center domain of the enzyme. Since NR is a big complex enzyme, the electrostatic surface potential should be considered when studying its direct electrochemistry. The crystal structures of the NR's active sites have been investigated in the past.22 Moco was found to be surrounded by positively charged residues.22 In view of Fe-heme, its axial ligands were two histidine residues (His39 and His63), which were usually positively charged under neutral pH environment.32 Conversely, FAD was surrounded by acidic amino acid residues, which were negatively charged.33 Therefore, compared with the positively charged Moco and Fe-heme domains, the negatively charged FAD domain may be much more easily attracted to the surface of the am-GSs modified electrode due to the electrostatic attractions. In other words, when NR is immobilized on the am-GSs modified electrode, the enzyme's favorable orientation may make FAD close to the surface of the modified electrode and the distance between FAD and the modified electrode's surface may be short enough to achieve efficient heterogeneous electron transfer. Meanwhile, Moco and Fe-heme may be far away from the surface of the modified electrode. Therefore, it is believed that the pair of peaks at about −0.40 V was the characteristics of FAD from NR, which is in accordance with Bernhardt's report. Bernhardt's group investigated the electrochemical behaviors of eukaryotic NR by square wave voltammetry and assigned the FAD response (at pH 8.0) to the peak at −0.27 V (vs. NHE).25 For further confirmation, the electrochemical behaviors of free FAD and free Fe-heme at the am-GSs/GC electrode were also investigated (not shown). The pair of peaks of FAD and Fe-heme were located at about −0.46 V and −0.34 V, respectively, different from that of NR at the am-GSs/GC electrode.
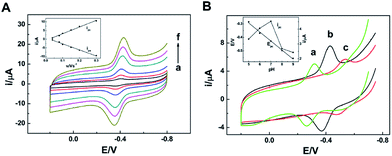
The electrochemical characteristics of the NR/am-GSs/GC electrode were investigated by CV. Fig. 2A shows the effect of the scan rate on the electrochemical response of the modified electrode in PBS of pH 7.0. Obviously, the redox peak currents increase gradually with the increase of the scan rate in the range from 0.04 V s−1 to 0.3 V s−1. Meanwhile, the reductive and oxidative peak currents (ipc and ipa) are linear with the scan rate in the same range (Fig. 2A, inset), indicating that the electrochemical response of the NR/am-GSs/GC electrode is a typical surface-controlled voltammetry. According to Bard's equations,34
| ip = (n2F2AΓv)/4RT = nFQv/4RT, |
3.2. Electrocatalytical characteristics of the NR/AuNPs/am-GSs/GC electrode
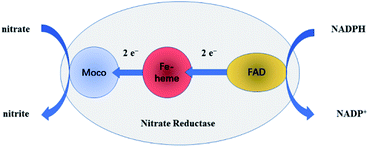
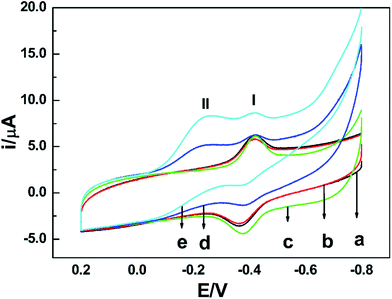
NR can catalyze the reduction of nitrate to nitrite with the help of the cooperation of cofactors.21 At first, as the electron donor, NAD(P)H provides two electrons to FAD. Secondly, the electrons are passed to Moco through Fe-heme to reduce MoVI to its active MoIV form. Finally, nitrate binds to the active MoIV form of NR and O atom is transferred to Mo coupled with the oxidation of MoIV to MoVI, releasing nitrite as the product. The whole pathway is briefly shown in Fig. 3.To test the biological activity of the immobilized enzyme towards nitrate, CV experiments were carried out. As shown in Fig. 4, whether in the absence or presence of nitrate in PBS of pH 7.0, the CV curves of the NR/am-GSs/GC electrode are almost unchanged (curves a and b). It seems that the immobilized enzyme ‘lost’ its activity. As previously discussed, Moco and Fe-heme of the immobilized enzyme may be far away from the surface of the modified electrode. Meanwhile, FAD may undergo a facile direct electron transfer with the am-GSs/GC electrode. Therefore, Moco cannot get electrons from FAD to produce active form that reduces nitrate to nitrite. Accordingly, the whole electron-transfer pathway of enzymatic reaction (Fig. 3) may be interrupted. In view of this, AuNPs was introduced to the modified electrode to act as electronic wire. Campbell et al. found that NR contained one conserved cysteine (Cys) residue located in Fe-heme domain, which was essential for highly efficient electron transfer.33 Due to Au–S bonding, the introduced AuNPs can act as electronic wire to transfer electron from the electrode to Fe-heme. And then, Fe-heme may transfer electrons to Moco to produce active MoIV form. Consequently, the immobilized enzyme can catalyze the reduction of nitrate to nitrite. As illustrated in Fig. 4, in the presence of 0.4 mmol L−1 nitrate in PBS (pH 7.0), a new reduction peak located at −0.2 V (labelled as peak II) is observed at the NR/AuNPs/am-GSs/GC electrode (curve d). Moreover, the reductive peak current increases with the increase of nitrate concentration (curve e). The above phenomena suggest that peak II has relationship with nitrate. The results also confirmed our inference. Meanwhile, compared with the NR/AuNPs/am-GSs/GC electrode in the absence of nitrate (curve c), the redox peaks (located around −0.4 V, labelled as peaks I) currents at the NR/AuNPs/am-GSs/GC electrode decrease (curves d and e) in the presence of nitrate. The decrease of peaks I may attribute to the reduction of the electrons number involved in the direct electron transfer between FAD and the surface of the NR/AuNPs/am-GSs/GC electrode. At the same time, the number of electrons participated in the enzymatic reaction increases. The electrochemical response of the NR/AuNPs/GC electrode to nitrate was also studied (not shown). The results indicated that AuNPs had little benefit on the reduction of nitrate without the aid of am-GSs.
The stepwise modification of electrode was characterized by field emission scanning electron microscopy (FESEM). Fig. 5 shows the FESEM images of the am-GSs/GC electrode, the AuNPs/am-GSs/GC electrode and the NR/AuNPs/am-GSs/GC electrode. It is found that large pieces of am-GSs are covered on the GC electrode surface with slight wrinkles (Fig. 5A). After the AuNPs were electrodeposited on the surface of the am-GSs/GC electrode, there are many cauliflower-shaped particles dispersed homogeneously on the surface of the am-GSs, with diameters in the range of approximately 50–200 nm (Fig. 5B). In addition, as the high-magnification FESEM image illustrated (Fig. 5B, inset), the surfaces of the obtained AuNPs are very rough. When NR was adsorbed on the AuNPs/am-GSs/GC electrode, as shown in Fig. 5C, very different surface image is observed. The FESEM images indicate that the proposed electrode is fabricated step by step successfully.
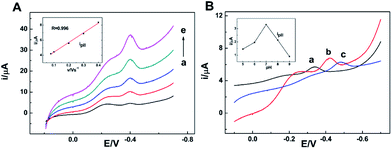
The effects of scan rate and buffer solution's pH on the reduction peak at −0.2 V (peak II) observed at the NR/AuNPs/am-GSs/GC electrode were also investigated and displayed in Fig. 6 (only reductive branches of CV were presented). As shown in the inset of Fig. 6A, the current of peak II increases linearly with the increase of the scan rate in the range from 0.08 V s−1 to 0.4 V s−1, suggesting that it is a surface-controlled electrochemical behavior. On the other hand, the current of peak II reaches its maximum value at the buffer solution's pH of 7.0 (Fig. 6B, inset). As mentioned above, due to Au–S bonding, the AuNPs can act as electronic wire to transfer electron from the electrode to Fe-heme deeply buried in NR. The buffer solution's pH may affect the spatial structure of NR, resulting in the change of Au–S bonding. Therefore, the buffer solution's pH of 7.0 is the optimum pH value.
3.3. Nitrate detection at the NR/AuNPs/am-GSs/GC electrode
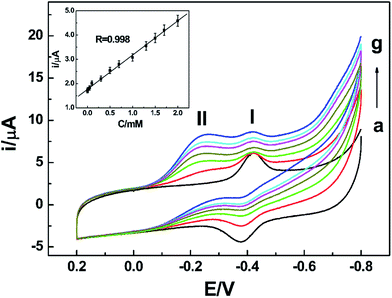
Since peak II had relationship with nitrate, it can be applied to achieve the detection of nitrate. The composition of the NR/AuNPs/am-GSs/GC electrode may affect its electrochemical response to nitrate. In order to achieve a sensitive detection of nitrate, the amount of NR, AuNPs and am-GSs for the modified electrode were investigated and optimized. In this study, the amount of NR was found to depend on its concentration and adsorption time. The amount of AuNPs could be controlled by electrodeposition time. The amount of am-GSs depended on the volumes and concentrations of the am-GSs ethanol solution. Therefore, orthogonal experiments were performed to choose the best modification parameters. Finally, the optimum NR concentration was determined to be 2 mg mL−1 and its optimum adsorption time was 12 hours. An optimized electrodeposition time of AuNPs was selected as 60 s. Moreover, 3 μL am-GSs ethanol solution with a concentration of 1.5 mg mL−1 was chosen for further investigations.Under the optimized experimental parameters, a facile NR-based biosensor was fabricated and utilized for the detection of nitrate by CV. As displayed in Fig. 7, the reductive peak II current increases with the increase of nitrate concentration in PBS (pH 7.0). Moreover, the current shows a linear relationship with nitrate concentration (Fig. 7, inset) in the range from 1.0 × 10⁻⁶ to 2.0 × 10⁻³ mol L−1. A linear regression equation was obtained as I/μA = 1.758 + 1.412C/mmol L−1, with a correlation coefficient of 0.998. And a limit of detection (LOD) was estimated as 7.0 × 10⁻⁷ mol L−1 (S/N = 3). Compared with other electrochemical biosensors, such as the methyl viologen/Nafion/NR-based biosensor (linear range: 20–250 μM; LOD: 5 μM)36 and the CNTs/PPy/NR-based biosensor (linear range: 0.44–1.45 mM; LOD: 0.17 mM),14 the as-prepared biosensor exhibited wider linear range and lower LOD.
The stability and reproducibility of the biosensor were also studied. When stored at 4 °C in dark for about 15 days, the biosensor retained about 89% of its initial sensitivity to nitrate. The relative standard deviation (RSD) of the biosensor's response to 0.4 mmol L−1 nitrate was 4.9% for five electrodes, which were made simultaneously by the same process. Several cations, anions and small organic molecules were investigated for their interferences with the electrochemical detection of nitrate by the proposed biosensor. The results are listed in Table 1, indicating the biosensor possesses good selectivity for nitrate determination.
| Interferents | Concentration (mmol L−1) | Signal change (%) |
|---|---|---|
| Zn2+ | 50 | 2.3 |
| Fe3+ | 50 | 3.1 |
| Mn2+ | 50 | −1.9 |
| Cl− | 50 | 1.1 |
| Ascorbic acid | 5 | −3.6 |
| Uric acid | 5 | −4.2 |
3.4. Real sample analysis
The proposed biosensor was applied to determine the total nitrogen in environmental water samples, collected from Han River and Yangtze River (Wuhan, China) and pretreated as described in Section 2. By means of UV spectrophotometric method and the prepared biosensor, the total nitrogen in water samples was determined successfully. And the results are listed in Table 2. The data of the as-prepared biosensor showed a good agreement with those obtained by UV spectrophotometer, indicating that the proposed biosensor had good accuracy and sensitivity.| Sample | UV spectrophotometer (mmol L−1) | Biosensor (mmol L−1) | RSD (%) |
|---|---|---|---|
| 1 | 0.104 | 0.101 | 2.068 |
| 2 | 0.083 | 0.089 | 4.930 |
| 3 | 0.073 | 0.078 | 4.689 |
| 4 | 0.072 | 0.070 | 1.986 |
| 5 | 0.082 | 0.083 | 0.857 |
| 6 | 0.047 | 0.045 | 3.065 |
In addition, the proposed biosensor was also utilized to determine the nitrate in celery and cabbage, which bought from supermarket and prepared as described in Section 2. Considering that no nitrate was found in vegetables, the standard addition method was applied to investigate the performance of the proposed biosensor. And UV spectrophotometric method was also used to analyze the vegetable samples for comparison. The results are listed in Table 3. Compared with UV spectrophotometric method, the proposed biosensor showing comparable recoveries.
| Sample | Added (mmol L−1) | UV spectro-photometer (mmol L−1) | Biosensor (mmol L−1) | Recovery (%) | RSD (%) |
|---|---|---|---|---|---|
| Celery | 0.2 | 0.208 | 0.211 | 105.5 | 3.724 |
| Cabbage | 0.4 | 0.425 | 0.383 | 95.8 | 4.367 |
4. Conclusions
In this study, a facile nitrate biosensor based on NR and the AuNPs/am-GSs/GC electrode was fabricated. The am-GSs displayed an enhancement for the direct electron transfer between NR and the modified electrode. The AuNPs illustrated a promotion for enzymatic reduction of nitrate. The prepared biosensor showed a sensitive electrochemical response to nitrate with a wide linear range (from 1.0 × 10⁻⁶ to 2.0 × 10⁻³ mol L−1) and a low LOD (7.0 × 10⁻⁷ mol L−1), which would satisfy the requirements of nitrate determination in water environment. In particular, the proposed biosensor had satisfied stability and reproducibility and could be manufactured conveniently, increasing its potential of feasibility in practical applications.Conflicts of interest
There are no conflicts to declare.Acknowledgements
The financial support from National Basic Research Program of China (973 Program, No. 2015CB352100) is greatly acknowledged.Notes and references
- J. Huber, J. Brender, Q. Zheng, J. Sharkey, A. Vuong, M. Shinde, J. Griesenbeck, L. Suarez, P. Langlois, M. Canfield, P. Romitti and P. Weyer, Nutr. J., 2013, 12, 34 CrossRef CAS PubMed.
- M. Garnier, F. Recanatesi, M. Ripa and A. Leone, Environ. Monit. Assess., 2010, 170, 273–286 CrossRef CAS PubMed.
- J. Qu and M. Fan, Crit. Rev. Environ. Sci. Technol., 2010, 40, 519–560 CrossRef CAS.
- M. Rivett, S. Buss, P. Morgan, J. Smith and C. Bemment, Water Res., 2008, 42, 4215–4232 CrossRef CAS PubMed.
- T. Wang, Y. Chen, J. Huang, K. Liu, S. Ke and H. Chu, Plant Physiol. Biochem., 2011, 49, 1369–1376 CrossRef CAS PubMed.
- A. Nestler, M. Berglund, F. Accoe, S. Duta, D. Xue, P. Boeckx and P. Taylor, Environ. Sci. Pollut. Res. Int., 2011, 18, 519–533 CrossRef CAS PubMed.
- J. Li, W. Lu, X. Zeng, J. Yuan and F. Yu, Environ. Monit. Assess., 2010, 169, 335–345 CrossRef CAS PubMed.
- G. Liu, W. Wu and J. Zhang, Agric., Ecosyst. Environ., 2005, 107, 211–220 CrossRef CAS.
- H. Liu, Z. Li, Y. Zhang, W. Zhang and B. Lin, Acta Pedol. Sin., 2006, 43, 405–413 Search PubMed.
- M. Maruo, T. Doi and H. Obata, Anal. Sci., 2006, 22, 1175–1178 CrossRef CAS PubMed.
- K. Selzle, C. Ackaert, C. Kampf, A. Kunert, A. Duschl, G. Oostingh and U. Pöschl, Anal. Bioanal. Chem., 2013, 405, 8945–8949 CrossRef CAS PubMed.
- M. Krishna, R. Dash, B. Reddy, P. Venugopal, P. Sandeep and G. Madhavi, Acta Chromatogr., 2013, 25, 503–518 CrossRef CAS.
- P. Mikuška and Z. Večeřa, Anal. Chim. Acta, 2003, 495, 225–232 CrossRef.
- F. Can, S. Korkut Ozoner, P. Ergenekon and E. Erhan, Mater. Sci. Eng., C, 2012, 32, 18–23 CrossRef CAS PubMed.
- J. Davis, M. Moorcroft, S. Wilkins, R. Compton and M. Cardosi, Analyst, 2000, 125, 737–742 RSC.
- F. Li, J. Li, Y. Feng, L. Yang and Z. Du, Sens. Actuators, B, 2011, 157, 110–114 CrossRef CAS.
- S. Da Silva, D. Shan and S. Cosnier, Sens. Actuators, B, 2004, 103, 397–402 CrossRef CAS.
- M. Sohail and S. Adeloju, Electroanalysis, 2009, 21, 1411–1418 CrossRef CAS.
- D. Quan, D. Min, G. Cha and H. Nam, Bioelectrochemistry, 2006, 69, 267–275 CrossRef CAS PubMed.
- S. Adeloju and M. Sohail, Electroanalysis, 2011, 23, 987–996 CrossRef CAS.
- W. Kaiser, E. Planchet and S. Rümer, Nitrate reductase and nitric oxide, in Annual Plant Reviews, Nitrogen Metabolism in Plants in the Post-genomic Era, ed. C. Foyer and H. Zhang, Wiley-Blackwell, Chichester, UK, 2011, vol. 42, pp. 127–146 Search PubMed.
- K. Fischer, G. Barbier, H. Hecht, R. Mendel, W. Campbell and G. Schwarz, Plant Cell, 2005, 17, 1167–1179 CrossRef CAS PubMed.
- S. Elliott, K. Hoke, K. Heffron, M. Palak, R. Rothery, J. Weiner and F. Armstrong, Biochemistry, 2004, 43, 799–807 CrossRef CAS PubMed.
- L. Anderson, D. Richardson and J. Butt, Biochemistry, 2001, 40, 11294–11307 CrossRef CAS PubMed.
- P. Kalimuthu, P. Ringel, T. Kruse and P. Bernhardt, Biochim. Biophys. Acta, 2016, 1857, 1506–1513 CrossRef CAS PubMed.
- S. Yang, Z. Lu, S. Luo, C. Liu and Y. Tang, Microchim. Acta, 2013, 180, 127–135 CrossRef CAS.
- F. Meder, H. Hintz, Y. Koehler, M. Schmidt, L. Treccani, R. Dringen and K. Rezwan, J. Am. Chem. Soc., 2013, 135, 6307–6316 CrossRef CAS PubMed.
- F. Meder, S. Kaur, L. Treccani and K. Rezwan, Langmuir, 2013, 29, 12502–12510 CrossRef CAS PubMed.
- K. Huang, D. Niu, X. Liu, Z. Wu, Y. Fan, Y. Chang and Y. Wu, Electrochim. Acta, 2011, 56, 2947–2953 CrossRef CAS.
- B. Park, D. Kim and D. Yoon, Korean J. Chem. Eng., 2011, 28, 64–70 CrossRef CAS.
- F. Blasco, B. Guigliarelli, A. Magalon, M. Asso, G. Giordano and R. Rothery, Cell. Mol. Life Sci., 2001, 58, 179–193 CrossRef CAS PubMed.
- W. Wang, J. Lu, P. Yao, Y. Xie and Z. Huang, Protein Eng., 2003, 16, 1047–1054 CrossRef CAS PubMed.
- W. Campbell, Annu. Rev. Plant Physiol. Plant Mol. Biol., 1999, 50, 277–303 CrossRef CAS PubMed.
- A. J. Bard and R. L. Faulkner, Electrochemical Methods: Fundamentals and Applications, John Wiley & Sons, Inc., New York, 2nd edn, 2001 Search PubMed.
- A. Harper and M. Anderson, Sensors, 2010, 10, 8248–8274 CrossRef CAS PubMed.
- X. Wang, S. Dzyadevych, J. Chovelon, N. Renault, L. Chen, S. Xia and J. Zhao, Talanta, 2006, 69, 450–455 CrossRef CAS PubMed.
| This journal is © The Royal Society of Chemistry 2019 |

