DOI:
10.1039/C9RA07001J
(Paper)
RSC Adv., 2019,
9, 35483-35498
Sustainable competitive adsorption of methylene blue and acid red 88 from synthetic wastewater using NiO and/or MgO silicate based nanosorbcats: experimental and computational modeling studies †
Received
2nd September 2019
, Accepted 28th October 2019
First published on 1st November 2019
Abstract
The competitive adsorption of cationic and anionic model molecules; methylene blue (MB) and acid red 88 (AR88), respectively, in aqueous solutions onto NiO and/or MgO SBNs was studied. Adsorption isotherms, kinetics and pH effect were investigated in batch modes. Computational modeling was conducted on Acclerys Material Studio for MB and AR88 adsorption. pH study showed that the adsorption is strongly pH dependent, increases for MB while decreases for AR88 with increasing the pH from 4 to 11. Isotherm studies revealed that the Sips model was the best fit for both molecules in single cases, and thus the Extended-Sips model for the binary systems. The kinetics for the binary systems were well-described by the external mass transfer model; thus, film diffusion is the most dominant in the adsorption of both organic onto the SBNs. The adsorption uptakes in binary systems exceed 130 mg g−1 for AR88 (167.7 MgO-SBNs, 132.93 NiO-SBNs, and 178.5 mg g−1 NiO-MgO-SBN), while it reached an uptake of 76.2 MgO-SBNs, 81.5 NiO-SBNs, and 94.7 mg g−1 NiO-MgO-SBNs for MB within the time needed to reach equilibrium (10 min). The adsorption of these two molecules in binary systems showed a synergistic effect onto the three types of SBNs, that enhanced the adsorption uptakes. Computational modeling confirmed the synergistic effect, the adsorption energy of binary systems was lower than that in single systems. Regeneration study was conducted over four adsorption cycles to confirm the sustainability of SBNs. They were stable under thermal oxidation at 400 °C, without any impact on the adsorption capacity.
1. Introduction
Water consumption is dramatically increasing worldwide. Growing global population, climatic factors, and shortage of freshwater supplies place economic and political ramifications.1–3 An increase of one-third of water demand is expected by around 2050.1 Hence, water shortage is increasingly becoming a challenge that the humankind must confront.2 New technological solutions for water and wastewater treatment, should be addressed to avert water crisis in the foreseeable future. Currently, many physical, chemical, and biochemical processes are developed to treat wastewater.4 Nanotechnology, for instance, drew considerable potential for wastewater treatment in recent decades.5–7 Recently, nanomaterials are gaining intense attraction owing to their exceptional chemical and physical properties such as large surface area-to-volume ratio and active surface sites.7–12 To this end, engineered nanomaterials for wastewater treatment is addressing incredible advances in adsorptive and catalytic behaviours toward contaminants sequestration and/or degradation. The treatment of wastewater from dyeing industries by adsorption is also getting more attention in the literature.13–18 Different adsorption parameters are usually considered to come up with optimized conditions. These factors include pH values, agitation time, temperature, adsorbent dosage, initial dye concentration, sonication time, particle size, and regeneration of nanoparticles.19–23 The adsorption capacities of the different types of nanoparticles are extensively reported.24 Experimental competitive adsorptive behaviour of methylene blue (MB) and safranin-O (SO) from binary solutions using Fe3O4 nanoparticles was examined by Ghaedi et al.25 The adsorption capacity was between ∼89.2–92 mg g−1 and presented by the Extended-Freundlich model. Another study presented the adsorption of brilliant green (BG) and malachite green (MG) onto Mn-doped Fe3O4-nanoparticle-loaded activated carbon described by the Langmuir isotherm model with comparable adsorption capacities for both dyes.26 The adsorption of ternary dyes mixtures of BG, MB, and crystal violet (CV) using MnO2 nanoparticle-loaded activated carbon was inspected under certain optimal conditions.27 In conclusion, the nanoadsorbents in the recent years showed unprecedented efficiencies in adsorbing the organic pollutants, in conjunction with generating small amounts of solid wastes.28–31 Therefore, it is important to study, develop, and test many adsorbents for the competitive adsorption, to mimic real cases and understand the adsorption mechanism.32
Something else of note, computational modeling methods are nowadays used to simulate the molecular structures at the quantum chemical levels.33 Those methods could help in avoiding the costly dead ends, by predicting the relevant condensed-phase properties.34 They can be used to accurately estimate many molecular parameters, such as confirmations, molecular structures, interactions, fluctuations, and the overall dynamics of the individual atoms.35,36 This kind of studies will drastically help in getting some insights about the molecular interaction and the adsorptive behaviour of the organic molecules under investigation of the nanoparticles. Also, they will help in understanding the adsorption mechanism. This study will be focusing particularly on low index planes including non-polar and polar surfaces. Herein, MB and acid red 88 (AR88) are cationic and anionic model molecules, respectively. They are highly water-soluble and used as colouring agents, and they might be found in textile wastewater. Silica-embedded NiO and/or MgO nanoparticles are proven to be efficient nanoadsorbents and nanocatalysts (nanosorbcats)37,38 for some organics removal exemplified by methylene blue MB, neutral red (NR), and acid red 27 (AR27).39,40 Also, they showed high stability and regeneration processes.41
This study aims at investigating the competitive adsorption of binary aqueous mixtures of MB and AR88 using in-house prepared silicate-based NiO and/or MgO nanosorbcats (herein after named as SBNs); experimentally and computationally. In fact, the literature review showed that binary adsorption systems are more complicated to be understood and described. This study highlights the synergistic behaviour of AR88 and MB in binary solution, thus understanding the adsorption mechanism and interactions between both organics is of paramount importance. The mechanistic insights of these molecules' interactions with the surface of SBNs, experimentally and computationally, are to be addressed. The adsorption interactions were investigated computationally in single and binary systems and compared. Subsequently, the adsorption isotherms are presented. Also, the adsorptive removal percentages at different pH values are reported. The molecular structure adsorption simulation is presented in the computational modeling study. On the other hand, the adsorption kinetics is examined. Eventually, the successful regeneration of the silica-embedded NiO and/or MgO nanosorbcats is considered.
2. Materials and methods
2.1 Chemicals and reagents
In a typical preparation of silicate-embedded NiO and/or MgO nanosorbcats (SBNs), the following chemicals and reagents were used; nickel nitrate (Ni(NO3)2·6H2O, 99.99%), magnesium nitrate (Mg(NO3)2·6H2O, 99.99%), ammonium hydroxide (NH4OH, 25% (w/w)), nitric acid (HNO3, 99.99% (w/w)), Ludox AS-40 colloidal silica (SiO2, 40% (w/w)), all purchased from Sigma-Aldrich (Haifa) via local sub-vendor BioTech Medical Supplies (Ramallah, Palestine). A granulated household sucrose (C12H22O11) was also used. For the pH effect experiments, NH4OH and acetic acid (CH3COOH, 25% (w/w)), purchased from the same source, were used. All these chemicals were used as received without any further purification.
2.2 Adsorbates
A cationic model molecule, methylene blue (MB, C16H18ClN3S, Mw = 317.85 g mol−1, λmax = 664 nm) and an anionic model molecule acid red 88 (AR88, C20H13N2NaO4S, Mw = 400.38 g mol−1, λmax = 504 nm), supplied from same above source, were chosen without further purification to be the source of the organics for this competitive adsorption study.
2.3 Nanosorbcats and its characterization
The preparation of the SBNs was according to previous works.40,42 The source of the silica was from Ludox AS-40 colloidal silica for all types of SBNs. These in-house prepared SBNs were employed for the removal of organic model molecules from wastewater in single and bi-solution systems. Before any adsorption experiment, surface area, particle size, and structure of SBNs were measured. The Langmuir adsorption isotherms for N2 (99.999%) were obtained using an Accelerated Surface Area & Porosimetry System 2020 (ASAP) supplied by Micromeritics Instruments Inc. Temperature control was achieved through the use of liquid N2 (−195.8 °C). The sample was heated up to 150 °C before running under N2. The Langmuir surface area values were calculated. In addition, X-ray diffraction (XRD) measurements were performed using a Rigaku MINIFLEX II X-ray instrument at room temperature (reflection mode at 30 kV and 15 mA using Cu Kα radiation). The scan was performed in the 2θ range of 20–90° using a 0.02° step and a counting time of 2° per min. The XRD patterns (Fig. 1) of NiO-SBNs, MgO-SBNs, and NiO-MgO-SBNs match with periclase PDF 45-0946 and bunsenite PDF 01-075-0269. The results for the Langmuir surface areas and the estimated crystalline domain sizes for the SBNs are listed in Table 1. Further and comprehensive characterizations of our prepared SBNs and their compositions can be found in our earlier work.40
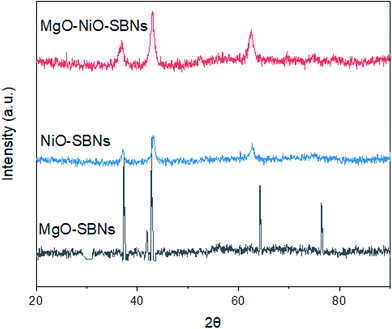 |
| | Fig. 1 X-Ray diffraction powder patterns of SBNs. | |
Table 1 Langmuir surface areas and crystalline domain sizes of SBNs
| |
NiO-SBNs |
MgO-SBNs |
NiO-MgO-SBNs |
| Langmuir surface area (m2 g−1) |
47.1 ± 0.9 |
31.3 ± 0.5 |
39.7 ± 0.6 |
| Estimated crystalline domain size (nm) |
57 ± 1.3 |
50 ± 1.6 |
33 ± 1.0 |
2.4 Adsorption experiments
2.4.1 pH effect. The pH of the aqueous solution plays an important role in many adsorption processes, especially on the saturation adsorption capacity of the adsorbent.43 Therefore, the possible effect of varying the pH on the adsorption efficiency of AR88 and MB in the binary solution was studied. The pH effect was tested at SBNs dose of 25 mg at room temperature. The initial concentration for each model molecule was 200 mg L−1 while fixing the other competent molecule at 50 mg L−1. The pH of the binary solution samples was controlled by adding amounts of diluted NH4OH and CH3COOH to change the pH value. The adsorptive removal percentages (R%) at different pH values ranged from 4 to 11 were obtained from eqn (1).| |
 | (1) |
where Co is the initial concentration of the organic (mg L−1); Ce is the equilibrium concentration of the adsorbate in the solution (mg L−1).
2.4.2 Adsorption isotherms. Several parameters affect the adsorption uptake such as; the adsorbent amount and its particle size, the initial concentration of the adsorbate, the medium temperature, the pH of the system, and contact time.44–46 Adsorption tests of MB and AR88 organic model molecules onto the in-house prepared SBNs, were carried out in batch mode experiments for both single and binary studies at ∼25 °C and optimized pH. For single systems, 25 mg of SBNs were added to a set of vials containing 5 mL solutions at different initial concentrations of MB or AR88. The vials were tightly sealed to avoid any loss of water. Two sets of solutions were prepared for the binary adsorption study. The first one was prepared by fixing the concentration of MB at 50 mg L−1 and varying the AR88 concentrations from 10 to 500 mg L−1. While the other set was undertaken by changing the MB concentrations from 10 to 500 mg L−1 at a constant AR88 concentration of 50 mg L−1. Adsorption took place by shaking the vials for 2 h on a shaker (Grant OLS200 Orbital Shaking Water Bath, Grant Instruments, Cambridge, UK) to ensure that the equilibrium was attained. Then, the vials were placed in a centrifuge at 3000 rpm for 10 min, to separate the SBNs with the adsorbed organics from the mixture. The spent SBNs were taken for Fourier-transform infrared spectroscopy (FTIR) tests, while the supernatant was decanted and investigated by using UV-visible spectrophotometer (Genesys 10S, Thermo Scientific Instruments Canada Inc., Mississauga, ON) to quantify the amount adsorbed and to verify the adsorption happenings on the surfaces of the SBNs. The experimental data were fitted using the Sips, Freundlich and Langmuir isotherm models for the single adsorption case. While the Extended-Sips model was used for binary systems. The adsorption isotherm models are summarized in the ESI, Table S1.† The Extended-Sips isotherm shown below was used to fit the experimental isotherm data for binary systems: | |
 | (2) |
where Qm is the maximum adsorbed amount (mg g−1); Qe is the adsorption capacity at equilibrium (mg g−1); Ks is the Sips adsorption equilibrium constant (L mg−1) and ns is the Sips constant (unitless).The non-linear Chi-square (χ2) analysis was used to evaluate the goodness of the fittings. All isotherm model parameters and the χ2 analysis were performed using Excel 2016 software. The χ2 values were obtained using the following equation;47
| |
 | (3) |
where
Qe and
Qe(model) are the equilibrium maximum uptake obtained experimentally and by model fitting (mg g
−1), respectively.
2.4.3 Kinetics study. To verify the time required to reach equilibrium, the adsorption kinetics of the two organic model molecules (MB and AR88) in the binary solution were investigated. This was carried out by conducting experiments at a fixed initial concentration of the investigated organic in the binary solution at 100 and 50 mg L−1 for the other competent organic model molecule. The rate of removing the MB and AR88 from the wastewater samples was determined at a neutral pH of 7.0 ± 0.1 and constant room temperature.
2.5 Fourier-transform infrared spectroscopy (FTIR)
A Nicolet iS5 FT-IR Spectrometer instrument (Thermo Scientific Instruments) with iD3 ATR accessory plates and DTGS KBr detector, was used to study the mid-infrared region before and after adsorption to infer and investigate the interaction of MB and AR88 with the prepared SBNs. The spectra were recorded from 400 to 4000 cm−1 with resolutions of 8 cm−1 and 16 scans for each spectrum.
2.6 Computational modeling
To understand the adsorption mechanism and the interaction between the molecules and adsorbents' surfaces, computational modeling was conducted on Acclerys Material Studio Software48 for both AR88 and MB model molecules in single and binary cases. Forcite was used to optimize the structure geometry, and the condensed-phase optimized molecular potentials for atomistic simulation studies (COMPASS) forcefield calculations were selected and put on fine precision. The ultimate goal from these calculations is to reach experimentally comparable precision in predicting molecular properties in isolation as well as in condensed phases. The same procedure was applied to optimize NiO and MgO surfaces, where electrostatic forces and van der Waals forces were set to on atom-based calculations.49 The chemical structures as well as the optimized CPK of MB and AR88 are shown in Fig. 2.
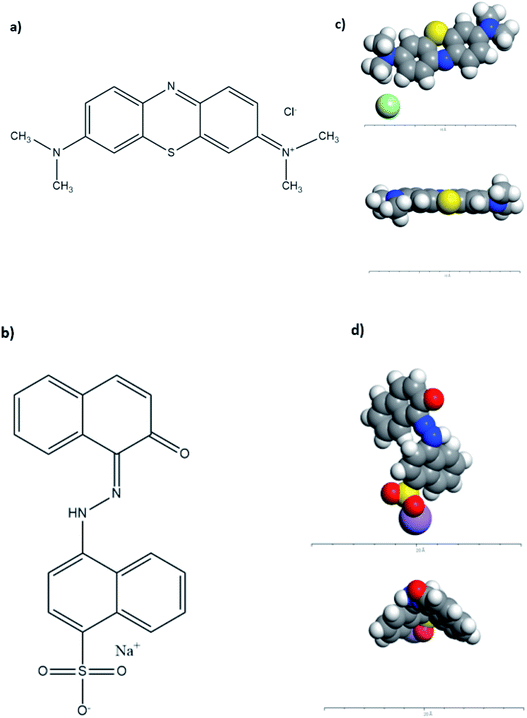 |
| | Fig. 2 Chemical Structure of (a) MB and (b) AR88; CPK representation of the optimized (c) MB molecule (top and side views, respectively) and (d) AR88 (top and side views, respectively). Grey atoms represent carbon, blue atoms represent nitrogen, white atoms represent hydrogen, yellow atoms represent sulphur, purple atoms represent sodium, and light green atoms represent chlorine. The geometry optimization in forcite was set to fine and the forcefield to COMPASS.40,48 | |
2.7 Regeneration of spent SBNs
Desorption of MB and AR88 in the binary solution from the loaded nanosorbcats was performed to get rid of all the organic matter that is captured on the SBNs surfaces. This was done by thermal oxidation of the spent SBNs to 400 °C in Multi Stage BIFA Laboratory Furnace MS8-62 for 3 hours at a heating rate of 10 °C min−1. The regenerated SBNs were employed for the adsorptive of MB and AR88 in the binary solution at a pH of around 7 and a temperature of 25 °C. The initial concentrations of MB and AR88 in the aqueous solution were 100 mg L−1 for both of them. The reliability of the regeneration of SBNs was investigated by calculating R% after four adsorption cycles to confirm the sustainability of the SBNs.
2.8 Measurements of organics uptake
UV-vis spectrophotometer was used to detect the residual organic amounts in the aqueous solutions after adsorption. The analysis of the remnant organics in the binary solution was undertaken by measuring the absorbance and then by applying the following equations:50,51| |
 | (4) |
| |
 | (5) |
where CA and CB (mg L−1) are the concentrations of organics in the binary solution, kA1 and kA2 are the slopes of the calibration curves of MB at the maximum wavelengths (λmax) of 664 and 504 nm, respectively, while kB1 and kB2 refer to the slopes of the calibration curves of AR88 at the same wavelengths, respectively. In addition, A1 and A2 (unitless) are the absorbance of MB and AR88 in the binary solution at λmax of each model molecule. The calibration curve slopes are listed in Table 2. As seen, the calculated correlation coefficient (R2) values, were higher than 0.98 indicating the stability and accuracy of both calibration curves for MB and AR88.
Table 2 Calibration curve slope constants of the binary solution of MB and AR88
| MB |
AR88 |
| kA1 |
kA2 |
kB1 |
kB2 |
| 0.2802 |
0.0162 |
0.0045 |
0.0373 |
| R2 |
| 0.992 |
0.985 |
0.991 |
9.989 |
3. Results and discussion
3.1 pH effect
The removal percentage related to the initial concentration of AR88 and MB values in the binary solution at different pH values are depicted in Fig. 3. It was found that in the case of the adsorption in the binary solution of 200 mg L−1 MB with 50 mg L−1 AR88 onto the in-house prepared SBNs (Fig. 3, the blue curves), the R% of MB increases from 77 to 82%, 77 to 87% and 77 to 89% for MgO-SBNs, NiO-SBNs, and NiO-MgO-SBNs, respectively, as pH values increase from 4 to 11. This is due to the electrostatic forces of attraction which can be enhanced as the surface of adsorbent becomes negatively charged. Subsequently, an improvement on the adsorptive capacity of SBNs occurs on the positively charged MB cations.43 Conversely, in the case of 200 mg L−1 AR88 with 50 mg L−1 MB (Fig. 3, the red curves), the R% decreases with increasing the pH from 4 to 11. It was noted that the drop in the R% was from 97 to 87% for MgO-SBNs, 89 to 59% for NiO-SBNs and from 96 to 81% when the nanosorbcats are NiO-MgO-SBNs. The electrostatic interaction between the protonated groups of carbon and acidic organics occurs. Consequently, the number of negatively charged sites increases and thus, the negatively charged surface site on the adsorbent does not favour the adsorption of anion organics due to the electrostatic repulsion.52,53 The optimum performance was found to be at pH around 7 for MgO-SBNs and NiO-MgO-SBNs, and about 8 for NiO-SBNs. The optimum nanosorbcats were found to be the mixed ones, i.e., NiO-MgO-SBNs, of which the removal percentages were maintained at around 92% and 86% for AR88 and MB, respectively. This could be attributed to the synergistic effect of those nanosorbcats. Recent studies have observed similar effects of varying the pH on adsorption uptake of cationic and anionic organics in single and binary systems.54–58
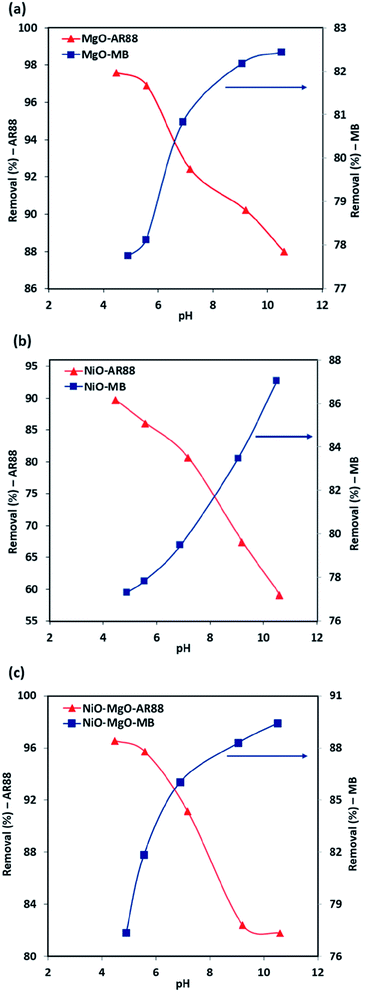 |
| | Fig. 3 The pH effect in the binary solution adsorption system for (a) MgO-SBNs, (b) NiO-SBNs, and (c) NiO-MgO-SBNs. Experimental conditions are: SBNs dose, 25 mg; contact time, 120 min; temperature, 25 °C; initial concentrations, 200 and 50 mg L−1 for the investigated organic with the other competent organic, respectively. The symbols are experimental data of the AR88 and MB removal percentages. | |
3.2 Binary adsorption isotherms
The Extended-Sips isotherm model illustrated previously by eqn (2), was used in the description of the AR88 and MB equilibrium in the binary solution adsorption system. This model was chosen based on a comparison of the calculated χ2 values of the Langmuir, Freundlich, and Sips models in the aforementioned single adsorption (results can be found in the ESI, Table S2†). The Sips model and Extended-Sips equilibrium parameters are listed in Table 3. Additionally, Fig. 4 shows the obtained experimental isotherm data along with the Extended-Sips model for the adsorptive removal of MB and AR88 molecules in the binary solution onto MgO-SBNs, NiO-SBNs, and NiO-MgO-SBNs at ambient room temperature of 25 °C. The adsorption uptake of AR88 in the binary solution onto MgO-SBNs as shown in Fig. 4a is greater than the uptake for MB molecules, suggesting the higher adsorption affinity for AR88. On the other hand, as anticipated in Fig. 4b and c, the adsorption of MB and AR88 onto NiO-SBNs and NiO-MgO-SBNs in the binary solution increased sharply at low equilibrium concentration and gradually increased at high concentrations, suggesting that both SBNs have high adsorption affinities toward MB and AR88 molecules. Interestingly, the adsorption of the binary system of organic AR88 and MB substances onto the SBNs was enhanced compared to that in the single adsorption system. Saturation uptake capacities of both organics were increased. In addition, the enhancement was visually observed by comparing the colour of the supernatant solution after 10 minutes of adsorption at pH of 7.0 in the single and the binary systems. In other words, the adsorption of the anionic and cationic organics in the multi-component system showed a synergistic effect, which leads to the enhancement in the uptake capacities for all SBNs. Also, it was noted that the heterogeneity factor (ns) decreased compared to that in the single adsorption system. As a result, the adsorption of the other organic onto the surface of the SBNs was enhanced. The affinity (Ks) values for the MB and AR88 in the binary system had mostly decreased compared to that in the single system (Ks). This indicates that the surface affinity of the nanoadsorbent had changed as a result of the presence of the other organic molecules. Such observations are important when it comes in real wastewater effluents, i.e., SBNs can remove both pollutants with different degrees of competition between the cationic and anionic organic molecules. Meanwhile, the Ks values of adsorption of MB molecules onto NiO-SBNs and NiO-MgO-SBNs were higher to that for single MB. Thus, the NiO-SBNs and NiO-MgO-SBNs favour adsorbing the MB molecules. Besides, it was obviously observed that the blue colour caused by MB molecules has almost disappeared, while the red one caused by AR88 in the NiO-SBNs and NiO-MgO-SBNs adsorption tests remained in the solution. Nevertheless, the value of Ks for AR88 was higher than it for MB when MgO-SBNs used. So, the MgO-SBNs prefer adsorbing the anionic over the cationic organic molecules. This concludes the favourability of our NiO-SBNs and NiO-MgO-SBNs to adsorb the MB over AR88 molecules and vice versa in the case when the nanoparticles are MgO-SBNs.
Table 3 Estimated single and binary adsorption isotherm parameters of the Sips and Extended-Sips model, respectively
| Model molecule |
SBNs |
Single |
Binary |
| Qm (mg g−1) |
Ks (L mg−1) |
ns (unitless) |
Qm (mg g−1) |
Ks (L mg−1) |
ns (unitless) |
χ2 |
| AR88 |
MgO |
147.2 |
0.0071 |
0.69 |
167.7 |
0.00507 |
0.67 |
0.05490 |
| NiO |
111.1 |
0.0039 |
0.66 |
132.93 |
0.00197 |
0.59 |
0.01402 |
| NiO-MgO |
137.7 |
0.0005 |
0.40 |
178.5 |
0.00201 |
0.36 |
0.03850 |
| MB |
MgO |
56.6 |
0.0111 |
0.80 |
76.2 |
0.00353 |
0.63 |
0.00130 |
| NiO |
69.4 |
0.0091 |
0.51 |
81.5 |
0.00346 |
0.46 |
0.00341 |
| NiO-MgO |
81.4 |
0.0164 |
0.57 |
94.7 |
0.00805 |
0.53 |
0.00450 |
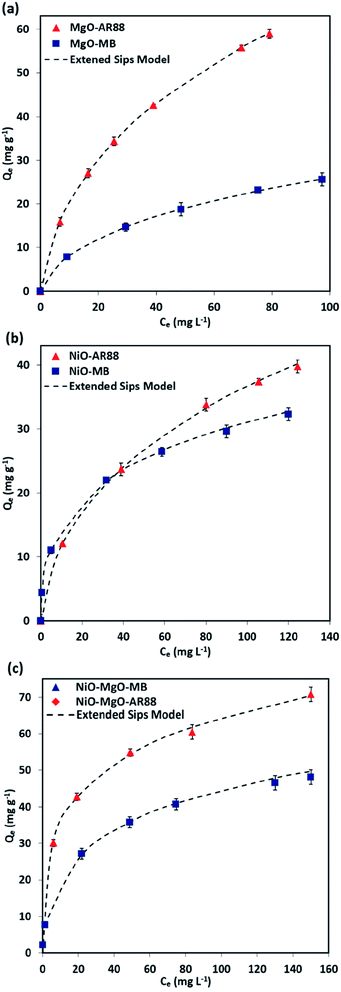 |
| | Fig. 4 Macroscopic binary solution phase adsorption isotherm of MB and AR88 onto (a) MgO-SBNs, (b) NiO-SBNs, and (c) NiO-MgO-SBNs nanosorbcats. Experimental conditions are: SBNs dose, 5 g L−1; contact time, 120 min; temperature, 25 °C; and pH, 7.0. The symbols are experimental data, and the solid dashed lines are the Extended-Sips model. | |
Also, the UV-visible spectra ranging from 400 to 800 nm, and digital photographs before and after adsorption of MB and AR88 in single and binary systems showing the colour change are shown in Fig. 5. The synergistic effect and the enhancement were confirmed by comparing the single and binary solution samples at same adsorption conditions. The adsorption experiments were done at a constant temperature of 25 °C, SBNs dose of 25 mg, 5 mL solution volume and pH of 7.0. As seen, in the case of single adsorption (Fig. 5a and b), a higher leftover amount remains in the aqueous solutions. This demonstrates the synergistic effect and the strong adsorbability of SBNs to these organics in the binary solution, in which the latter became colourless (Fig. 5c and d), especially with NiO-SBNs for MB and NiO-MgO-SBNs for AR88.
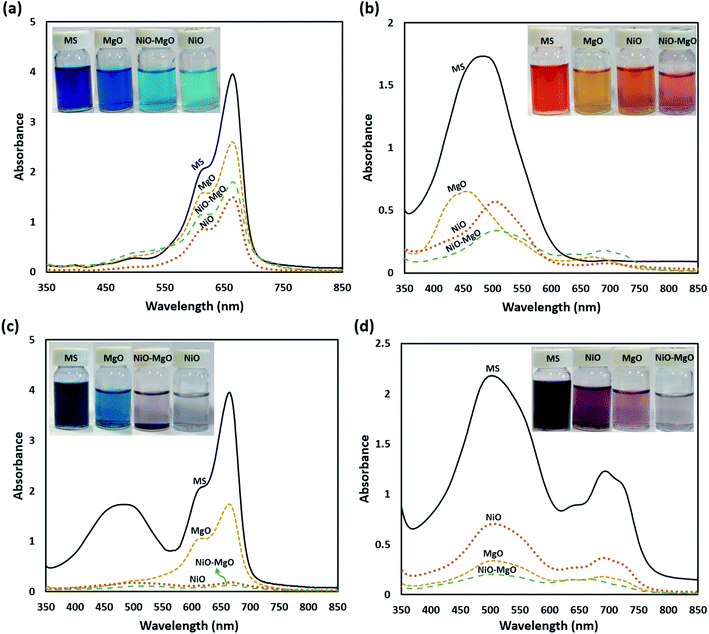 |
| | Fig. 5 The UV-vis absorption spectra and the digital images of the aqueous solutions for single systems; (a) 100 mg L−1 of MB, (b) 100 mg L−1 of AR88, and for binary systems; (c) 100 MB + 50 AR88 mg L−1 and (d) 100 AR88 + 50 MB mg L−1. The labelling shown are: MS refers to the mother solution containing the model molecules before any adsorption, while the photos after adsorption using the nanosorbcats are: MgO-SBNs, NiO-MgO-SBNs, and NiO-SBNs. | |
It is important to check the competency of our in-house prepared SBNs with other nanoadsorbents reported in the literature. Thus, Table 4 lists the adsorption saturation capacities, surface areas of the nanoadsorbents, concentration ranges of the adsorbates, and the contact times of previously reported adsorbents in comparison with our SBNs for the adsorptive removal of MB and AR88 organic model molecules. Interestingly, the maximum adsorption capacities in the multi-component adsorption systems of our SBNs were higher than those reported adsorbents in binary and single systems. While in the case of MB, our SBNs have also shown a superb performance, of which our SBNs adsorption capacities were higher than the majority of the other reported nanoadsorbents. Also, it is worth mentioning here that our SBNs showed very fast kinetics in comparison with other conventional nanoadsorbents, of which the equilibrium can be reached within 5 min. This indicates and suggests that our in-house prepared nanosorbcats are suitable to be used as promising nanoadsorbents for the adsorptive removal of such organic molecules.
Table 4 Comparison of different adsorbents toward the adsorptive of cationic and anionic organic dyes; MB and AR88
| Adsorbent |
Adsorbate |
Surface area (m2 g−1) |
Adsorption capacity (mg g−1) |
Isotherm model |
Temperature |
pH |
Concentration range (mg L−1) |
Contact time |
Reference |
| Exfoliated graphene oxide |
MB |
— |
17.3 |
Langmuir |
— |
— |
— |
— |
59 |
| Polyaniline |
MB |
— |
19.67 |
Langmuir |
28 °C |
— |
— |
90 min |
60 |
| Polypyrrole |
MB |
— |
19.96 |
Langmuir |
28 °C |
— |
— |
120 min |
60 |
| Formaldehyde-treated melon husk |
MB |
395 |
23.67 |
Langmuir |
30 ± 2 °C |
6.5 |
5–100 |
90 min |
61 |
| Congo red composite |
MB |
|
31.44 |
Freundlich |
25 °C |
11 |
3–27 |
30 s |
62 |
| Multiwalled carbon nanotube |
MB |
217 |
77.1 |
Freundlich |
25 °C |
6 |
5–15 |
60 min |
32 |
| Graphite oxide nanoparticles |
MB |
— |
500 |
Freundlich |
25 °C |
7 |
20–75 |
14 min |
63 |
| MgO |
MB |
31.3 |
76.2 |
Sips |
25 °C |
7 |
10–500 |
5 min |
This study |
| NiO |
MB |
47.1 |
81.5 |
Sips |
25 °C |
7 |
10–500 |
5 min |
This study |
| NiO-MgO |
MB |
39.7 |
94.7 |
Sips |
25 °C |
7 |
10–500 |
5 min |
This study |
| Magnetic Fe@graphite nanocomposite |
AR88 |
47 |
41.8 |
Langmuir |
30 °C |
7 |
5–40 |
— |
64 |
| Multiwalled carbon nanotube |
AR183 |
217 |
54.1 |
Freundlich |
25 °C |
6 |
10–50 |
60 min |
32 |
| Magnetic multi-walled carbon nanotubes |
AR88 |
38.7 |
54.4 |
Freundlich |
30 °C |
7 |
10–58 |
100 min |
65 |
| Azolla rongpong |
AR88 |
— |
81.3 |
Langmuir |
30 °C |
2.5 |
100–1000 |
— |
66 |
| Magnetic ZnFe2O4 nanoparticles |
AR88 |
139 |
111.1 |
Langmuir |
30 °C |
7 |
10–56 |
340 min |
67 |
| Alunite |
AR88 |
— |
832.81 |
Langmuir |
25 °C |
2 |
— |
50 min |
68 |
| MgO |
AR88 |
31.30 |
167.7 |
Sips |
25 °C |
7 |
10–600 |
5 min |
This study |
| NiO |
AR88 |
47.1 |
132.93 |
Sips |
25 °C |
7 |
10–600 |
5 min |
This study |
| NiO-MgO |
AR88 |
39.7 |
178.5 |
Sips |
25 °C |
7 |
10–600 |
5 min |
This study |
3.3 Adsorption followed by FTIR
The FTIR analysis before and after the adsorption of the organic molecules onto the SBNs is illustrated in Fig. 6. The IR spectrum of the virgin SBNs before adsorption of any substance was previously reported and discussed elaborately in previous work.40 Fig. 6 shows the signals of the framework region for the MgO-SBNs, NiO-SBNs, and NiO-MgO-SBNs after the adsorption of the organics. The framework region was found to be from around 500 to 1900 cm−1. Modifications on original SBNs signals appeared due to the adsorption of MB and AR88 molecules. The modification of the spectrum from around 600 to 700 cm−1 could be assigned to a C–S stretching vibration as a result of the adsorption of MB.69 While the modifications on the IR signals at 1247 and 1370 cm−1 might be corresponding to N![[double bond, length as m-dash]](https://www.rsc.org/images/entities/char_e001.gif) N and the SO3 asymmetric stretching vibrations confirming the adsorption of AR88.69 Also, the adsorption of the organics in the aqueous solution have shifted the signals with different intensities from around 500 to 1000 supporting the adsorption.69 The modification on the spectrum of the spent SBNs at the regions of C–S, N
N and the SO3 asymmetric stretching vibrations confirming the adsorption of AR88.69 Also, the adsorption of the organics in the aqueous solution have shifted the signals with different intensities from around 500 to 1000 supporting the adsorption.69 The modification on the spectrum of the spent SBNs at the regions of C–S, N![[double bond, length as m-dash]](https://www.rsc.org/images/entities/char_e001.gif) N, and the SO3 was symmetric. Accordingly, the adsorption of MB and AR88 model molecules onto the surface of the three in-house prepared SBNs is confirmed.
N, and the SO3 was symmetric. Accordingly, the adsorption of MB and AR88 model molecules onto the surface of the three in-house prepared SBNs is confirmed.
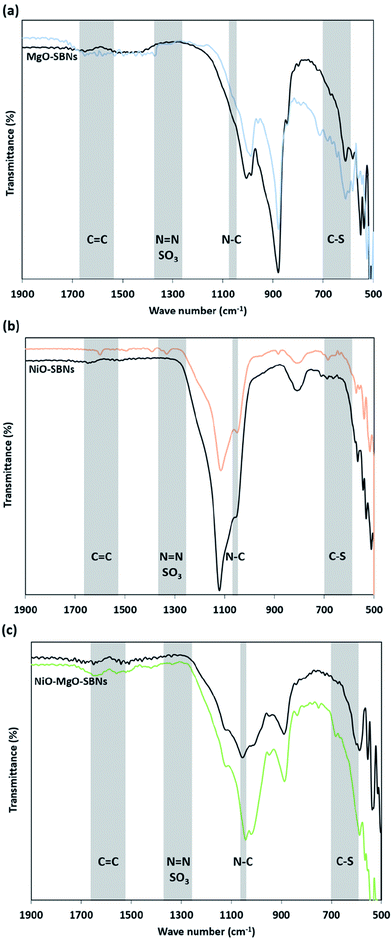 |
| | Fig. 6 FTIR spectra for MB and AR88 adsorption in the binary solution onto (a) MgO-SBNs, (b) NiO-SBNs and (c) NiO-MgO SBNs, respectively. The black spectrum refers to the virgin SBNs, while the coloured spectrum refers to the spent SBNs after adsorption of organics in the binary solutions. The shaded regions represent the possible attached functional groups. | |
3.4 Adsorption kinetics
The results of the change in the concentration of AR88 and MB at predetermined time intervals onto our prepared SBNs are shown in Fig. 7. As seen, the concentration of the MB and AR88 decreased rapidly during the first 5 min and remain approximately constant after 10 min of contact, suggesting that the equilibrium can be nearly reached within 10 min of contact time. This feature is significant for any futuristic scaled-up continuous packed-bed process. This fast kinetics can be due to the nonporous structure of the synthesized nanoparticles, of which the external adsorption is dominant, and no intraparticle diffusion to slow the rate of adsorption.44 It is known that the adsorption of the molecules onto a nonporous adsorbent occurs in three steps: (1) bulk diffusion of the molecules into the solution; (2) diffusion into a film layer surrounding to the adsorbent surface; and (3) adsorption of the molecules onto the adsorbent active sites.70 During the adsorption of the model molecules onto the SBNs, good shaking was ensured, and thus, the adsorption kinetics was only affected by the film diffusion, of which it can be considered as the rate-limiting step in the kinetic study. Hence, the kinetics data were fitted and delineated using the external mass transfer model;44| |
 | (6) |
where Km is the external mass transfer coefficient in the liquid phase (m min−1); a is the specific surface area per the volume of the adsorbent (m2 m−3); C is the concentration of the model molecules (mg L−1) at any time; and Cs is the concentration of the molecules at the interface with the adsorbent (mg L−1). The value of Cs can be determined from reforming the Sips model parameters in ESI (Table 1†), as shown below;| |
 | (7) |
 |
| | Fig. 7 Adsorption kinetics of MB and AR88 in binary adsorption system onto (a) MgO-SBNs, (b) NiO-SBNs, and (c) NiO-MgO-SBNs. Experimental conditions are: SBNs dose, 5 g L−1; contact time, 60 min; temperature, 25 °C; and pH, 7.0. The symbols are experimental data, and the solid dashed lines are the external mass transfer model. | |
Q was obtained from the below mass balance equation:
| |
 | (8) |
By substituting eqn (7) and (8) into (6), the following first order differential equation was obtained:
| |
 | (9) |
This ordinary differential equation can be solved at initial conditions of C = Co at time zero. It is worth noting here that the Sips constants can be obtained from the adsorption isotherm study for the multi-component organic pollutants system determined in Table 3. Polymath 6.10 software was used to estimate the Kma (min−1) values for the three types of nanosorbcats by fitting the experimental data to the eqn (9). Fig. 7 describes the kinetics of the binary systems adsorption onto our prepared SBNs. The experimental data were well expressed by the extended mass transfer model. The estimated Kma values for both organics model molecules in the binary systems were illustrated in Fig. 8. By comparing the values of Kma in the binary solution of MB ranging from 0.85 to 1.06, and AR88 from 0.5 to 0.68, it is obvious that the SBNs prefer adsorbing the MB over AR88 molecules, whereas, the Kma values for MB and AR88 obtained from the external mass transfer model go in line with the previous findings from the Extended-Sips isotherm model, of which the MB molecules have Ks and Kma values higher than that for AR88. Consequently, the affinity explained previously in the binary adsorption experiment of the SBNs towards the adsorption of the cationic over the anionic surfaces is affirmed.
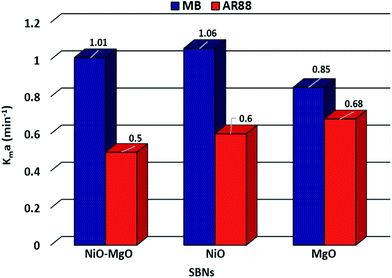 |
| | Fig. 8 The estimated Kma (min−1) values for MB and AR88, from left to right respectively, for each type of SBNs. | |
3.5 Computational modeling
The adsorption energies and coordination computational modeling were conducted using the adsorption locator tool of the Material studio 2017.48 Both MgO and NiO (100) surfaces were cleaved at 5 Å and 20.056 Å thickness. The vacuum slap was set up to 30 Å, and the supercell range was put to be 3 nm × 3 nm. In order to get the adsorption energy (kcal mol−1) for the adsorbed AR88 and MB, 4 different computational runs were conducted for each single and binary molecule systems. To mimic the single molecule system, the following experiments were conducted individually: 5 molecules AR88/MgO, 5 molecule MB/MgO, 5 molecules AR88/NiO, 5 molecules MB/NiO. The binary system was simulated using 1![[thin space (1/6-em)]](https://www.rsc.org/images/entities/char_2009.gif) :
:![[thin space (1/6-em)]](https://www.rsc.org/images/entities/char_2009.gif) 4 ratio of the model molecules in one run, as following: 4 molecules AR88 + 1 molecule MB/MgO, 1 molecule AR88 + 4 molecules MB/MgO, 4 molecules AR88 + 1 molecule MB/NiO, and 1 molecule AR88 + 4 molecules MB/NiO. Tables 5 and 6 show the adsorption energy values of MB and AR88 in both single and binary molecules systems. While Fig. 9 and 10 show the lowest adsorption energy molecules configuration on the surface of NiO and MgO for both, single and binary adsorption systems, respectively.
4 ratio of the model molecules in one run, as following: 4 molecules AR88 + 1 molecule MB/MgO, 1 molecule AR88 + 4 molecules MB/MgO, 4 molecules AR88 + 1 molecule MB/NiO, and 1 molecule AR88 + 4 molecules MB/NiO. Tables 5 and 6 show the adsorption energy values of MB and AR88 in both single and binary molecules systems. While Fig. 9 and 10 show the lowest adsorption energy molecules configuration on the surface of NiO and MgO for both, single and binary adsorption systems, respectively.
Table 5 The highest and lowest adsorption energies (kcal mol−1) of single component systems on NiO (100) and MgO (100) surfaces
| |
5 MB |
5 AR88 |
5H2O molecules |
| MgO (100) |
| Lowest adsorption energy (kcal mol−1) |
−962.94 |
−2132.20 |
−240.17 |
| Highest adsorption energy (kcal mol−1) |
−767.19 |
−2095.74 |
−105.24 |
![[thin space (1/6-em)]](https://www.rsc.org/images/entities/char_2009.gif) |
| NiO (100) |
| Lowest adsorption energy (kcal mol−1) |
−385.26 |
−1263.12 |
−160.85 |
| Highest adsorption energy (kcal mol−1) |
−351.35 |
−1245.53 |
−90.53 |
Table 6 The highest and lowest adsorption energies (kcal mol−1) of each molecule adsorbed on NiO (100) and MgO (100) surfaces from binary systems (1 AR88 + 4 MB and 4 AR88 + 1 MB)
| |
MB (1 AR88 + 4 MB) |
MB (4 AR88 + 1 MB) |
AR88 (1 AR88 + 4 MB) |
AR88 (4 AR88 + 1 MB) |
| MgO (100) |
| Lowest adsorption energy (kcal mol−1) |
−1098.06 |
−1288.59 |
−3317.05 |
−2409.22 |
| Highest adsorption energy (kcal mol−1) |
−954.00 |
−1362.10 |
−2390.32 |
−2256.12 |
![[thin space (1/6-em)]](https://www.rsc.org/images/entities/char_2009.gif) |
| NiO (100) |
| Lowest adsorption energy (kcal mol−1) |
−438.05 |
−471.36 |
−1063.36 |
−845.90 |
| Highest adsorption energy (kcal mol−1) |
−393.74 |
−377.24 |
−1014.23 |
−799.38 |
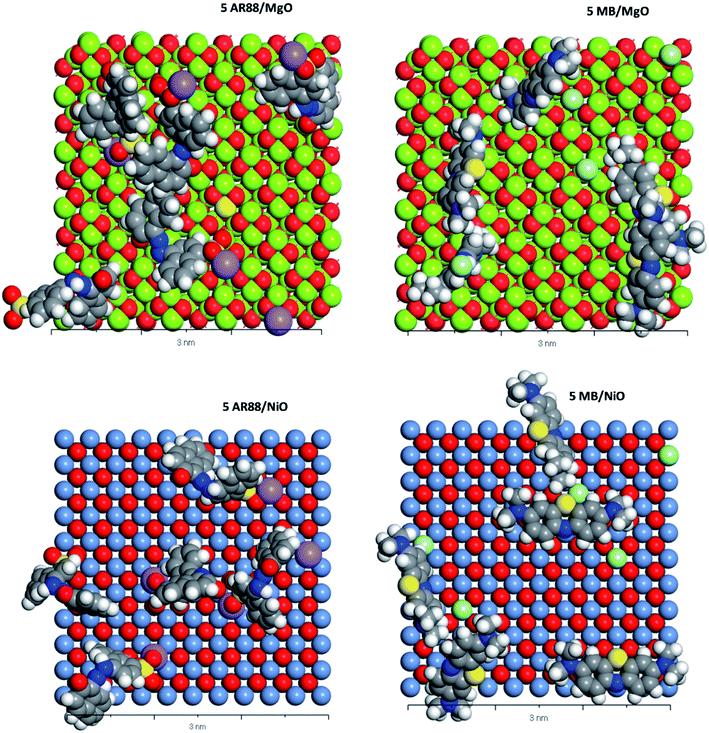 |
| | Fig. 9 CPK representation of the MB and AR88 molecules individual system adsorption on MgO (100) and NiO (100) (Top view, 3 nm scale). Grey atoms represent carbon, blue atoms represent nitrogen, white atoms represent hydrogen, yellow atoms represent sulphur, purple atoms represent sodium, soft green atoms represent chlorine, red atoms represent oxygen, pigeon blue represents nickel. And lime green represents magnesium. | |
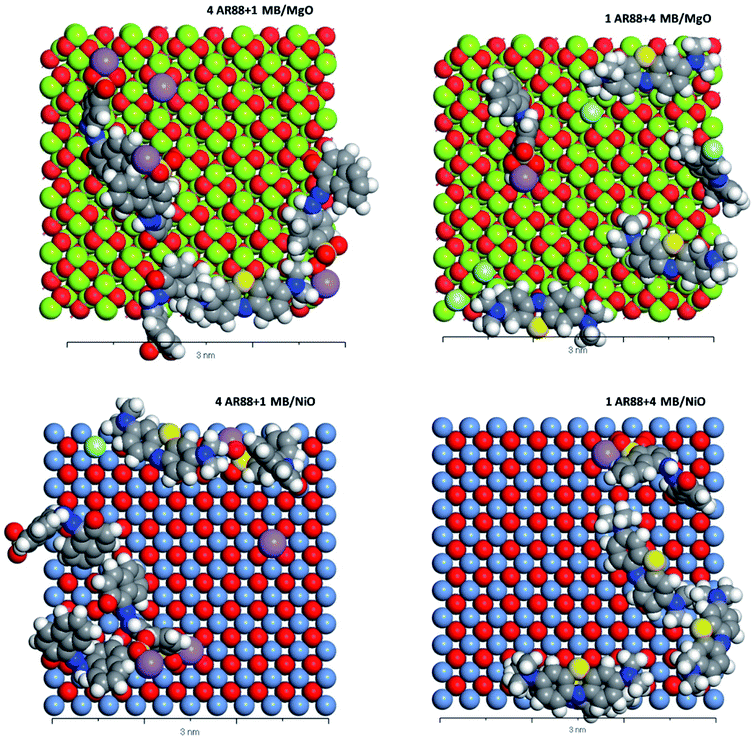 |
| | Fig. 10 CPK representation of the MB and AR88 molecules binary system adsorption on MgO (100) and NiO (100) (Top view, 3 nm scale). Grey atoms represent carbon, blue atoms represent nitrogen, white atoms represent hydrogen, yellow atoms represent sulphur, purple atoms represent sodium, soft green atoms represent chlorine, red atoms represent oxygen, pigeon blue represents nickel. And lime green represents magnesium. | |
Table 5 shows the adsorption energies of both model molecules in single systems. It is obvious from the results that the adsorption energy of AR88 onto both NiO and MgO (100) surfaces is lower than the energy of MB. This high negativity in the adsorption energies of AR88 lead to better adsorption behaviour, which explains the obtained higher experimental adsorption capacities of AR88 compared to MB in both single and binary systems (Table 3). By comparing Tables 5 and 6, it is clear that the adsorption energies of AR88 and MB in the binary systems (1 AR88 + 4 MB and 4 AR88 + 1 MB) are lower than the adsorption energies of the single systems. This explains the higher adsorption capacity Qm, as found experimentally of AR88 and MB in the binary systems over the single component system (Table 3).
Moreover, Fig. 9 shows a slight difference between the adsorption of MB and AR88 onto the MgO and NiO surfaces. Both NiO and MgO tend to adsorb a higher amount of AR88 molecules in both scenarios. This could be attributed to the adsorption direction of MB and AR88. Fig. 9 and 10 show that MB molecules tend to be adsorbed flat on the surface while AR88 was tilted and adsorbed from the side sodium atom which will leave space for more molecules to get adsorbed. The kinetics study (Fig. 7a and b) shows a slight difference on the concentration change of AR88 and MB onto MgO and NiO over the time, of which it was found that the adsorption of MB can reach the equilibrium before AR88 in a very small period of time. This minor speed difference will allow MB molecules to get adsorbed first and flat as shown in Fig. 9 and 10, and receive both AR88 and MB to arrive on the surface. The competitive behaviour appeared in the kinetics clarifies the accessibility of both molecules to reach the metal oxide surface and act as an additional relaxed landing area for the next opposite molecule.71
3.6 Regeneration and sustainability of the SBNs
Regeneration efficiency in terms of R% of the SBNs is presented in Fig. 11. As seen, in the first cycle, there was almost no decrease in adsorption capacities. However, the adsorption capacities slightly declined to around 95% in the last adsorption cycle. This small decrease (4%) in removal efficiency after the regeneration process endorses the stability and sustainability of the SBNs structure under heating up to 400 °C. This temperature is lower than the calcination temperature of 800 °C at which the SBNs were prepared. Therefore, decomposing the adsorbed molecules of MB and AR88 at 400 °C will not affect the structure of the SBNs but it is enough to weaken the bonding between the occupied active sites and the adsorbed model molecules. Similar sustainability of those SBNs nanosorbcats was shown previously within a steam gasification process of adsorbed pollutants from real industrial steam-assisted gravity drainage (SAGD) wastewater effluents.41 Eventually, the adsorption of MB and AR88 in single and binary systems onto the SBNs is sustainable and reversible.
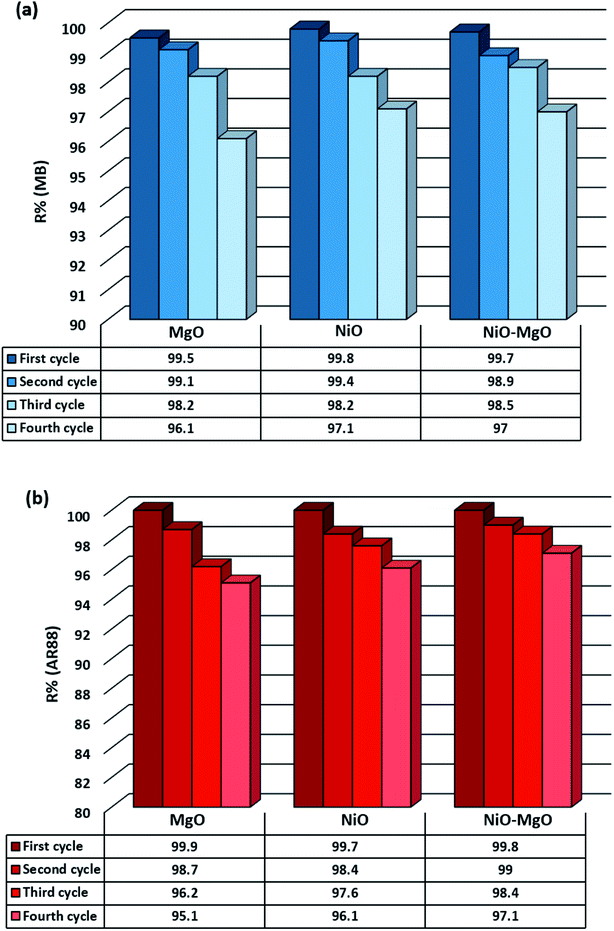 |
| | Fig. 11 Regeneration cycles of SBNs after the adsorption of MB and AR88 in the binary solution system; (a) shows the adsorption efficiency of MB in each cycle, while (b) for AR88. The first through fourth cycles are represented from left to right. | |
4. Conclusions
This study shows that the three types of in-house prepared SBNs, namely: NiO-SBNs, MgO-SBNs, and NiO-MgO-SBNs succeeded in the removal of methylene blue (MB) and acid red 88 (AR88) in a very short time with a very high removal capacity both in single and binary systems. The adsorption and kinetics studies were performed at an optimum pH of around 7 and 25 °C. The kinetics study showed that the equilibrium can be reached within 10 min for AR88 and MB in binary systems. The adsorption isotherms were determined and fitted using the non-linear Sips isotherm model for AR88 and MB, while the non-linear Extended Sips model was used for binary systems. Computational modeling was performed to simulate the experiments and calculate the adsorption energies in each case. It was found that MB molecules tend to be adsorbed flat on the surface while AR88 was tilted and adsorbed from the side sodium atom which will leave space for more molecules to get adsorbed. A synergistic effect was also observed in binary systems leading to a significant enhancement in the adsorption uptakes. The regeneration study indicated that all SBNs can be used repeatedly, without impacting the adsorption capacity, confirming their sustainability. Therefore, the NiO-MgO-SBNs can be recommended as fast, effective and sustainable nanosorbcats for rapid removal of organics in real textile wastewater effluents.
Conflicts of interest
There are no conflicts of interest to declare.
Acknowledgements
The authors are grateful to the deanship of the scientific research at An-Najah National University (ANNU) and the Ministry of Higher Education (MoHE) for the financial support provided through the grant ANNU-MoHE-1819-Sc019. Also, the contribution of facilities from the Department of Chemical Engineering at ANNU. A special thanks to Mr Nafith Dwaikat for the help with the FTIR analysis.
References
- U.-W. United Nations World Water Assessment, The united nations world water development report 2018: nature-based solutions for water, Paris, 2018 Search PubMed.
- S. Postel, The last oasis: facing water scarcity, Taylor and Francis, Hoboken, 2014 Search PubMed.
- M. Barlow and T. Clarke, Blue gold: the battle against corporate theft of the world's water, 2017 Search PubMed.
- G. Crini, E. Lichtfouse, L. D. Wilson and N. Morin-Crini, Environ. Chem. Lett., 2018, 17, 195–213 CrossRef.
- H. Sadegh, G. A. M. Ali, V. K. Gupta, A. S. H. Makhlouf, R. Shahryari-ghoshekandi, M. N. Nadagouda, M. Sillanpää and E. Megiel, J. Nanostruct. Chem., 2017, 7, 1–14 CrossRef CAS.
- K. R. Kunduru, M. Nazarkovsky, S. Farah, R. P. Pawar, A. Basu and A. J. Domb, in Water Purification, ed. A. M.Grumezescu, Academic Press, 2017, pp. 33–74, DOI:10.1016/B978-0-12-804300-4.00002-2.
- Y. Zhang, B. Wu, H. Xu, H. Liu, M. Wang, Y. He and B. Pan, NanoImpact, 2016, 3–4, 22–39 CrossRef.
- M. Cerro-Lopez and M. A. Méndez-Rojas, in Ecopharmacovigilance: Multidisciplinary Approaches to Environmental Safety of Medicines, ed. L. M.Gómez-Oliván, Springer International Publishing, Cham, 2019, pp. 201–219 Search PubMed.
- M. S. Mauter, I. Zucker, F. Perreault, J. R. Werber, J.-H. Kim and M. Elimelech, Nat. Sustain., 2018, 1, 166–175 CrossRef.
- L. Zhang and M. Fang, Nano Today, 2010, 5, 128–142 CrossRef CAS.
- P. Westerhoff, P. Alvarez, Q. Li, J. Gardea-Torresdey and J. Zimmerman, Environ. Sci.: Nano, 2016, 3, 1241–1253 RSC.
- K. Simeonidis, S. Mourdikoudis, E. Kaprara, M. Mitrakas and L. Polavarapu, Environ. Sci.: Water Res. Technol., 2016, 2, 43–70 RSC.
- A. Hosseini-Bandegharaei, J. Fu, A. C. Mitropoulos and G. Z. Kyzas, J. Dispersion Sci. Technol., 2018, 39, 836–847 CrossRef.
- N. Mohammed, N. Grishkewich and K. C. Tam, Environ. Sci.: Nano, 2018, 5, 623–658 RSC.
- M. Y. Nassar, I. S. Ahmed and H. S. Hendy, J. Mol. Liq., 2018, 271, 844–856 CrossRef CAS.
- M. Y. Nassar, E. A. Abdelrahman, A. A. Aly and T. Y. Mohamed, J. Mol. Liq., 2017, 248, 302–313 CrossRef CAS.
- X.-Q. Qiao, F.-C. Hu, F.-Y. Tian, D.-F. Hou and D.-S. Li, RSC Adv., 2016, 6, 11631–11636 RSC.
- X. Qiao, F. Hu, D. Hou and D. Li, Mater. Lett., 2016, 169, 241–245 CrossRef CAS.
- M. Hua, S. Zhang, B. Pan, W. Zhang, L. Lv and Q. Zhang, J. Hazard. Mater., 2012, 211–212, 317–331 CrossRef CAS.
- S. Lata and S. R. Samadder, J. Environ. Manage., 2016, 166, 387–406 CrossRef CAS.
- G. Z. Kyzas and K. A. Matis, J. Mol. Liq., 2015, 203, 159–168 CrossRef CAS.
- A. Kausar, M. Iqbal, A. Javed, K. Aftab, Z.-i.-H. Nazli, H. N. Bhatti and S. Nouren, J. Mol. Liq., 2018, 256, 395–407 CrossRef CAS.
- D.
J. Borah, P. Das and M. R. Das, Desalin. Water Treat., 2016, 57, 8372–8388 CrossRef.
- A. S. Adeleye, J. R. Conway, K. Garner, Y. Huang, Y. Su and A. A. Keller, Chem. Eng. J., 2016, 286, 640–662 CrossRef CAS.
- M. Ghaedi, S. Hajjati, Z. Mahmudi, I. Tyagi, S. Agarwal, A. Maity and V. K. Gupta, Chem. Eng. J., 2015, 268, 28–37 CrossRef CAS.
- A. Asfaram, M. Ghaedi, S. Hajati, A. Goudarzi and E. A. Dil, Ultrason. Sonochem., 2017, 34, 1–12 CrossRef CAS.
- A. Asfaram, M. Ghaedi, S. Hajati and A. Goudarzi, RSC Adv., 2015, 5, 72300–72320 RSC.
- F. Brandl, N. Bertrand, E. M. Lima and R. Langer, Nat. Commun., 2015, 6, 7765 CrossRef CAS.
- L. Chai, Y. Wang, N. Zhao, W. Yang and X. You, Water Res., 2013, 47, 4040–4049 CrossRef CAS.
- Y. Su, A. S. Adeleye, Y. Huang, X. Zhou, A. A. Keller and Y. Zhang, Sci. Rep., 2016, 6, 24358 CrossRef CAS.
- V. B. Cashin, D. S. Eldridge, A. Yu and D. Zhao, Environ. Sci.: Water Res. Technol., 2018, 4, 110–128 RSC.
- S. Wang, C. W. Ng, W. Wang, Q. Li and Z. Hao, Chem. Eng. J., 2012, 197, 34–40 CrossRef CAS.
- H. U. Nwankwo, L. O. Olasunkanmi and E. E. Ebenso, Sci. Rep., 2017, 7, 2436 CrossRef.
- M. J. McQuaid, H. Sun and D. Rigby, J. Comput. Chem., 2004, 25, 61–71 CrossRef CAS.
- G. Raffaini, Philos. Trans. R. Soc., 2012, 370, 1444–1462 CrossRef CAS.
- S. W. Bunte and H. Sun, J. Phys. Chem. B, 2000, 104, 2477–2489 CrossRef CAS.
- A. El-Qanni, N. N. Nassar, G. Vitale and A. Hassan, J. Colloid Interface Sci., 2016, 461, 396–408 CrossRef CAS.
- N. N. Marei, N. N. Nassar, M. Hmoudah, A. El-Qanni, G. Vitale and A. Hassan, Can. J. Chem. Eng., 2017, 95, 1864–1874 CrossRef CAS.
- S. Abuhatab, A. El-Qanni, A. El-Hamouz and M. Hmoudah, presented in part at the 2018 AIChE Annual Meeting, Pittsburgh PA, 2018 Search PubMed.
- A. El-Qanni, N. N. Nassar and G. Vitale, RSC Adv., 2017, 7, 14021–14038 RSC.
- A. El-Qanni, PhD thesis, University of Calgary, 2018.
- A. El-Qanni, N. N. Nassar and G. Vitale, Chem. Eng. J., 2017, 327, 666–677 CrossRef CAS.
- S. Wang, Y. Boyjoo and A. Choueib, Chemosphere, 2005, 60, 1401–1407 CrossRef CAS.
- E. Worch, Adsorption technology in water treatment, Walter de Gruyter, Berlin, Germany, 2012 Search PubMed.
- V. K. Gupta, B. Gupta, A. Rastogi, S. Agarwal and A. Nayak, J. Hazard. Mater., 2011, 186, 891–901 CrossRef CAS.
- J. Zolgharnein, N. Asanjrani, M. Bagtash and G. Azimi, Spectrochim. Acta, Part A, 2014, 126, 291–300 CrossRef CAS.
- D. C. Montgomery and G. C. Runger, Applied statistics and probability for engineers, John Wiley & Sons, New York, 2006 Search PubMed.
- BIOVIA Materials Studio Modeling and Simulation Software, Dassault Systemes, 2017 Search PubMed.
- N. N. Marei, N. N. Nassar and G. Vitale, Phys. Chem. Chem. Phys., 2016, 18, 6839–6849 RSC.
- G. McKay and B. Al-Duri, Chem. Eng. Sci., 1988, 43, 1133–1142 CrossRef CAS.
- D. T. Sawyer, W. R. Heineman and J. M. Beebe, Chemistry experiments for instrumental methods, John Wiley & Sons, 3rd edn, 1984 Search PubMed.
- C. Namasivayam, N. Muniasamy, K. Gayatri, M. Rani and K. Ranganathan, Bioresour. Technol., 1996, 57, 37–43 CrossRef.
- C. Namasivayam and D. Kavitha, Dyes Pigm., 2002, 54, 47–58 CrossRef CAS.
- P. K. Malik, Dyes Pigm., 2003, 56, 239–249 CrossRef CAS.
- C. Namasivayam, R. Radhika and S. Suba, Waste Manag., 2001, 21, 381–387 CrossRef CAS.
- B. H. Hameed, J. Hazard. Mater., 2008, 154, 204–212 CrossRef CAS.
- F. A. Pavan, A. C. Mazzocato and Y. Gushikem, Bioresour. Technol., 2008, 99, 3162–3165 CrossRef CAS.
- M. C. Ncibi, B. Mahjoub and M. Seffen, J. Hazard. Mater., 2007, 139, 280–285 CrossRef CAS.
- G. K. Ramesha, A. Vijaya Kumara, H. B. Muralidhara and S. Sampath, J. Colloid Interface Sci., 2011, 361, 270–277 CrossRef CAS.
- M. Maruthapandi, V. B. Kumar, J. H. T. Luong and A. Gedanken, ACS Omega, 2018, 3, 7196–7203 CrossRef CAS.
- A. A. Olajire, A. A. Giwa and I. A. Bello, Int. J. Environ. Sci. Technol., 2015, 12, 939–950 CrossRef CAS.
- D. Yimin, Z. Jiaqi, L. Danyang, N. Lanli, Z. Liling, Z. Yi and Z. Xiaohong, Colloids Surf., A, 2018, 550, 90–98 CrossRef.
- N. Zeinali, M. Ghaedi and G. Shafie, J. Ind. Eng. Chem., 2014, 20, 3550–3558 CrossRef CAS.
- W. Konicki, A. Hełminiak, W. Arabczyk and E. Mijowska, J. Colloid Interface Sci., 2017, 497, 155–164 CrossRef CAS.
- W. Konicki, I. Pełech, E. Mijowska and I. Jasińska, Clean: Soil, Air, Water, 2014, 42, 284–294 CAS.
- T. V. N. Padmesh, K. Vijayaraghavan, G. Sekaran and M. Velan, Chem. Eng. J., 2006, 122, 55–63 CrossRef CAS.
- W. Konicki, D. Sibera, E. Mijowska, Z. Lendzion-Bieluń and U. Narkiewicz, J. Colloid Interface Sci., 2013, 398, 152–160 CrossRef CAS.
- S. Tunali Akar, T. Alp and D. Yilmazer, J. Chem. Technol. Biotechnol., 2013, 88, 293–304 CrossRef CAS.
- R. M. Silverstein, F. X. Webster and D. J. Kiemle, Spectrometric identification of organic compounds, John Wiley & Sons, NJ, USA, 7th edn, 2005 Search PubMed.
- W. J. Weber and E. H. Smith, Environ. Sci. Technol., 1987, 21, 1040–1050 CrossRef CAS.
- G. M. Walker and L. R. Weatherley, Chem. Eng. J., 2001, 83, 201–206 CrossRef CAS.
Footnote |
| † Electronic supplementary information (ESI) available. See DOI: 10.1039/c9ra07001j |
|
| This journal is © The Royal Society of Chemistry 2019 |
Click here to see how this site uses Cookies. View our privacy policy here.  Open Access Article
 ab,
Amjad El-Qanni
 *a,
Nedal N. Marei
 b,
Maryam Hmoudah
 a and
Amer El-Hamouz
 a
a


![[double bond, length as m-dash]](https://www.rsc.org/images/entities/char_e001.gif) N and the SO3 asymmetric stretching vibrations confirming the adsorption of AR88.69 Also, the adsorption of the organics in the aqueous solution have shifted the signals with different intensities from around 500 to 1000 supporting the adsorption.69 The modification on the spectrum of the spent SBNs at the regions of C–S, N
N and the SO3 asymmetric stretching vibrations confirming the adsorption of AR88.69 Also, the adsorption of the organics in the aqueous solution have shifted the signals with different intensities from around 500 to 1000 supporting the adsorption.69 The modification on the spectrum of the spent SBNs at the regions of C–S, N![[double bond, length as m-dash]](https://www.rsc.org/images/entities/char_e001.gif) N, and the SO3 was symmetric. Accordingly, the adsorption of MB and AR88 model molecules onto the surface of the three in-house prepared SBNs is confirmed.
N, and the SO3 was symmetric. Accordingly, the adsorption of MB and AR88 model molecules onto the surface of the three in-house prepared SBNs is confirmed.


![[thin space (1/6-em)]](https://www.rsc.org/images/entities/char_2009.gif) :
:![[thin space (1/6-em)]](https://www.rsc.org/images/entities/char_2009.gif) 4 ratio of the model molecules in one run, as following: 4 molecules AR88 + 1 molecule MB/MgO, 1 molecule AR88 + 4 molecules MB/MgO, 4 molecules AR88 + 1 molecule MB/NiO, and 1 molecule AR88 + 4 molecules MB/NiO. Tables 5 and 6 show the adsorption energy values of MB and AR88 in both single and binary molecules systems. While Fig. 9 and 10 show the lowest adsorption energy molecules configuration on the surface of NiO and MgO for both, single and binary adsorption systems, respectively.
4 ratio of the model molecules in one run, as following: 4 molecules AR88 + 1 molecule MB/MgO, 1 molecule AR88 + 4 molecules MB/MgO, 4 molecules AR88 + 1 molecule MB/NiO, and 1 molecule AR88 + 4 molecules MB/NiO. Tables 5 and 6 show the adsorption energy values of MB and AR88 in both single and binary molecules systems. While Fig. 9 and 10 show the lowest adsorption energy molecules configuration on the surface of NiO and MgO for both, single and binary adsorption systems, respectively.
![[thin space (1/6-em)]](https://www.rsc.org/images/entities/char_2009.gif)
![[thin space (1/6-em)]](https://www.rsc.org/images/entities/char_2009.gif)


