 Open Access Article
Label-free diagnostics and cancer surgery Raman spectra guidance for the human colon at different excitation wavelengths
Beata Brozek-Pluska *a,
Krystian Miazeka,
Jacek Musiałb and
Radzislaw Kordekb
aLaboratory of Laser Molecular Spectroscopy, Institute of Applied Radiation Chemistry, Lodz University of Technology, Wroblewskiego 15, 93-590 Lodz, Poland. E-mail: beata.brozek-pluska@p.lodz.pl
bDepartment of Pathology, Chair of Oncology, Medical University of Lodz, Paderewskiego 4, 92-213 Lodz, Poland
First published on 6th December 2019
Abstract
Raman spectroscopy and imaging are highly structure-sensitive methods that allow the characterization of biological samples with minimal impact. In this paper, Raman spectra and imaging of noncancerous and cancerous human colon tissue samples were measured at different excitation wavelengths: 355, 532, and 785 nm. Intra-patient variability in the analyzed spectra showed colon sample heterogeneity for both noncancerous and cancerous human sample types. The lowest inter-patient variability of Raman spectra was observed for the fingerprint region of noncancerous samples for the 532 nm excitation laser line. The bands of principal biochemical constituents (proteins, lipids, nucleic acids) predominate in VIS and NIR-Raman spectra (excitation: 532, 785 nm), with the special role of the bands of intrinsic tissue chromophores—carotenoids for VIS excitation due to resonance enhancement. At 355 nm excitation, high autofluorescence of colon tissues were observed. Our studies proved high potential of Raman spectroscopy and Raman imaging in differentiation of noncancerous and cancerous human colon tissues and that the wavelengths 532 and 785 nm offer wide possibilities for the detection of human colon tissue pathology for ex vivo and in vivo measurements and prevail over 355 nm excitation.
Introduction
Oncological applications of Raman spectroscopy began 25 years ago.1 Papers published in recent decades have shown that Raman spectroscopy and imaging are able to detect pre-malignant lesions and non-invasive as well as aggressive cancer types in many human organs such as brain,2–5 breast,6–11 esophagus,12,13 stomach,14 salivary gland,15 cervix,16 and colon.17–19Every year the World Health Organization (WHO) reports around 10 million cancer deaths and tens of million people have been diagnosed with cancer in the last 5 years. Therefore, all new protocols designed for cancer detection and the early stages of cancer diagnosis are promising in the fight against this deadly disease. Despite the promising results, many protocols are still far from clinical application and further analyses are needed to translate scientific Raman diagnostic protocols into surgical procedures.
The main stimuli for the application of Raman spectroscopy and imaging in oncological diagnostics include the detection of cancer changes in less invasive stages due to the combination of spectroscopy techniques with endoscopes, the reduction of invasive biopsies, and the minimization of tissue removal considering adequate resection margins.
It is well known that the high mortality of cancers can be reduced by early and precise diagnostics combined with surgical and pharmacological targeted treatments. The gold standard for cancer diagnosis is histopathological analysis of biopsies or other tissue sections. After tissue removal, specimens are fixed, cut using a microtome, and routinely stained using hematoxylin and eosin. A final diagnosis is made based on the morphological features of tissue samples and histopathologists experience.
For histopathological analysis, the high risk is influenced by the representativeness of the sample, because adequate tissue cannot be removed every time. This point is especially important for head and neck resections, because it can determine life functions including efficient brain functionality.
Simultaneously, the traditional medical imaging methods still offer unsatisfactory positive predictive values of 1.4% for the breast, 18.5% for the lung, 7–23% for melanoma, 22% for the prostate,20–23 and around 2% for colon cancer, and consequently, repeated biopsies are often taken.
The basis for the treatment of diagnosed colon cancer is surgery. Surgery for early-stage colon cancer includes the removal of polyps through colonoscopy, endoscopic mucosal resection, or laparoscopic surgery. For invasive colon cancer, a partial colectomy or extensive resection of pathologically altered sections of the digestive tract are most often recommended. Unfortunately, colonoscopy miss rates are 2–6% for cancer and 20–26% for adenomas.24,25 Moreover, colonoscopy is associated with increased risk regarding colon perforation or hemorrhage.
To increase the likelihood of the removal of neoplastic lesions from the patient's body, different techniques have been tested for biopsy guidance: optical coherence tomography (OCT), white light reflectance (WLR), auto-fluorescence (AF) and Raman spectroscopy (RS). Unfortunately, OCT, WLR, and AF have low specificities varying from 35% for pre-malignancy colon changes to 64% for pre-malignant stages for lung cancer.26,27 However, all of these limitations can be overcome by Raman spectroscopy (RS) and Raman imaging (RI), which are characterized by high molecular sensitivity and specificity based on the vibrational spectra of human tissue samples.9,10,28 Moreover, RS and RI allow analysis of in vivo, ex vivo, and in vitro samples without any labeling, staining, or fixing, making these techniques preferred for translation into clinical trials.2–12
In this paper, we focus on the Raman spectra and imaging of human colon noncancerous and cancerous tissues recorded at different excitation wavelengths from the ultraviolet (UV), visible (VIS), and near infrared (NIR) regions (355, 532, and 785 nm) to show how the selection of the excitation laser line modulates the classes of Raman biomarkers for clinical practice. For the best of our knowledge, this is a first paper presenting the comparison not only of the single Raman spectra, but also the Raman imaging of the noncancerous and cancerous human colon samples for so many excitations and exactly for the same samples areas.
Experimental
Sample preparation
Tissue samples were collected from the transverse large intestine during routine surgery. The non-fixed, fresh samples were used to prepare sections of 16 micrometers. Thin tissues sections were prepared using a microtome by histopathologists of Medical University of Lodz. Specimens of the tissue from the tumor mass and the tissue from the safety margin outside the tumor mass were prepared for Raman analysis by placing specimens on CaF2 windows. Adjacent sections were after hematoxylin and eosin staining were used for typical histological analysis. All tissue procedures were conducted under a protocol approved by the Institutional Bioethical Committee at the Medical University of Lodz, Poland (RNN/323/17/KE/17/10/2017). Written informed consent was obtained from patients. Details of the sample preparation and research methodology have been described in detail in our previous papers.6,9,10 The number of patients in our database is 30.Raman spectroscopy and imaging
All Raman images and spectra reported in this manuscript were recorded using the alpha 300 RSA+ confocal microscope (WITec, Ulm, Germany) using a 50 μm (for 355 and 532 nm) or 100 μm (for 785 nm) core diameter fiber, an imaging spectrograph/monochromator (Acton-SP-2300i), a CCD camera (Andor Newton DU970-UVB-353) (for 355 and 532 nm), and an Ultra High Throughput Spectrometer (UHTS 300) and CCD camera (Andor Newton iDU401A-BR-DD-352) for 785 nm. Excitation lines were focused on the sample through a 40× dry objective (Nikon, objective type CFI Plan Fluor C ELWD DIC-M, numerical aperture (NA) of 0.60 and a 3.6–2.8 mm working distance). The average laser excitation power was 2 mW for 355 nm, 10 mW for 532, and 20 mW for 785 nm, with integration times of 1.0, 0.5, and 3.0 s respectively. Edge filters were used to remove the Rayleigh scattered light. A piezoelectric table was used to record Raman images. Spectra were collected at one acquisition per pixel. The cosmic rays were removed from each Raman spectrum (model: filter size: 2, dynamic factor: 10) and the Savitzky–Golay smoothing procedure was also implemented (model: order: 4, derivative: 0). Data acquisition and processing were performed using WITec Project Plus.6,9,10 The white light correction to compare the spectra measured with different excitation wavelengths was performed. All imaging data were analyzed using the Cluster Analysis method (CA). Briefly, CA allows to group objects. This was done for vibrational spectra in our studies in such a way that in the same group (called a cluster), there were objects that were more similar to each other (in a sense of vibrational features in our case) than to those in other groups (other clusters). CA was performed using the WITec Project Plus model (Centroid) with the k-means algorithm (each cluster was represented by a single mean vector). The normalization model was performed using the Origin software (model divided by the norm).Results and discussion
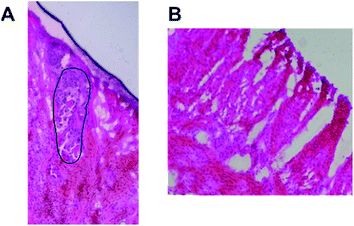
In this section, we present the results for human colon cancer and human colon noncancerous tissues from one patient and for different patients from our database. Before we formulate general conclusions that may be useful in clinical diagnostics, we provide the data for the patient marked with the symbol BO in our database to discuss the most important research findings regarding the chemical composition of noncancerous and cancerous human colon tissues observed at 355, 532, and 785 nm excitation wavelengths. We will present typical single spectra but also the average Raman spectra based on thousands of spectra recorded in our measurements.Fig. 1 presents the histopathological images of cancerous and noncancerous tissues from patient BO.
In general, the morphology and metabolism of colon cancer cells are significantly different compared to those of noncancerous types. From a morphological point of view, the cancer colon cells are characterized by large, variable nuclei, a large nucleus to cytoplasm ratio, variation in size and shape, and disorganized cell arrangement compared to noncancerous type. Generally colon cancer originates from the epithelial cells lining the colon. Most often, the transformation of noncancerous colon cells to the cancerous type is associated with mutations in the Wnt signaling pathway. The most commonly mutated gene in all types of colorectal cancer is the APC gene, which is responsible for APC protein production. The main role of the APC protein is the prevention of β-catenin protein accumulation. In the absence of APC, β-catenin accumulates to high levels and locates inside the nucleus, where it binds to DNA and finally activates the transcription of proto-oncogenes and causes cancer.29 Carcinogenesis may be also associated with oxidative stress, as reactive oxygen species (ROS)-mediated breakdown of lipids results in the generation of end-products such as 4-hydroxynonenal and malondialdehyde.30
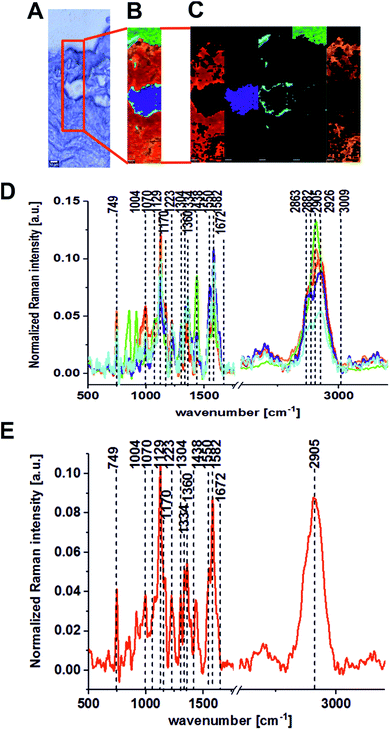
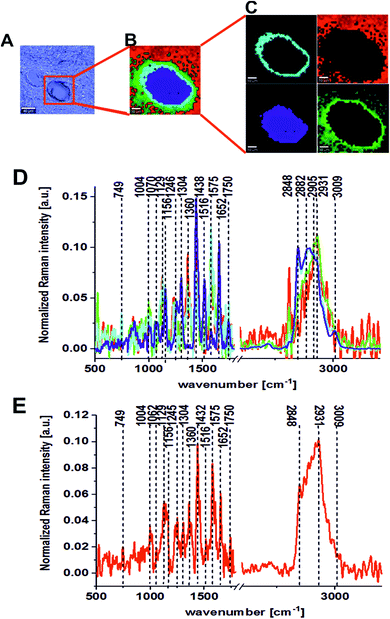
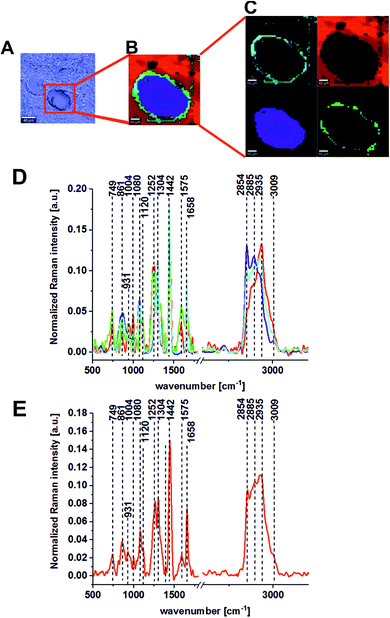
Fig. 2 presents the Raman results obtained for the patient BO for the excitation 532 nm. In Fig. 2 we show the microscopy image, the chemical image constructed using the Cluster Analysis (CA) method based on Raman spectra, chemical images of five clusters identified by CA, the average Raman spectra typical for all clusters and the average Raman spectrum for the cancerous human colon tissue (excitation laser line 532 nm). Fig. 3 presents the same data for noncancerous human colon tissue for patient BO (excitation laser line 532 nm).
Table 1 presents the Raman spectral peak positions and tentative assignments for the noncancerous and the cancerous human colon tissues samples for an excitation laser line of 532 nm and a spectral range of 500–3600 cm−1.
| Wavenumber [cm−1] | Tentative assignments | Type of human sigmoid colon tissue |
|---|---|---|
| a N: noncancerous human colon tissue, C: cancerous human colon tissue, Cyt.: cytochrome C; Trp.: tryptophan; Mit.: mitochondrion; Pyr.: pyrimidine. | ||
| 749 | Nucleic acids, DNA, Trp. nucleoproteins, Cyt | N, C |
| 1004 | Amino acids, phenylalanine | N, C |
| 1062, 1070 | Nucleic acids, lipids, proteins | N, C |
| 1129 | Lactate, saturated lipids, Cyt., phosphatides, glucose | N, C |
| 1156 | Carotenoids | N |
| 1170 | GMP, Pyr. | C |
| 1223 | Amide III, fibrin, phospholipids | C |
| 1245 | DNA/RNA | N |
| 1304 | Lipids, proteins (aliphatic amino acids) | C, N |
| 1334 | Lipids, proteins (aliphatic amino acids) | C |
| 1360 | deoxyHb, ferric protein | C, N |
| 1438, 1432 | Lipids, proteins | C, N |
| 1516 | Carotenoids, hemoprotein | N |
| 1550 | Amide II, proteins, amide II, proteins β-sheet | C |
| 1575 | DNA/RNA | N |
| 1587 | Phosphorylated proteins, Trp. Mit. Cyt. heme | C |
| 1652 | Proteins α-helix, unsaturated lipids | N |
| 1672 | Amide I, apoprotein | C |
| 1750 | Lipids | N |
| 2848 | Fatty acids, lipids | N |
| 2905 | Proteins | C |
| 2931 | Lipoprotein | N |
| 3009 | Lipids, unsaturated fatty acids ![[double bond, length as m-dash]](https://www.rsc.org/images/entities/char_e001.gif) C–H, C–H, |
N |
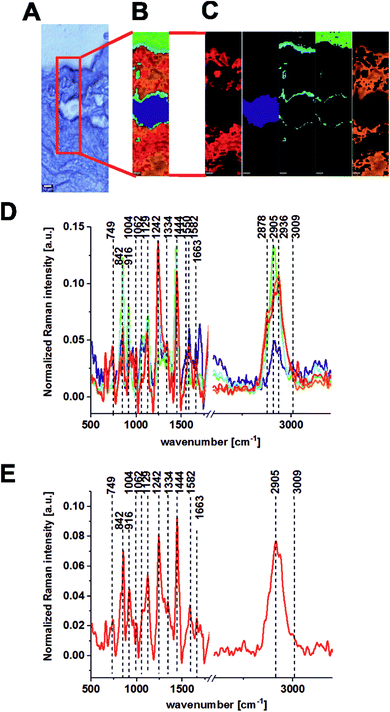
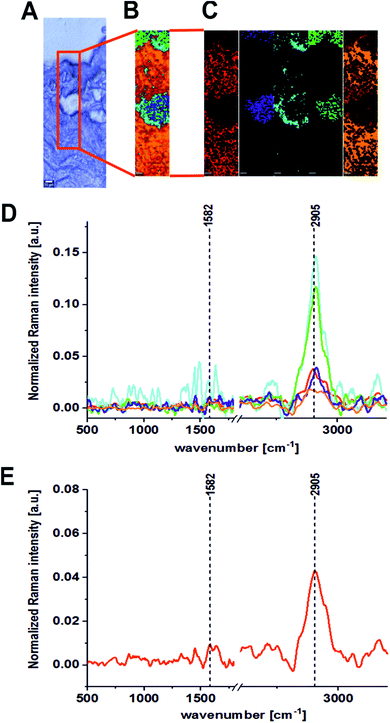
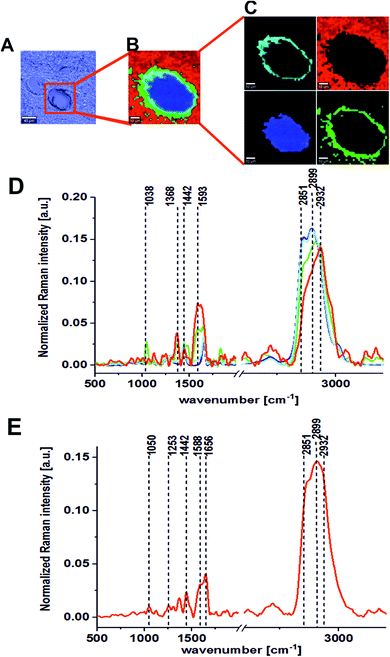
The same areas of the noncancerous and the cancerous human colon tissues for the same patient (BO) were recorded using the excitation laser lines 785 and 355 nm. Fig. 4 and 5 present the results obtained for the NIR excitation range—785 nm for cancerous and noncancerous colon human tissues, respectively.
The last part of the experiment was included the registration of Raman spectra for the UV excitation line (355 nm). Fig. 6 and 7 present the Raman spectra and images recorded at an excitation wavelength of 355 nm for the cancerous and the noncancerous human colon tissues, respectively. Table 2 presents the positions (in cm−1) of characteristic bands of the average Raman spectra for the noncancerous and the cancerous colon human tissue samples as a function of the laser excitation wavelengths.
| Excitation 355 nm | Excitation 532 nm | Excitation 785 nm | |||
|---|---|---|---|---|---|
| Noncancerous tissue | Cancerous tissue | Noncancerous tissue | Cancerous tissue | Noncancerous tissue | Cancerous tissue |
| — | — | 749 | 749 | 749 | 749 |
| — | — | — | — | — | 842 |
| — | — | — | — | 861 | — |
| — | — | — | — | — | 916 |
| — | — | — | — | 931 | — |
| — | — | 1004 | 1004 | 1004 | 1004 |
| 1050 | — | — | — | — | — |
| — | — | 1062 | — | — | 1062 |
| — | — | — | 1070 | — | — |
| — | — | — | — | 1080 | — |
| — | — | — | — | 1120 | — |
| — | — | 1129 | 1129 | — | 1129 |
| — | — | 1156 | — | — | — |
| — | — | — | 1170 | — | — |
| — | — | — | 1223 | — | — |
| — | — | 1245 | — | — | 1242 |
| 1253 | — | — | — | 1252 | — |
| — | — | 1304 | 1304 | 1304 | — |
| — | — | — | 1334 | — | 1334 |
| — | — | 1360 | 1360 | — | — |
| — | — | 1432 | 1438 | — | — |
| 1442 | — | — | — | 1442 | 1444 |
| — | — | 1516 | — | — | — |
| — | — | — | 1550 | — | — |
| — | — | 1575 | — | 1575 | — |
| 1588 | 1582 | — | 1587 | — | 1587 |
| 1656 | — | 1652 | — | 1658 | — |
| — | — | — | 1672 | — | 1663 |
| — | — | 1750 | — | — | — |
| 2851 | — | 2848 | — | 2854 | — |
| — | — | — | — | 2885 | — |
| 2905 | 2905 | — | 2905 | — | 2905 |
| 2932 | — | 2931 | — | 2935 | — |
| — | — | 3009 | — | 3009 | — |
In our experiments, we chose 355, 532 and 785 nm as the excitation laser lines for many reasons: the 785 nm excitation line was chosen because is known to be non-destructive and is routinely used for biological sample analysis and because of the low autofluorescence observed for the spectra. The 785 nm excitation line is also more effective than the other IR excitation lines, like 1064 nm for example, because a better signal-to-noise ratio can be reached for shorter integration times and lower laser power. We chose 532 nm excitation line because, a lower laser power (10 mW) and shorter exposition time (0.5 s) compared to NIR excitation (20 mW and 3 s) can be applied to avoid the destruction of human colon noncancerous and cancerous tissue samples. Measurement at 532 nm has demonstrated also significant band enhancement for chromophores absorbing in the visible region and has shown the predominant role of carotenoids (peaks at 1004, 1156, 1516 cm−1) during the differentiation of noncancerous and cancerous changed tissues. Additionally, we decided to compare the results for 532 and 785 nm excitation lines from practical point of view, as medical doctors will find easier to use visible green light during oncological surgery to determine the resection margins based on vibrational features, because the laser spot will be clearly seen. We used 355 nm because this excitation allowed us to monitor chemical tissue compositions in a broad range, from UV (355 nm) through VIS (532 nm) to NIR (785 nm) and to check if we can determine some Raman biomarkers of cancerogenesis typical only for UV region. Unfortunately, this excitation should be used only for ex vivo measurements – during spectroscopic histopathology due to the fact that UV light can be dangerous for patients. It is well known that UVA (315–400 nm) can generate highly reactive chemical intermediates, such as hydroxyl and oxygen radicals, which, in turn, can damage DNA.
Determining the Raman biomarkers typical for different excitations lines, we have to remember that, Raman spectra can show important variability depending of the analyzed area of one sample (one patient) (see Fig. 2–7) and for different samples (different patients). It means that intra-patient and inter-patient variability should be taken into account in our analysis.
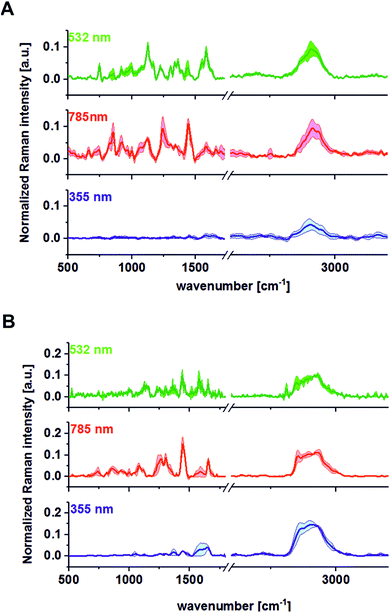
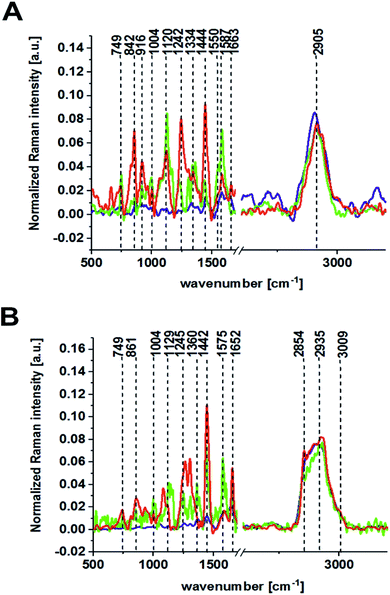
Fig. 8 presents the vibrational spectra for different excitation wavelengths with calculated standard deviations for all recoded wavenumbers (500–3600 cm−1) for 30 randomly chosen samples for different patients.
One can see from Fig. 8 that the lowest inter-patient variability for the human colon noncancerous and cancerous tissues was observed for VIS excitation line – 532 nm in the low frequency region (fingerprint region). In addition, for the 532 nm line, high variance was observed in the high frequency region for peaks at 2854 and 2905 cm−1, which confirms that the lipid/protein profile can differentiate not only the noncancerous and cancerous tissues, as we can see by comparing panels A and B, but it can also distinguish different areas of the heterogeneous matrix of given types of colon samples (this conclusion is confirmed by CA, as shown in Fig. 2–7).
Due to the fact that, anatomically, the human colon is a complex organ with a heterogeneous and multilayer structure, objective diagnosis can be made only by the analysis of the average spectra, characterizing the colon samples as a whole.
Therefore, Fig. 9 presents a comparison of the average Raman spectra obtained for the noncancerous and the cancerous human colon tissue samples recorded using different excitation laser lines from the UV, VIS and NIR regions: 355, 532, and 785 nm.
Comparing the average spectra recorded for the noncancerous and the cancerous human colon tissues at different excitation lines, some differences in band positions and intensities can be observed, and all of these changes may permit the colon cancer spectra to be searched for diagnostic purposes.
Fig. 10 presents the difference spectra (cancerous minus noncancerous) for different excitation lines: 355, 532, and 785 nm.
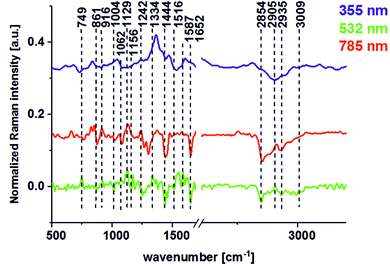 | ||
| Fig. 10 The difference spectra (cancerous minus noncancerous) for different excitation laser lines: 355 (blue line), 532 (green line), and 785 nm (red line). | ||
It can be seen from Fig. 10 that many wavenumbers which differentiate the noncancerous and the cancerous human tissues are common for VIS and NIR excitations. The main differences between the noncancerous and the cancerous tissues at 532 and 785 nm can be observed at wavenumbers of: 749 (nucleic acids, DNA, cytochrome C (Cyt C)), 1004 (amino acids, phenylalanine (Phe), carotenoids), 1129 (lactate, saturated lipids, Cyt., phosphatides, glucose), 1242 (DNA/RNA), 1444 (lipids, protein, pentose), 1587 (phosphorylated proteins, tryptophan (Trp.), mitochondrion (Mit.), Cyt., heme), 1652 (amide I, apoprotein), 2854 (fatty acids, lipids), and 2935 (lipoproteins) cm−1.
For the 532 nm excitation line, a special role is played by carotenoids (1004, 1156, 1516 cm−1) for which the resonance enhancement was observed. The enhanced signals via resonance Raman effect for 532 nm are also reported in literature for cytochrome C providing peaks at 750, 1127, 1314 and 1583 cm−1.31,32 For 355 nm, dominate peaks corresponded to proteins (2905 cm−1).
The positive signals for DNA/RNA, saturated lipids, proteins in β-sheet conformation, phosphorylated amino acids, and proteins shown in Fig. 10 confirm that the overexpression of proteins in cancerous tissue, the high level of nucleic acids associated with cancer development and metastasis, phosphorylation of amino acids and proteins, and changes in protein conformation associated with cancer development can be observed in the vibrational spectra by Raman spectroscopy and imaging. DNA content and DNA methylation can be recognized as molecular alterations in human colon cancer. It has been proved that DNA methylation plays a variety of roles in cancer development, including changes in the normal regulation of gene expression. In colorectal cancers, about 600 to 800 genes are transcriptionally silenced, compared to tissues with normal appearance, by CpG island methylation.33 DNA methylation regulates gene expression by recruiting proteins involved in gene repression or by inhibiting the binding of transcription factors to DNA. As a result, a dynamic process involving both de novo DNA methylation and demethylation can be observed, and as a consequence, cells can develop a stable and unique DNA methylation pattern that regulates tissue-specific gene transcription. Moreover, DNA methylation may be a predictor of metastatic or aggressive cancer. Therefore, the knowledge of DNA methylation as a driving force in colon cancer development is an emerging value, especially for clinical practice.34 The increase of Raman scattering at 749 cm−1 also correlates with a spectacular increase in Raman peak intensity at 1587 cm−1 for cancerous tissue compared to noncancerous one. This means that the difference between cancerous and noncancerous tissues seen in Fig. 10 is typical for phosphorylated amino acids and proteins. It has been shown that phosphorylation seems to be the most important mechanism for the regulation of protein activity. Abnormal phosphorylation has been observed in many cancers and has driven the development of kinase inhibitors that have utility in a number of cancer subtypes.35,36 Phosphorylation of proteins involves the enzymatically mediated addition of a phosphate group to its amino acid side chains. Phosphorylated proteins were observed as far back as the early 1900s, but until the 1950s it was not known that phosphorylation is a reversible, enzymatically mediated process that is capable of modifying the function of proteins. Protein kinases phosphorylate proteins by transferring a phosphate group from adenosine triphosphate to their target proteins. This process is balanced by the action of protein phosphatases, which can subsequently remove the phosphate group. This plays a key role in regulating many intracellular processes such as growth, proliferation, and cell division. Hence, any perturbations in the phosphorylation process can drive many hallmarks of cancer, especially cell growth and proliferation.
The lipid phenotype of colon cancer is also a very promising biomarker of pathological changes. Fig. 10 confirms that unsaturated lipids (3009 cm−1) are typical for noncancerous tissues, while the saturated lipid fraction can be treated as a molecular marker of carcinogenesis (positive peak at 1129 cm−1). Simultaneously, one can see from Fig. 10 that the intensity of the lipid peaks in the high frequency region is higher for noncancerous tissue compared to cancerous one, which is in agreement with literature data.6,10,11 The disturbed content of unsaturated and saturated lipids seems to be a universal marker of pathogenesis, which can be used for breast, head and neck, brain, and colon cancer diagnostics.5,9–11 The huge difference between noncancerous and cancerous tissue can be seen also for peaks typical for carotenoids (peaks at 1004, 1156, and 1516 cm−1). The dominant presence of these natural antioxidants in noncancerous colon tissue confirm that, carotenoids have anti-cancer benefits and are able to effectively decrease the influence of oxidative stress on colon tissue homeostasis. It has been proven that carotenoids have numerous biological properties and can be consider chemopreventive agents. For β-carotene in colon cancer, it has been published that the incorporation of foods containing carotenoids into the diet may help to reduce the risk of developing cancer.37–39
The results presented so far for 355, 532 and 785 nm have been focused on the Raman features of the human colon samples for Raman spectra after background subtraction, but fluorescence obviously has a very important contribution to biological sample measurements. Fig. 11 shows the raw average Raman spectra recorded using 355, 532 and 785 nm excitation laser lines for the fingerprint region. One can see that fluorescence dominates for noncancerous and cancerous tissues at 355 nm and for cancerous tissue at 532 nm.
 | ||
| Fig. 11 Raw average Raman spectra for images presented in Fig. 5 and 6 for the 355 nm line (A), in Fig. 1 and 2 for the 532 nm line (B), and in Fig. 3 and 4 for the 785 nm line (C) for the fingerprint region. Red line: cancerous tissue; blue line: noncancerous tissue. | ||
The fluorescence observed in Fig. 11 originates from the natural fluorophores of tissues such as: tryptophan, elastin, collagen, and NADH (reduced nicotinamide adenine dinucleotide), which can be found in human colon samples. Several intravital fluorophores have been determined so far in human colon tissue, and these were used for the formation of autofluorescence endoscopy (AFE), which is based on natural fluorophore detection. It has been shown that AFE is able to identify slight alterations in the natural fluorophore distribution and concentration during the colorectal carcinogenesis process and thus facilitate non-invasive screening colonoscopies without the need of fluorescent substances or staining reagents.40 Especially effective is a combination of AFE with a high-resolution video-endoscope, which can help in direct cancer detection. From Fig. 11, one can see that Raman spectroscopy also can detect natural human colon tissue fluorophores. Moreover, in the past we have proved for breast tissues that for 532 nm excitation laser line the autofluorescence of the sample can be used as the marker of cancerogenesis.41
Conclusions
The Raman spectra of the noncancerous and the cancerous human colon samples obtained from surgery from patients diagnosed with colon cancer were measured at different excitation wavelengths (355, 532, and 785 nm) for the same samples. The intra-patient variability in the analyzed spectra reflects structural differences and the biochemical heterogeneity of colon tissue for the noncancerous and the cancerous samples. The cluster analysis method can be effectively used to visualize this biological heterogeneity. The lowest inter-patient variability of Raman spectra was observed for the fingerprint region for the 532 nm excitation line. The choice of excitation line significantly influences the relationship between Raman biomarker bands of various tissue components. The bands of principal biochemical constituents (proteins, lipids, nucleic acids) predominate in the UV and NIR-Raman spectra (excitation: 355, 785 nm), while the bands of intrinsic tissue chromophores (carotenoids) prevail in the Vis-Raman spectra (excitation: 532 nm) due to resonance enhancement. Evident spectral differences in proteins, saturated and unsaturated lipids, protein structure, and natural fluorescence were noticed for the average Raman spectra of the noncancerous and the cancerous human colon tissues samples at 532 and 785 nm.Summarizing, the excitation wavelengths from VIS and NIR region used in our study (532 and 785 nm) prevail over 355 nm and can offer rational possibilities for the detection of human colon tissue pathology for ex vivo and in vivo measurements.
Conflicts of interest
There are no conflicts to declare.Acknowledgements
The project was funded through The National Science Centre Poland Grant UMO-2017/25/B/ST4/01788.Notes and references
- R. R. Alfano, C. H. Liu, W. L. Sha, H. R. Zhu, D. L. Akins, J. Cleary, R. Prudente and E. Cellmer, Lasers Life Sci., 1991, 4, 23–28 Search PubMed.
- J. Zhang, Y. Fan, M. He, X. Ma, Y. Song, M. Liu and J. Xu, Oncotarget, 2017, 8, 36824–36831 Search PubMed.
- S. N. Kalkanis, R. E. Kast, M. L. Rosenblum, T. Mikkelsen, S. M. Yurgelevic, K. M. Nelson, A. Raghunathan, L. M. Poisson and G. W. Auner, J. Neuro-Oncol., 2014, 116, 477–485 CrossRef CAS PubMed.
- T. Hollon, S. Lewis, C. W. Freudiger, X. Sunney Xie and D. A. Orringer, Neurosurg. Focus, 2016, 40, E9 Search PubMed.
- H. Abramczyk and A. Imiela, Spectrochim. Acta, Part A, 2018, 188, 8–19 CrossRef CAS PubMed.
- H. Abramczyk, B. Brozek-Pluska, J. Surmacki, J. Jablonska-Gajewicz and R. Kordek, Prog. Biophys. Mol. Biol., 2012, 108, 74–81 CrossRef CAS.
- Q. Li, Q. Gao and G. Zhang, Biomed. Opt. Express, 2014, 5, 2435–2445 CrossRef PubMed.
- Q. Li, C. Hao and Z. Xu, Sensors, 2017, 17, 627 CrossRef PubMed.
- H. Abramczyk and B. Brozek-Pluska, J. Mol. Liq., 2017, 245, 52–61 CrossRef CAS.
- B. Brozek-Pluska, M. Kopec and H. Abramczyk, Anal. Methods, 2016, 8, 8542–8553 RSC.
- J. Surmacki, B. Brozek-Pluska, R. Kordek and H. Abramczyk, Analyst, 2015, 140, 2121–2133 RSC.
- M. Ishigaki, Y. Maeda, A. Taketani, B. B. Andriana, R. Ishihara, K. Wongravee, Y. Ozaki and H. Sato, Analyst, 2016, 141, 1027–1033 RSC.
- G. Shetty, C. Kendall, N. Shepherd, N. Stone and H. Barr, Br. J. Cancer, 2006, 94, 1460–1464 CrossRef CAS PubMed.
- S. K. Teh, W. Zheng, K. Y. Ho, M. Teh, K. G. Yeoh and Z. Huang, J. Biomed. Opt., 2008, 13, 034013 CrossRef PubMed.
- B. Brozek-Pluska, M. Kopec, I. Niedzwiecka and A. Morawiec-Sztandera, Analyst, 2015, 140, 2107–2113 RSC.
- E. M. Kanter, S. Majumder, E. Vargis, A. Robichaux-Viehoever, G. J. Kanter, H. Shappell, H. W. Jones 3rd and A. Mahadevan-Jansen, J. Raman Spectrosc., 2009, 40, 205–211 CrossRef CAS PubMed.
- W. Liu, H. Wang, J. Du and C. Jing, Biosens. Bioelectron., 2017, 97, 70–74 CrossRef CAS PubMed.
- C. A. Jenkins, P. D. Lewis, P. R. Dunstan and D. A. Harris, World J. Gastrointest. Oncol., 2016, 8, 427–438 CrossRef PubMed.
- D. I. Park, S. Ryu, Y. H. Kim, S. H. Lee, C. K. Lee, C. S. Eun and D. S. Han, Am. J. Gastroenterol., 2010, 105, 2017–2025 CrossRef PubMed.
- L. P. Bokhorst, X. Zhu, M. Bul, C. H. Bangma, F. H. Schroder and M. J. Roobol, BJU Int., 2012, 110, 1654–1660 CrossRef CAS PubMed.
- M. Rominger, C. Wisgickl and N. Timmesfeld, Rofo, 2012, 184, 1144–1152 CrossRef CAS PubMed.
- A. McWilliams, M. C. Tammemagi, J. R. Mayo, H. Roberts, G. Liu, K. Soghrati, K. Yasufuku, S. Martel, F. Laberge, M. Gingras, S. Atkar-Khattra, C. D. Berg, K. Evans, R. Finley, J. Yee, J. English, P. Nasute, J. Goffin, S. Puksa, L. Stewart, S. Tsai, M. R. Johnston, D. Manos, G. Nicholas, G. D. Goss, J. M. Seely, K. Amjadi, A. Tremblay, P. Burrowes, P. MacEachern, R. Bhatia, M. S. Tsao and S. Lam, N. Engl. J. Med., 2013, 369, 910–919 CrossRef CAS PubMed.
- P. Carli, F. Mannone, V. De Giorgi, P. Nardini, A. Chiarugi and B. Giannotti, Melanoma Res., 2003, 13, 179–182 CrossRef PubMed.
- B. Bressler, L. F. Paszat, Z. Chen, D. M. Rothwell, C. Vinden and L. Rabeneck, Gastroenterology, 2007, 132, 96–102 CrossRef PubMed.
- E. Quintero, C. Hassan, C. Senore and Y. Saito, Gastroenterol Res Pract., 2012, 2012, 846985 Search PubMed.
- L. M. W. K. Song, S. Banerjee, D. Desilets, D. L. Diehl, F. A. Farraye, V. Kaul, S. R. Kethu, R. S. Kwon, P. Mamula, M. C. Pedrosa, S. A. Rodriguez and W. M. Tierney, Gastrointest. Endosc., 2011, 73, 647–650 CrossRef PubMed.
- Y. Wang, Q. Wang, J. Feng and Q. Wu, Patient Prefer. Adherence, 2013, 7, 621–631 Search PubMed.
- A. Nijssen, S. Koljenovic, T. C. Bakker Schut, P. J. Caspers and G. J. Puppels, J. Biophot., 2009, 2, 29–36 CrossRef CAS PubMed.
- S. D. Markowitz and M. M. Bertagnolli, N. Engl. J. Med., 2009, 361, 2449–2460 CrossRef CAS PubMed.
- A. Pakiet, J. Kobiela, P. Stepnowski, T. Sledzinski and A. Mika, Lipids Health Dis., 2019, 18, 29, DOI:10.1186/s12944-019-0977-8.
- S. Hu, I. K. Morris, J. P. Singh, K. M. Smith and T. G. Spiro, J. Am. Chem. Soc., 1993, 115, 12446–12458 CrossRef CAS.
- M. Takeuchi, S. Kajimoto and T. Nakabayashi, J. Phys. Chem. Lett., 2017, 21, 5241–5245 CrossRef PubMed.
- Y. P. Wang and Q. Y. Lei, Cancer Commun., 2018, 38, 25 CrossRef PubMed.
- M. S. Kim, J. Lee and D. Sidransky, Cancer Metastasis Rev., 2010, 29, 181–206 CrossRef CAS PubMed.
- P. Radivojac, P. H. Baenziger, M. G. Kann, M. E. Mort, M. W. Hahn and S. D. Mooney, Bioinformatics, 2008, 24, i241–i247 CrossRef PubMed.
- C. Greenman, R. Wooster, P. A. Futreal, M. R. Stratton and D. F. Easton, Genetics, 2006, 173, 2187–2198 CrossRef CAS PubMed.
- M. L. Slattery, J. Benson, K. Curtin, K. N. Ma, D. Schaeffer and J. D. Potter, Am. J. Clin. Nutr., 2000, 71, 575–582 CrossRef CAS PubMed.
- K. A. Steinmetz and J. D. Potter, Cancer Causes Control, 1991, 2, 325–357 CrossRef CAS PubMed.
- J. D. Potter, M. L. Slattery, R. M. Bostick and S. M. Gapstur, Epidemiol. Rev., 1993, 15, 499–545 CrossRef CAS PubMed.
- H. Aihara, H. Tajiri and T. Suzuki, Gastroenterol Res Pract., 2012, 2012, 971383 Search PubMed.
- B. Brozek-Pluska, I. Placek, K. Kurczewski, Z. Morawiec, M. Tazbir and H. Abramczyk, J. Mol. Liq., 2008, 141, 145–148 CrossRef CAS.
| This journal is © The Royal Society of Chemistry 2019 |

