
 Open Access Article
 This Open Access Article is licensed under a Creative Commons Attribution-Non Commercial 3.0 Unported Licence
Rapid screening and quantification of multi-class antibiotic pollutants in water using a planar waveguide immunosensor
Tianmu Zhangab,
Yijun Li *ab,
Chunfei Chenc,
Xiaoping Liuc,
Yan Tianc,
Siyu Zengb and
Miao Heab
*ab,
Chunfei Chenc,
Xiaoping Liuc,
Yan Tianc,
Siyu Zengb and
Miao Heab
aCenter for Sensor Technology of Environment and Health, Tsinghua University, Beijing 100084, China. E-mail: liyijun14@mails.tsinghua.edu.cn
bState Key Joint Laboratory of Environmental Simulation and Pollution Control, School of Environment, Tsinghua University, Beijing 100084, China
cGuangxi Environmental Monitoring Centre, Nanning 530028, China
First published on 25th November 2019
Abstract
Antibiotics are commonly used in livestock-related agriculture and aquaculture, but they also remain in water and potentially threaten human health. Immunosensors are attractive tools for the rapid detection of antibiotics in water due to their high sensitivity and low costs. However, the simultaneous detection of multi-class antibiotics remains a challenge due to the limited number of detection sites on the immunochip. Also, matrix effects hinder the practical application of these sensors. This paper presents a method for multi-class antibiotic detection in real water using a planar waveguide immunosensor (PWI). We integrate the screening and quantitive detection sites on the same immunochip, and a single screening detection site could detect multi-class antibiotics from the same family, increasing the detection types of analytes. In addition, to eliminate the matrix effects, we develop a testing buffer for real water detection, so that complex pretreatments of the samples can be omitted. Using our sensor and testing buffer, we detect 14 different antibiotics in real water. Lincomycin can be detected with a detection limit of 0.01 μg L−1, and 13 quinolones can be screened in a single assay. These results demonstrate that this planar waveguide immunosensor is capable of simultaneous screening and quantification of multi-class antibiotic pollutants and is expected to be applied for practical environmental monitoring.
Introduction
Lincomycin is an antibiotic produced by Streptomyces that can be used therapeutically and prophylactically for animals. Unlike lincomycin, quinolones are synthetic, broad-spectrum antibiotics used to treat humans and animals.1 They are used in aquaculture and the livestock industry, because they are highly efficient, stable, and have a low incidence of side effects.2 Lincomycin and various quinolones are frequently detected in environment,3–6 which poses threats to ecological and human health.7,8 Monitoring the residual level of antibiotics in surface water is therefore critical.Analytical techniques used to quantify antibiotic concentrations in food and environmental samples include high-performance liquid chromatography (HPLC),9,10 HPLC coupled with mass spectrometry (HPLC/MS)11 and enzyme-linked immunosorbent assays (ELISAs).12,13 However, these methods are time-consuming and expensive, and specialized laboratory instrument is required for the detection process.14 Biosensors are an ideal alternative to address such issues due to their high sensitivity, rapid response and low costs. Various biosensors based on the colorimetric,15 electrochemical,16 and optical17,18 principles have been developed for the antibiotic monitoring. Unfortunately, most of these biosensors are designed to detect one or a few antibiotics at a time due to the limited number of binding sites for detection, and more sites are required for additional analytes. There are two possible ways addressing this issue. The first one is to increase the binding sites on the chips. For example, microfabrication technology offers opportunities for the development of microarray devices or chips, where sufficient binding sites are available for the detection.19,20 The other option is to increase the kinds of analytes on one binding site. This method simplifies the fabrication and modification processes of chips. In addition, matrix effects from the real samples could supress the activity of antibodies and interfere the detection results, thus pretreatments are introduced to eliminate interferences.21 Lengthy pretreatments require complex operations and extend the detection time. Therefore, rapidly screening and quantification of multi-class antibiotics without complex pretreatment remains a challenge.
In this study, we develop a method for the rapid and simultaneous screening and quantification of 13 quinolones and lincomycin using a planar waveguide immunosensor. Antigens of lincomycin and quinolones are modified on two different sites on the specially designed immunochip. Antibodies for quantitive detection of lincomycin and screening detection of 13 quinolones are also chosen for the method. Common matrix effects like pH, ionic strength and heavy metal ions are investigated, and a testing buffer is afterwards developed to eliminate these matrix effects. We test the method for screening and quantification of antibiotics simultaneously and separately. Results show that lincomycin could be detected with a detection limit of 0.01 μg L−1, and 13 quinolones could be screened in 20 min. Also, in the real water samples, analyte recovery ranged from 86% to 136%, and relative standard deviations were below 10%. Experimental results demonstrate that this testing buffer can mitigate matrix effects, and that this method is capable of detecting lincomycin and quinolones in water samples simultaneously.
Experimental
Chemicals and materials
Bovine serum albumin (BSA), (3-mercaptopropyl)trimethoxysilane (MTS), N-(4-maleimidobutyryloxy)succinimide (GMBS), sodium dodecyl sulphate (SDS) and N,N-dimethylformamide (DMF) were purchased from Sigma-Aldrich (Steinheim, Germany). Standard solution for heavy metal ions was purchased from Agilent Technologies, which contains 100 mg L−1 of Al, Sb, As, Ba, Be, B, Cd, Ca, Cr, Co, Cu, Fe, Pb, Mg, Mn, Mo, Ni, K, Se, Si, Ag, Sr, Na, Tl, Ti, V and Zn, respectively. Unless otherwise specified, all other reagents were purchased from Beijing Chemical Agents (China) and were of analytical grade. Cyanine 5.5 (Cy5.5) and N-hydroxysuccinimide (NHS) ester was obtained from GE Healthcare Life Sciences (Chicago, U.S.A.). Methanol was used to prepare the antibiotic stock solutions, which were stored at 4 °C. Antibiotic standard solutions were prepared from the stock solutions via serial dilution in 0.01 M phosphate-buffered saline (PBS, pH 7.4). Anti-quinolone monoclonal antibody, anti-lincomycin monoclonal antibody, conjugated BSA-quinolone hapten (QNS-BSA), and conjugated BSA-lincomycin hapten (LIN-BSA) were purchased from WDWK Biotechnology Co., Ltd. (Beijing, China). The anti-quinolone and anti-lincomycin antibodies were labelled with Cy5.5 according to a previously described method.22Instrumentation
The planar waveguide immunosensor (PWI) employed in this study was described in detail in a previous report.23 A schematic diagram of the PWI is presented in Fig. 1. The sensor was comprised of a reaction system, an optical system, a flow delivery system, and a signal processing system. The reaction system consisted of an immunochip and a flow cell, where the reaction between the antibodies and conjugated antibiotics occurred. The immunochip was comprised of K9 glass with a refractive index of 1.52 and dimensions of 65 mm × 15 mm × 1.5 mm. One end of the chip was bevelled at a 45° angle for light coupling. A 60 nm-thick SiO2 film layer was coated onto the immunochip for surface modification. The reactor was made of polytetrafluoroethylene and plexiglass, which formed a completely closed and integrated structure to prevent reagent leakage. The main components of the optical system were a pulse diode laser, high-numerical-aperture polymer fibres (NA 0.46) and photodiodes. The beam emitted by the pulse diode laser was directly coupled to the immunochip and propagated along the chip via total internal reflection. The evanescent wave was generated at 4 sites on the chip surface and excited fluorescently labelled complexes on the chip. Fluorescence on the chip surface was detected with a multi-mode optical fibre and converted into an electrical signal by the photodiode. All reagents were injected via the flow delivery system, which consisted of one injection pump, a peristaltic pump, a solenoid valve and a six-way valve. The pumps, valve, and signal processing were controlled through the signal processing system.24,25 Each detection cycle can be completed in 20 min.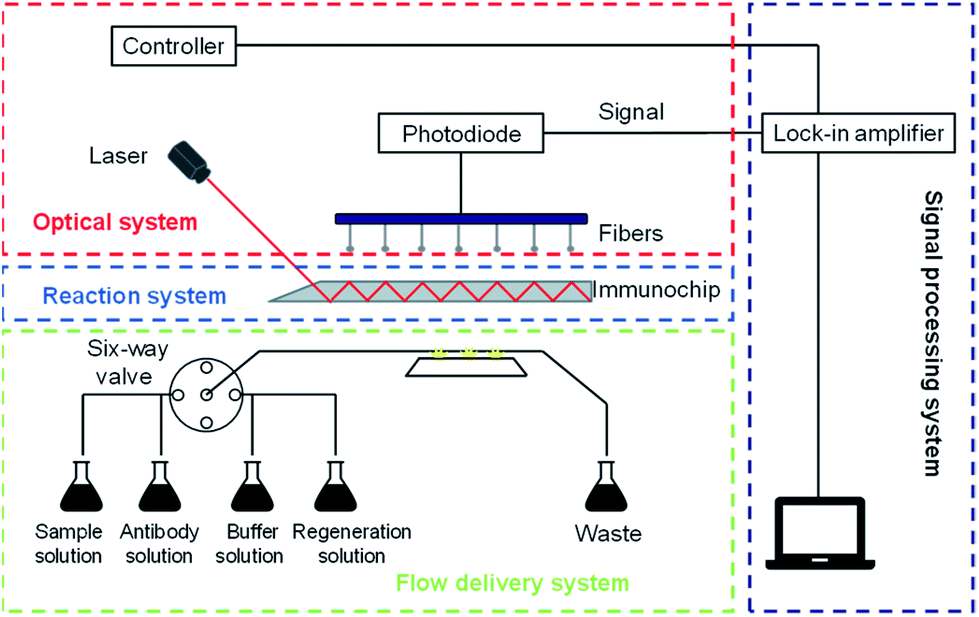 | ||
| Fig. 1 Schematic diagram of the planar waveguide immunosensor (PWI) platform. | ||
Modification of the immunochip
Covalent immobilization of the LIN-BSA and QNS-BSA conjugates on the chip surface made the chip reusable. The cleaned chip was immersed in a 3![[thin space (1/6-em)]](https://www.rsc.org/images/entities/char_2009.gif) :1 solution of concentrated sulfuric acid and hydrogen peroxide for 2 h at 120 °C. The chip was then rinsed with ultrapure water and dried in an oven overnight at 70 °C. A reactive thiol layer was coated onto the chip surface by immersing the chip in a 2% (v/v) solution of MTS in toluene for 2 h at room temperature. To ensure the order and uniformity of the layer, the entire process was performed under anhydrous conditions. The chip was rinsed with toluene and dried under nitrogen. GMBS (2 mM) in ethanol was applied to the chip surface for 1 h at room temperature to introduce the heterobifunctional crosslinker. Afterward, the QNS-BSA and LIN-BSA conjugates PBS solution at 0.5 mg mL−1 were separately coupled at two different binding sites on the chip overnight at 4 °C. Finally, non-specific binding sites on the chip were inactivated by soaking it in 5 mg mL−1 BSA for 1 h.
:1 solution of concentrated sulfuric acid and hydrogen peroxide for 2 h at 120 °C. The chip was then rinsed with ultrapure water and dried in an oven overnight at 70 °C. A reactive thiol layer was coated onto the chip surface by immersing the chip in a 2% (v/v) solution of MTS in toluene for 2 h at room temperature. To ensure the order and uniformity of the layer, the entire process was performed under anhydrous conditions. The chip was rinsed with toluene and dried under nitrogen. GMBS (2 mM) in ethanol was applied to the chip surface for 1 h at room temperature to introduce the heterobifunctional crosslinker. Afterward, the QNS-BSA and LIN-BSA conjugates PBS solution at 0.5 mg mL−1 were separately coupled at two different binding sites on the chip overnight at 4 °C. Finally, non-specific binding sites on the chip were inactivated by soaking it in 5 mg mL−1 BSA for 1 h.
Immunoassay
A highly sensitive indirect competitive immunoassay was employed for the simultaneous detection of quinolones and lincomycin. The QNS-BSA and LIN-BSA conjugates were immobilized on the chip surface as described above, and the antibody binding sites were occupied by the respective analytes. The immunoassay involved the following four steps: pre-incubation, an interfacial reaction, fluorescence collection, and regeneration. The free antibody binding sites were bound to the analytes in the pre-incubation step by mixing 800 μL of the analyte solutions with 200 μL of the Cy5.5-labelled antibody solutions. The mixture was then pumped into the flow cell. The unbound antibodies remaining after pre-incubation were covalently bound to the immobilized conjugates on the immunochip during the interfacial reaction. In the fluorescence collection step, the immunochip was washed with 10 mM PBS solution to remove non-specifically bound antibodies from the chip surface. An evanescent wave was then generated with the laser to excite the fluorescently labelled antibodies on the chip surface. The fluorescence signal from the labelled antibodies was inversely proportional to the analyte concentration. To regenerate the chip after each detection cycle, the chip surface was rinsed with sodium dodecyl sulphate (SDS) solution (0.5%, pH 1.9) for 5 min to break the antibody–analyte bonds.Study of matrix effects and analysis of water samples
To evaluate the effects of matrix interferences on the immunoassay, a systematic analysis of matrix effects was conducted under various PWI operating conditions. HCl or NaOH was used to adjust the pH of immunoassay solutions over a range of pH values. The detection performance was evaluated from pH 3 to pH 11, and the appropriate detection range was determined. A high-concentration PBS solution was also used to adjust the pH of the solutions. To evaluate the effect of PBS concentration on the immunoassay, 10 mM PBS, 20 mM PBS and 50 mM PBS solutions at pH 7.4 were employed.The influence of heavy metal ions, such as Cu and Pb, on the biosensor performance has been examined in previous studies.21 To evaluate the effects of heavy metal ions on the immunoassay, samples were spiked with a mixture of 27 heavy metals at different concentrations. 0.5% Ethylenediaminetetraacetic acid (EDTA) was then added to the solutions to eliminate the effect of heavy metal ions.
A testing buffer was finally developed to enhance the immunoassay performance in the presence of matrix effects. Two surface water samples and one water sample from a fishpond were collected in one River Basin in Guangxi Zhuang Autonomous Region for the recovery experiments. All samples were filtered through 0.45 μm membrane filters and spiked with lincomycin and quinolones standard solutions. The solutions were mixed with the proposed testing buffer, and recovery experiments were conducted to evaluate the accuracy of the immunoassay.
Data analysis
The lincomycin and quinolones calibration curves were constructed with the averages of three independent immunoassay measurements. The fluorescence signal was plotted against the logarithm of concentration over a series of concentrations. A four-parameter logistic model was applied to fit the fluorescence signals.26
 | (1) |
Results and discussion
Optimization of LIN quantification
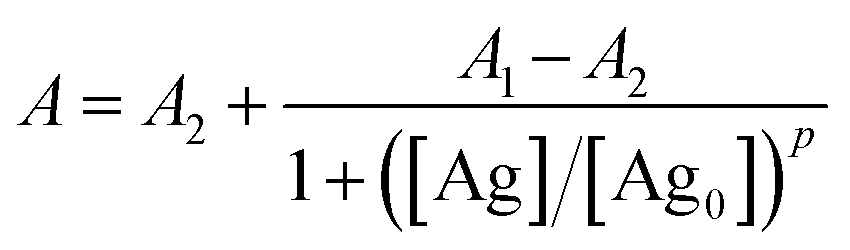
We first optimized the detection condition for LIN detection. Theoretically, lower antibody concentrations not only conserved reagents, but also improved sensitivity and lowered the LOD. However, reducing the amount of antibody led to decreased signal intensity, which affected accuracy. Thus, an appropriate antibody concentration was crucial for the detection of LIN and QNS.25The LIN calibration curves in Fig. 2(a) were constructed with the fluorescently labelled LIN antibody at concentrations of 1, 2 and 10 μg mL−1. Each point on the calibration curves in Fig. 2(a) is normalized as B/B0, where B is the signal obtained when samples are detected, and B0 is the blank signal (B0) which is obtained when the antibiotic concentration is 0.
 | ||
| Fig. 2 (a) Calibration curves obtained with Cy5.5-labelled lincomycin antibody at concentrations of 1 μg mL−1, 2 μg mL−1 and 10 μg mL−1. (b) Bmax, IC50 and Bmax/IC50 of the calibration curves at each LIN antibody concentration. | ||
The LODs of the immunoassay with fluorescently labelled LIN antibody at 1, 2 and 10 μg mL−1 were 0.001, 0.01 and 0.02 μg L−1, respectively. These results show that the LOD at 1 μg mL−1 was one magnitude lower than the LOD at 2 μg mL−1. However, B0 at a LIN antibody concentration of 1 μg mL−1 was too low for accurate quantitation according to the previous study.25
To select the optimized concentration, we introduced the ratio B0/IC50 to determine the optimum antibody concentration.28 The results obtained at the three antibody concentrations are compared in Fig. 2(b). The value of B0/IC50 at 2 μg mL−1 was clearly much higher than B0/IC50 at 1 μg mL−1 or 10 μg mL−1. Therefore, the LIN antibody concentration was optimized as 2 μg mL−1. The LOD for the electroanalytical method developed by Chiu and et al.29 is 36 μg L−1, while that of the chemiluminescence method developed by Yang and et al.30 is 2.5 μg L−1. The competitive indirect ELISA method studied by Burkin and et al.31 demonstrated a sensitivity of 0.43 μg L−1. The HPLC-MS/MS method developed by Sara and et al.32 has a LOD of 0.2 μg L−1. Thus, the biosensor provided relatively high sensitivity.
Optimization of QNS screening detection
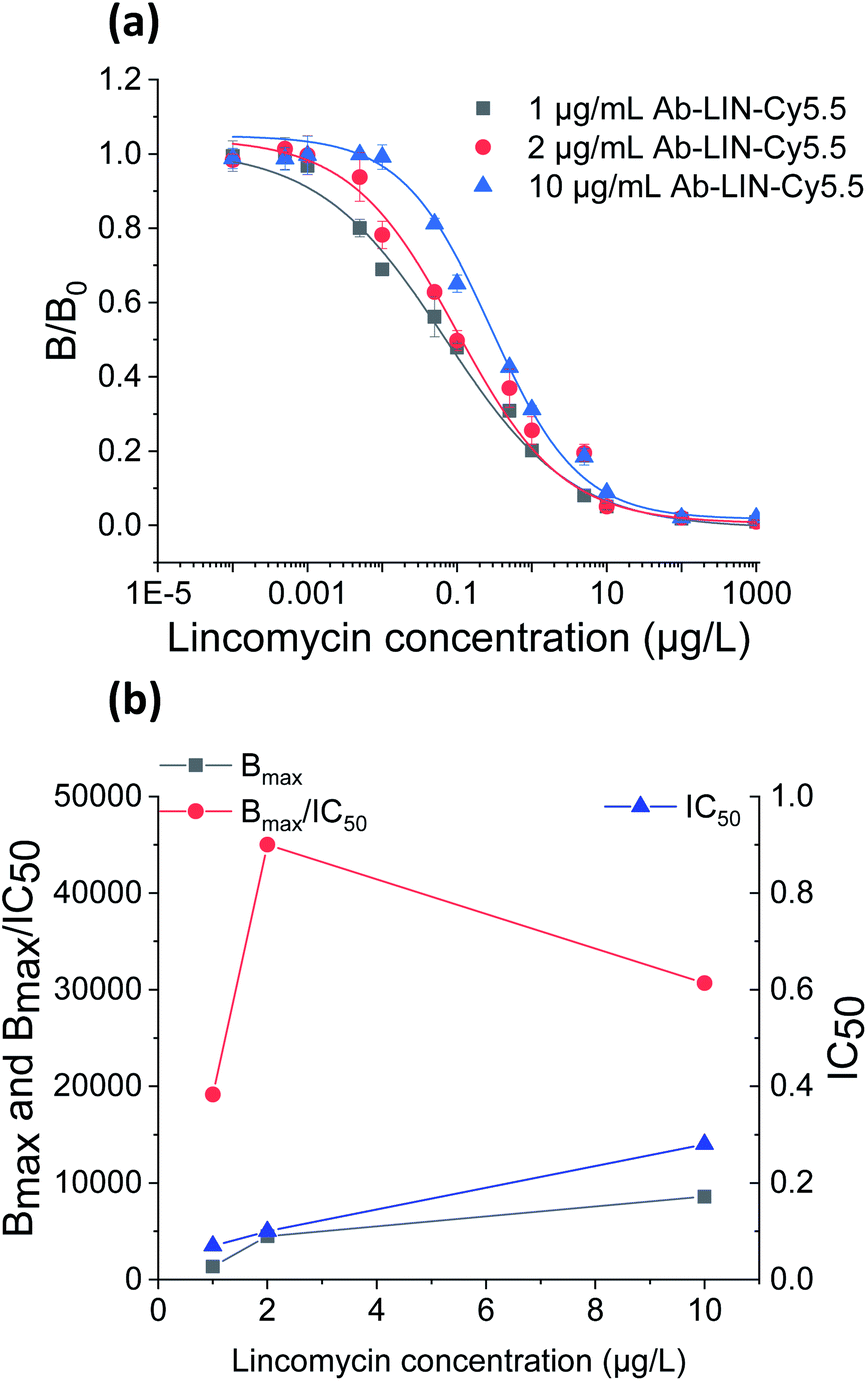
As the antibody for QNS detection is of broad spectrum, we first evaluated its performance using ELISA method. The results showed that 13 QNS antibiotics presented positive responses and that each of these QNS could be quantitively detected using the corresponding calibration curves as shown in Fig. 3(a). Furthermore, the QNS antibody was then applied in the PWI sensor and the concentration was also optimized. The calibration curves in Fig. 3(b) were obtained with fluorescently labelled QNS antibody at concentrations of 0.6, 2 and 5 μg mL−1 and the 13 QNS antibiotics were all mixed at the same concentration. Using the ratio B0/IC50, the optimum labelled QNS antibody concentration was determined as it was for the labelled LIN antibody to be 0.6 μg mL−1. These results indicated that the PWI could realize the screening of 13 QNS antibiotics in a single assay and quantification of each of them in the following step. | ||
| Fig. 3 (a) Cy5.5-labelled quinolone antibody response curves for 13 quinolones obtained from the ELISA experiments. (b) Calibration curves obtained with Cy5.5-labelled quinolone antibody at concentrations of 0.6 μg mL−1, 2 μg mL−1 and 5 μg mL−1. | ||
Specificity and simultaneous detection
The cross effect between LIN and QNS detection was verified by monitoring the signal at the LIN antigen binding site on the immunochip when the QNS antibody was used and vice versa. As indicated in Fig. 4(a), each bind site showed high PWI signal when the corresponding antibody was used and no obvious signal appeared when the other antibody was in use.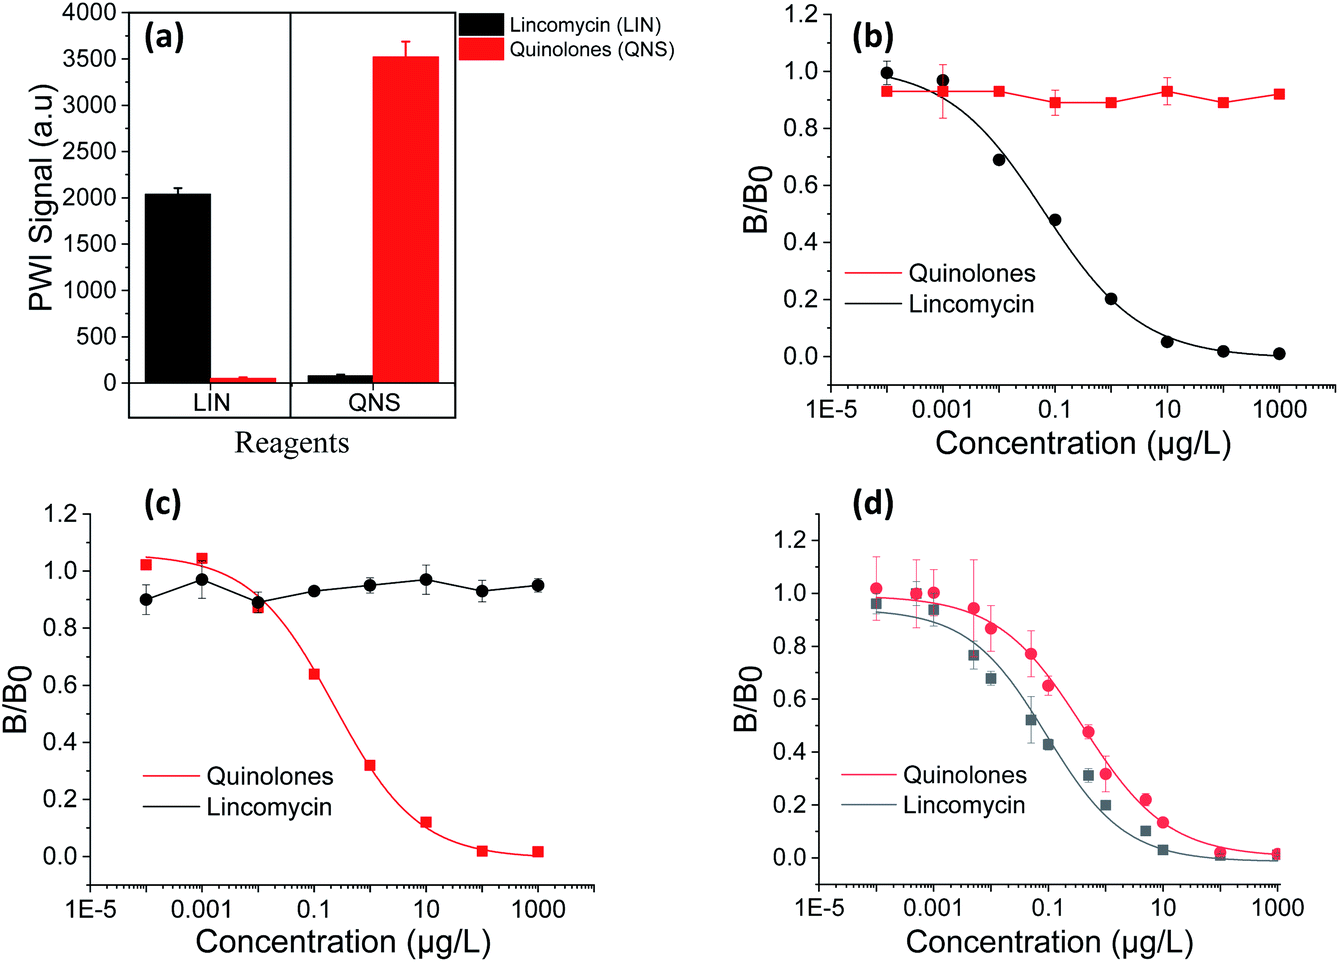 | ||
| Fig. 4 (a) Results from the recognition experiments showing a specific response at each binding site. (b) Calibration curves obtained with Cy5.5-labelled LIN antibody in the presence of quinolones. (c) Calibration curves obtained with Cy5.5-labelled QNS antibody in the presence of lincomycin. (d) PWI calibration curves obtained from simultaneous LIN and QNS detection. | ||
Further, we prepared samples with mixed QNS with LIN antibiotics at different concentrations and tested these samples using LIN antibody and QNS antibody, individually. As shown in Fig. 4(b), the calibration curve of LIN has no obvious difference to the curve in Fig. 2(a) and the QNS curve shows no response to the concentration change. The same results could be found for QNS detection in Fig. 4(c). These results demonstrated that this method has high specificity to the analyte detection.
For the simultaneous detection, we mixed QNS antibody with LIN antibody at each optimized concentration and detected the samples containing QNS and LIN antibiotics at different concentrations. Calibration curves for the simultaneous detection of QNS and LIN were plotted in Fig. 4(d). The LODs and linear ranges of simultaneous detection were then compared with those of individual detection (Fig. 4(b) and (c)). The LODs and linear ranges were shown in Table 1. The results demonstrate that simultaneous detection performance is comparable to that of individual analyte detection.
| Analyte | LOD (μg L−1) | Linear range (μg L−1) | |
|---|---|---|---|
| Individual detection | Quinolones | 0.01 | 0.03–2.97 |
| Lincomycin | 0.01 | 0.01–0.94 | |
| Simultaneous detection | Quinolones | 0.02 | 0.04–4.24 |
| Lincomycin | 0.03 | 0.05–0.82 |
Buffer for the matrix effect
To mitigate the matrix effects in the immunoassay and omit the complex pretreatment process, we develop a testing buffer for the rapid detection. As the most common factors in the matrix effects, pH and the ionic strength were selected. In addition, the interference caused by the heavy metal ions was also investigated as they are also detected in the surface water in some regions.The pH of the solutions could affect the stability of antigen–antibody complexes, and thus impact immunoassay performance.33 We adjusted the pH value of samples from 4.0 to 10.0. QNS calibration curves obtained at pH values were shown in Fig. 5(a). Compared these curves, we note that pH has a significant influence on the immunoassay performance. The maximum signals at pH 4.0 and 10 were over 90% less intense than the maximum signal at pH 7.4. In contrast, the maximum signal between pH 5 and pH 8 fluctuated within 15% relative to the signal at pH 7.4. Virtually no differences were observed in the immunoassay features, including the linear range, LOD and IC50. The results clearly demonstrate that samples with pH values from 5.0 to 8.0 could be effectively detected. Consequently, a highly concentrated buffer solution is required for the real sample detection to mitigate the interference from pH variation.
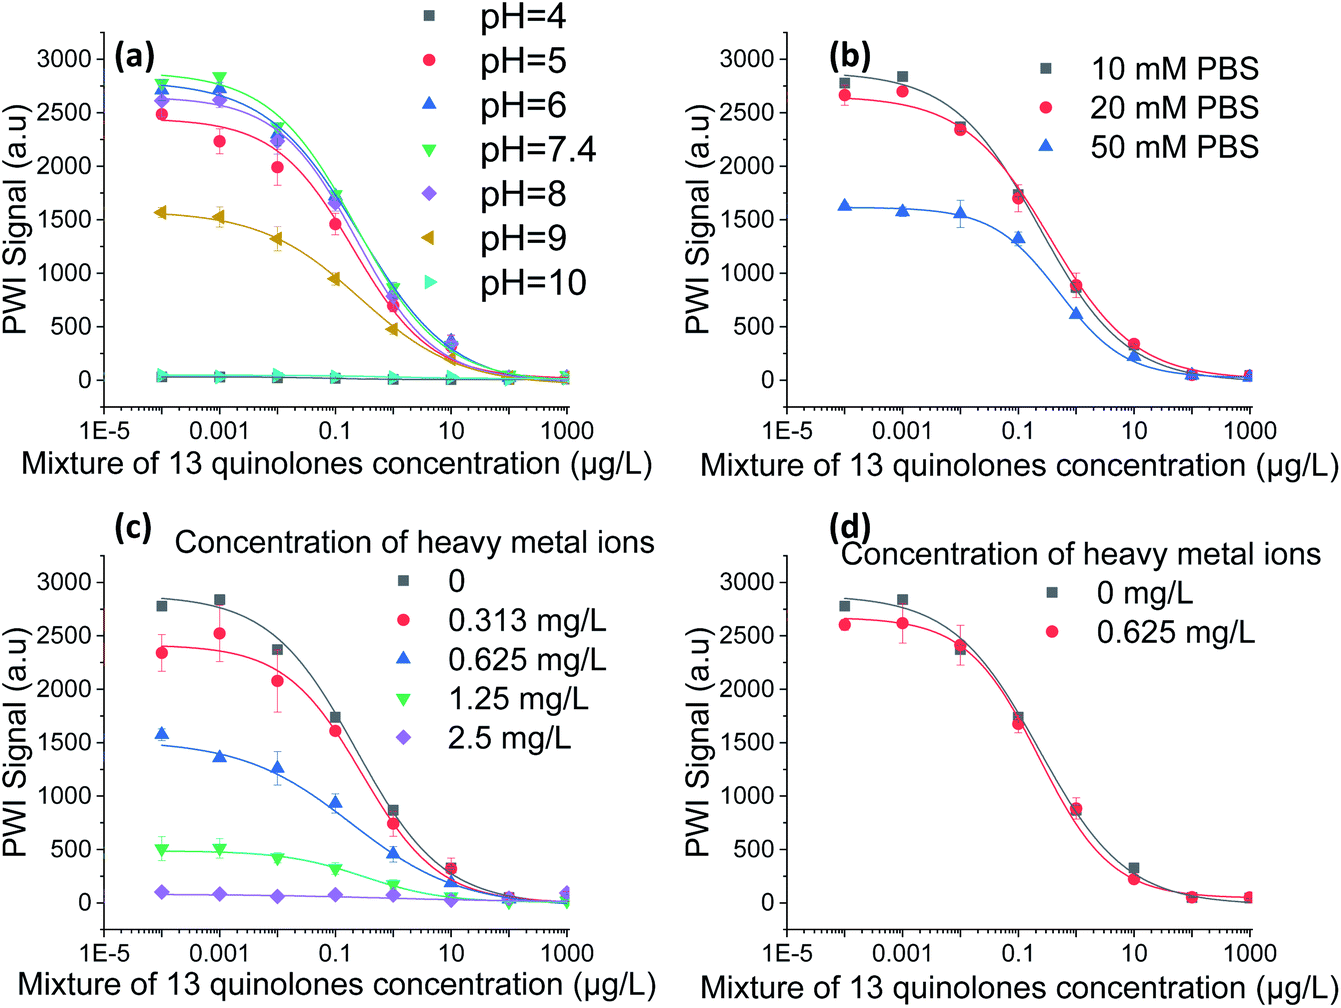 | ||
| Fig. 5 Matrix and buffer effects in the PWI immunoassay. (a) Effect of pH, (b) effect of ionic strength, (c) effect of heavy metal ions. (d) Elimination of heavy metal ion interference by 0.5% EDTA. | ||
Further, the high-concentration buffer solution would increase the ionic strength of solutions, which affects the sensitivity of the immunoassay.34 The calibration curves obtained in different ionic strength were shown in Fig. 5(b). The curve obtained in 50 mM PBS retained its characteristic shape, but its maximum signal intensity decreased to half of that recorded in 10 mM PBS. This indicated that the performance of the immunoassay was greatly affected by the ionic strength. The curve obtained in 20 mM PBS was similar to the curve obtained in 10 mM PBS, and there were no obvious changes in the linear range, LOD, IC50 or maximum signal intensity. The results demonstrate that 20 mM PBS buffer solution can balance the impacts from pH and the ionic strength.
Heavy metal ions are not only detrimental to antibodies, they also form complexes with antibodies. When complexes form, the antibodies can no longer bind with antigens.35 The effect of heavy metal ions on the immunoassay was investigated by preparing samples with a mixture of 27 heavy metals at different concentrations. As shown in Fig. 5(c), the signal decreased when heavy metal ions were in presence. The signal at a heavy metal ion concentration of 0.625 mg L−1 was reduced by halves of the maximum signal. At the heavy metal ion concentration of 2.5 mg L−1, the signal was barely detectable. Studies have shown that the chelating agent EDTA can inhibit the effect of heavy metal ions.21 Thus, 0.5% EDTA was added to the QNS standard solutions prepared with 0.625 mg L−1 heavy metal ions. The results shown in Fig. 5(d) demonstrated that the effect of heavy metal ions at a concentration of 0.625 mg L−1 was inhibited by EDTA. The usual concentration of heavy metals found in environmental water of China is 0.05–731.8 μg L−1 for individual heavy metal.36–39 Thus, 0.5% EDTA can eliminate the effect of heavy metal ions in surface water.
Based on the systematic analysis of matrix effects, the 20 mM PBS testing buffer with 0.5% EDTA was used to reduce matrix interference in the immunoassay. Prior to detection with real samples, the samples were simply filtered using 0.45 μm filter and then prepared with the testing buffer. This greatly simplified the pre-treatment process and shortened the detection time.
Reusability and stability
The reusability and stability of the immunochip were then evaluated. A 0.5% SDS solution (pH 1.9) was chosen to regenerate the immunochip. Fifty test cycles were performed with the same chip to test the robustness of the PWI (Fig. 6). No significant decrease in the signal intensity was observed after 50 test cycles. The relative SD of 50 test cycles was 2%, indicating that the regeneration process was effective. | ||
| Fig. 6 Regeneration of PWI immunoassay signal with the Cy5.5-labelled QNS antibody. | ||
Detection of analytes in real samples
To evaluate the applicability of the immunoassay for real sample analysis, two surface water samples and one fishpond water sample were collected in one River Basin in Guangxi Zhuang Autonomous Region. All samples were filtered with a 0.45 μm membrane filter and diluted with the buffer. 40 mM PBS testing buffer with 1% EDTA was used to dilute the water samples at a ratio of 1:1, so that the PBS concentration of mixed solutions is 20 mM and the concentration of EDTA is 0.5%. By spiking the samples with antibiotics at different concentration, the LIN and QNS recoveries from the three samples were between 86% and 136% (Tables 2 and 3), while the coefficients of variation were below 10%. The results demonstrated that the 20 mM PBS testing buffer with 0.5% EDTA and the planar waveguide immunosensor were suitable for the detection of antibiotics in surface water.
| Sample | Spike (μg L−1) | Detected (μg L−1) | RSD % | Recovery % | ||
|---|---|---|---|---|---|---|
| 1 | 2 | 3 | ||||
| Surface water 1 | 0.010 | 0.011 | 0.010 | 0.014 | 8.44 | 119.12 |
| 0.050 | 0.074 | 0.065 | 0.045 | 8.16 | 123.32 | |
| 0.500 | 0.455 | 0.455 | 0.446 | 1.00 | 90.49 | |
| Surface water 2 | 0.010 | 0.013 | 0.010 | 0.013 | 7.28 | 124.56 |
| 0.050 | 0.070 | 0.080 | 0.050 | 7.81 | 133.90 | |
| 0.500 | 0.449 | 0.550 | 0.388 | 8.39 | 92.51 | |
| Fishpond water 1 | 0.010 | 0.007 | 0.014 | 0.016 | 8.92 | 128.95 |
| 0.050 | 0.052 | 0.072 | 0.078 | 8.20 | 135.87 | |
| 0.500 | 0.452 | 0.424 | 0.415 | 3.61 | 86.19 | |
| Sample | Spike (μg L−1) | Detected (μg L−1) | RSD % | Recovery % | ||
|---|---|---|---|---|---|---|
| 1 | 2 | 3 | ||||
| Surface water 1 | 0.060 | 0.060 | 0.062 | 0.063 | 2.39 | 102.81 |
| 0.500 | 0.415 | 0.509 | 0.567 | 8.92 | 99.42 | |
| 1.250 | 1.260 | 1.150 | 1.242 | 3.94 | 97.39 | |
| Surface water 2 | 0.060 | 0.065 | 0.062 | 0.066 | 2.31 | 106.90 |
| 0.500 | 0.510 | 0.524 | 0.540 | 2.32 | 105.01 | |
| 1.250 | 1.390 | 1.302 | 1.288 | 3.39 | 106.13 | |
| Fishpond water 1 | 0.060 | 0.075 | 0.075 | 0.072 | 1.71 | 123.09 |
| 0.500 | 0.595 | 0.568 | 0.569 | 2.13 | 115.47 | |
| 1.250 | 1.463 | 1.422 | 1.422 | 1.36 | 114.85 | |
Conclusions
In summary, a simultaneous detection method was established for the multi-class antibiotics monitoring in real water. The PWI system operated with labelled LIN and QNS antibodies could quantitatively detect LIN. The assay enabled screening and detection of at least 13 QNS. Several immunoassay matrix effects were studied, and a testing buffer was developed to eliminate matrix interference. Results obtained with real water samples showed satisfactory recoveries that ranged from 86% to 136%. The planar waveguide immunosensor developed in this study is a promising tool for rapid, sensitive, selective, qualitative, and quantitative detection of antibiotics in environmental samples. Our future work would include other antibiotic families and other pollutants such as estrogens. Such studies would eventually allow us to detect multiple pollutants simultaneously.Conflicts of interest
There are no conflicts to declare.Acknowledgements
This work was supported by the Technology Research and Development Program of Guangxi Zhuang Autonomous Region, China (Grant No. AB17129007).Notes and references
- V. T. Andriole, Clin. Infect. Dis., 2005, 41(suppl. 2), S113 CrossRef CAS PubMed.
- Q. Q. Zhang, G. G. Ying and C. G. Pan, Environ. Sci. Technol., 2015, 49, 6772–6782 CrossRef CAS PubMed.
- X. Liu, S. Lu and W. Guo, Sci. Total Environ., 2018, 627, 1195–1208 CrossRef CAS PubMed.
- C. Wu, X. Huang and J. D. Witter, Ecotoxicol. Environ. Saf., 2014, 106, 19–26 CrossRef CAS PubMed.
- S. Li, W. Shi and H. Li, Sci. Total Environ., 2018, 636, 1009–1019 CrossRef CAS PubMed.
- W. Xu, G. Zhang and S. Zou, Water Environ. Res., 2009, 81, 248 CrossRef CAS PubMed.
- M. Goñi-Urriza, L. Pineau and M. Capdepuy, J. Antimicrob. Chemother., 2000, 46, 297–301 CrossRef.
- L. Guardabassi, D. M. A. L. F. Wong and A. Dalsgaard, Water Res., 2002, 36, 1955–1964 CrossRef CAS.
- A. Kirbiš, J. Marinšek and V. C. Flajs, Biomed. Chromatogr., 2010, 19, 259–265 CrossRef PubMed.
- L. A. Shervington, M. Abba and B. Hussain, J. Pharm. Biomed. Anal., 2005, 39, 769–775 CrossRef CAS.
- J. Kang, C. L. Fan and Q. Y. Chang, Anal. Methods, 2014, 6, 6285–6293 RSC.
- M. Kato, Y. Ihara and E. Nakata, Food Agric. Immunol., 2007, 18, 179–187 CrossRef CAS.
- H. Zhang, J. Jiang and Z. Wang, J. Zhejiang Univ., Sci., B, 2011, 12, 884 CrossRef CAS.
- L. H. Liu, X. H. Zhou and W. Q. Xu, RSC Adv., 2014, 4, 60227–60233 RSC.
- Y. Miao, N. Gan and H. X. Ren, Analyst, 2015, 140, 7663–7671 RSC.
- E. Zacco, R. Galve and J. Adrian, Compr. Anal. Chem., 2007, 49, e237–e241 Search PubMed.
- G. Cacciatore, M. Petz and S. Rachid, Anal. Chim. Acta, 2004, 520, 105–115 CrossRef CAS.
- F. Fernández, K. Hegnerová and M. Piliarik, Biosens. Bioelectron., 2010, 26, 1231–1238 CrossRef.
- B. G. Knecht, S. Angelika and D. Richard, Anal. Chem., 2004, 76, 646–654 CrossRef CAS PubMed.
- K. Kloth, M. Ryejohnsen and A. Didier, Analyst, 2009, 134, 1433–1439 RSC.
- F. Long, A.N. Zhu and J.-W. Sheng, Sensors, 2009, 9, 3000–3010 CrossRef CAS PubMed.
- S. R. Mujumdar, R. B. Mujumdar and C. M. Grant, Bioconjugate Chem., 1996, 7, 356 CrossRef CAS.
- X. H. Zhou, B. D. Song and H. C. Shi, Sens. Actuators, B, 2014, 198, 150–156 CrossRef CAS.
- H. Guo, X. Zhou and Z. Yan, Sens. Actuators, B, 2014, 194, 114–119 CrossRef CAS.
- H. Guo, X. Zhou and Y. Zhang, Food Chem., 2016, 197, 359–366 CrossRef CAS.
- J. W. Sheng, M. He and H. C. Shi, Anal. Chim. Acta, 2006, 572, 309–315 CrossRef CAS PubMed.
- A. R. Midgley, G. D. Niswender and R. W. Rebar, Acta Endocrinol. Suppl., 1969, 142, 163 Search PubMed.
- J. Adrian, F. Fernández and F. Sánchez-Baeza, Journal of Agricultural, 2012, 57, 3837–3846 Search PubMed.
- M. H. Chiu, H. H. Yang and C. H. Liu, J. Chromatogr. B: Anal. Technol. Biomed. Life Sci., 2009, 877, 991–994 CrossRef CAS PubMed.
- C. Yang, Z. Zhang and Z. Shi, Microchim. Acta, 2010, 168, 293–298 CrossRef CAS.
- M. A. Burkin and I. A. Galvidis, J. Agric. Food Chem., 2010, 58, 9893–9898 CrossRef CAS PubMed.
- B. Sara, D. C. Antonio and L. Aldo, Rapid Commun. Mass Spectrom., 2010, 21, 237–246 Search PubMed.
- M. T. Matikainen, J. Immunol. Methods, 1984, 75, 211–216 CrossRef CAS.
- A. Oubiña, J. Gascón and D. Barceló, Anal. Chim. Acta, 1997, 347, 121–130 CrossRef.
- S. K. Sharma, P. Goloubinoff and P. J. B. Christen, Biochem. Biophys. Res. Commun., 2008, 372, 341–345 CrossRef CAS.
- Y. Tao, Z. Yuan and M. Wei, Environ. Monit. Assess., 2012, 184, 4367–4382 CrossRef CAS PubMed.
- Q. Meng, J. Zhang and Z. Zhang, Environ. Sci. Pollut. Res., 2016, 23, 8091–8103 CrossRef CAS PubMed.
- G. Li, G. Liu and C. Zhou, Environ. Monit. Assess., 2012, 184, 2763 CrossRef CAS PubMed.
- B. Bi, X. Liu and X. Guo, Environ. Sci. Pollut. Res., 2018, 25, 34076–34090 CrossRef CAS.
| This journal is © The Royal Society of Chemistry 2019 |