 Open Access Article
Creative Commons Attribution 3.0 Unported Licence
Microwave magnetoimpedance and ferromagnetic resonance in Pr0.6Sr0.4MnO3
A. Chanda and
R. Mahendiran
 *
*
Physics Department, National University of Singapore, 2 Science Drive 3, Singapore-117551, Republic of Singapore. E-mail: phyrm@nus.edu.sg
First published on 17th September 2019
Abstract
We report the magnetic field dependence of electrical impedance (magnetoimpedance) of a ferromagnetic Pr0.6Sr0.4MnO3 sample carrying alternating current (ac) of frequency f = 1 MHz to 3 GHz measured using an impedance analyzer and broad band ferromagnetic resonance (f = 2 to 18 GHz) measured using a coplanar wave guide based spectrometer. Ac magnetoresistance is much larger than dc magnetoresistance and its sign at low magnetic fields changes from negative to positive with increasing frequency of the ac current. The field dependence of ac magnetoresistance shows a peak around Hdc = 0 for low frequencies but a double peak feature emerges at Hdc = ±Hp at higher frequencies and it shifts to higher magnetic field as the frequency of ac current increases. The field derivative of microwave power absorption measured by the broad band spectrometer shows features of ferromagnetic resonance and the resonance field increases with increasing frequency of microwave radiation following Kittel's equation for ferromagnetic resonance. A close correlation is found between the ferromagnetic resonance line shape and the positive peak in the ac magnetoresistance, which suggests the possibility of electrical detection of ferromagnetic resonance using high frequency current injected into a conducting magnetic sample.
1. Introduction
The Mn-based perovskites known as manganites (R1−xAxMnO3 where R = La3+, Pr3+, etc., and A = Sr2+, Ca2+ etc.) have been extensively studied over the last three decades because of the two most exciting physical phenomena exhibited by them: colossal negative magnetoresistance for lighter rare earth ions (R = La, Pr, Nd)1,2 and spin-driven ferroelectricity in parent RMnO3 for heavy rare earth ions (R = Tb, Tm, Y).3 Parent compounds (RMnO3) possessing only Mn3+ ions are antiferromagnetic insulators whereas divalent cation substituted compounds containing mixed valent ions (Mn3+: t32ge1g and Mn4+: t32ge0g) are ferromagnetic metals for x = 0.2–0.45 and antiferromagnetic insulators for 0.5 ≤ x ≤ 1 for R = La. The compositional range for ferromagnetism shrinks and ferromagnetic Curie temperature decreases as the ionic radius of R ion decreases. The influence of magnetic field on resistivity is greatest at the paramagnetic–ferromagnetic phase boundary. Majority of available studies focused on the magnetoresistance measured with a direct-current (dc) flowing in samples. Magnetoresistance in response to an alternating current (ac) through the sample barely received attention despite some claims of remarkable enhancement in the magnitude of ac magnetoresistance in the radio frequency regime (f = 1–15 MHz) compared to dc magnetoresistance in a field of few hundreds of Oersted.4–8 Such a large enhancement in the ac magnetoresistance with alternating currents has potential for practical applications compared to the dc magnetoresistance if the low-field sensitivity can be further improved.Since hopping of the eg electron between Mn3+(t32ge1g) and Mn4+(t32ge0g) via the intervening oxygen anion is responsible for electrical conduction in manganites, it is also of scientific curiosity to know how the resistivity and magnetoresistance are affected if the eg electron is forced to oscillate at MHz and GHz frequencies. M. Dominguez et al.9 reported 70% magnetoresistance for 600 Oe near its Curie temperature (TC) in Nd0.7Sr0.3MnO3 thin film and V. Srinuvasu et al.10 found 80% magnetoresistance for a field of 600 Oe near TC in La0.7Ba0.3MnO3 powder when these samples placed inside a microwave resonant cavity were irradiated with electromagnetic fields in microwave frequency range (f = 10 GHz). Microwave magnetoresistance was estimated from changes in microwave reflectivity of the cavity in absence and in presence of a dc magnetic field. In contrast to these reports, here, we report microwave magnetotransport in Pr0.6Sr0.4MnO3 by passing alternating current (ac) of frequency f through the sample and measuring its electrical impedance in presence of an external dc magnetic field.
Pr0.6Sr0.4MnO3 is ferromagnetic at room temperature (TC = 305 K) but its magnetization shows a step-like change around TS = 89 K (≪TC), which is apparently triggered by orthorhombic (Pnma space group) to monoclinic (I/2a space group) structural transition.11,12 Interestingly, this compound exhibits normal and inverse magnetocaloric effects at TC and TS, respectively.13 A close correlation was also found between the magnetic entropy change, magnetothermopower and magnetization. While dc resistivity showed a very weak anomaly at TS in a single crystalline sample,14 it was not detectable in the polycrystalline sample. However, ac resistance (1 MHz < f < 5 MHz) showed a pronounced anomaly at TS. It is of our interest to understand the behavior of magnetoresistance at frequencies higher than 5 MHz. Here, we extend the magnetotransport measurement in Pr0.6Sr0.4MnO3 over a wide frequency range (f = 1 MHz to 3 GHz) in response to radio frequency current flowing through the sample. In addition, we also report microwave absorption for multiple frequencies (f = 2 to 10 GHz) of microwave electromagnetic field. Our results indicate that high frequency magnetoimpedance shows features of ferromagnetic resonance (FMR). Although FMR and electron spin resonance (ESR) in K- and Na-doped Pr0.6Sr0.4MnO3 (ref. 15) as well as other manganites16–18 have been studied using conventional MW cavity resonators, FMR excited by MW current flowing through the sample has not been investigated. Here, we demonstrate a broadband detection of FMR in Pr0.6Sr0.4MnO3 by electrical means using an impedance analyzer. The main advantage of our magnetoimpedance (MI) method is the broad operational frequency range unlike the conventional MW cavity resonator based technique which usually operates at a fixed frequency (around 9.8 GHz) in X-band. Because the MI technique probes spin dynamics, it can be exploited to obtain Gilbert's damping parameter, which is not possible with a single frequency cavity resonator FMR technique.
2. Experimental details
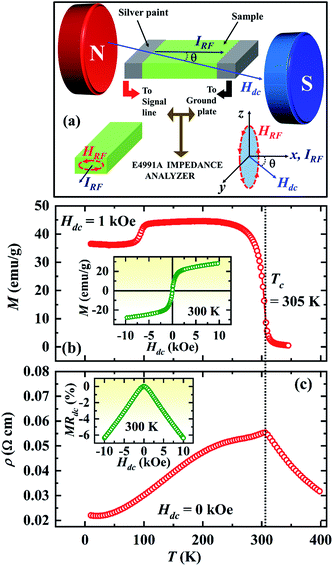
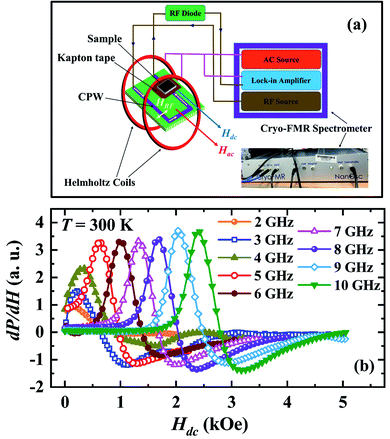
Polycrystalline sample of Pr0.6Sr0.4MnO3 was prepared by conventional solid state reaction method. It crystallizes in single phase with orthorhombic structure (space group Pnma) at room temperature.19 Magnetization was measured using a vibrating sample magnetometer (VSM) and four probe electrical resistivity was measured in a Physical Property Measuring System (PPMS). The sample was cut into a rectangular plate of dimensions 5 mm × 3 mm × 2 mm for both dc resistivity and magnetoimpedance measurement. A radio frequency impedance analyzer (Agilent E4991A) was used to measure the resistive (R) and reactive (X) components of the complex impedance, Z(f) = R(f) + iX(f) of the sample by employing the radio frequency (rf) current–voltage method. As shown in the Fig. 1(a), the sample placed on an Agilent test probe stage is attached to the signal line at one end and the other end of the sample is connected to the ground plate using silver paint. To avoid electrical contact between the sample surface and the ground plate, a layer of kapton tape was inserted between them. The rf current flows through the sample from the signal line to the ground plane. The test probe stage is placed at the center of an electromagnet. We define the angle between the direction of rf current flow and that of the dc magnetic field (Hdc) produced by the electromagnet by θ. The R and X at selected frequencies were measured while sweeping Hdc for θ = 0°, 30°, 60° and 90°. We define dc magnetoresistance as MRdc = [ρ(H) − ρ(H = 0)]/ρ(H = 0) × 100%, where, ρ is the dc electrical resistivity of the sample. AC magnetoresistance is defined as MRac = [R(H, f) − R(H = 0, f)]/R(H = 0, f) × 100% for a frequency f of alternating current and the magnetoreactance is defined as MX = [X(H, f) − X(H = 0, f)]/X(H = 0, f) × 100%. We also define magnetoimpedance as, MZ = [Z(H, f) − Z(H = 0, f)]/Z(H = 0, f) × 100%, where, Z = (R2 + X2)1/2. The magnetic field dependence of the field derivative of microwave power absorption (dP/dH) was measured using a commercial broadband ferromagnetic resonance spectrometer (NanOsc Phase-FMR from Quantum Design Inc.) that makes use of coplanar waveguide method. The PPMS was used to provide an in-plane dc magnetic field (Hdc) in such a way that the rf magnetic field (Hrf) generated in the waveguide is perpendicular to Hdc (see Fig. 4(a)). The dc magnetic field was modulated using a pair of Helmholtz coils, which provided low amplitude (1 Oe) and low frequency (440 Hz) ac magnetic field (Hac). Because of the field modulation and the lock-in technique used, microwave power absorption was recorded as the field derivative (dP/dH) as like in conventional ESR spectrometers.3. Results
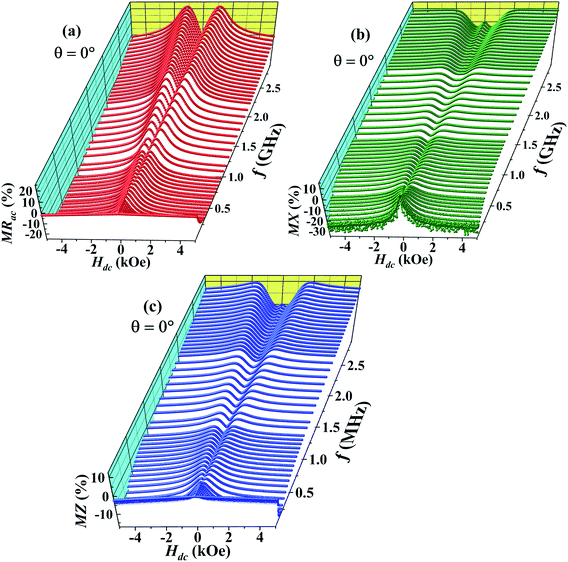
The main panel of Fig. 1(b) shows M(T) of Pr0.6Sr0.4MnO3 sample in a dc magnetic field of Hdc = 1 kOe while cooling from T = 350 K. The ferromagnetic Curie temperature (TC) determined from the minimum of dM/dT curve is 305 K. The inset of Fig. 1(b) shows the magnetic field dependence of magnetization at T = 300 K which confirms the soft ferromagnetic nature of the sample. The temperature dependence of dc resistivity ρ(T) (see the main panel of Fig. 1(c)) measured in zero external magnetic field shows a change from thermally activated behavior in the paramagnetic state to metallic behavior below TC with a peak occurring at TC. The dc magnetoresistance (MRdc) at T = 300 K (inset of Fig. 1(c)) shows a single peak at Hdc = 0 with a negative sign and increases in magnitude. The absolute value of MRdc is 6% at Hdc = ±10 kOe.Fig. 2(a) shows the magnetic field dependence of the ac magnetoresistance (MRac) at room temperature for different frequencies of the alternating current (f = 1 MHz to 3 GHz). The dc magnetic field (Hdc) produced by the electromagnet is parallel to the direction of rf current (Irf) passing through the sample (θ = 0°). MRac is negative at f = 1 MHz with an absolute value of 2% at Hdc = 5 kOe and shows a single peak at Hdc = 0. As the frequency of the alternating current increases, the absolute value of MRac increases up to a certain frequency (∼500 MHz) but decreases for still higher frequencies. Above f = 500 MHz, the single peak at Hdc = 0 splits into two symmetrical peaks at Hdc = ±Hp on either sides of the zero field and both these peaks migrate towards higher magnetic fields as f increases further. The sample shows a positive ac MR in the field range −Hp ≤ Hdc ≤ +Hp for f > 500 MHz.
Fig. 2(b) shows the magnetic field dependence of the magnetoreactance (MX). MX also shows double peaks at Hdc = ±Hq(Hq > Hp) above 500 MHz which also move towards higher field with increasing frequency. The double peaks in MX at ±Hq, unlike in MRac, fade above f = 1 GHz. In addition to the double peaks, MX also shows a single peak centered at origin (Hdc = 0) above 2 GHz culminating in double dips between Hdc = 0 and ±Hq. The field dependence of magnetoimpedance (MZ) shown in Fig. 2(c) is almost identical to that of MX.
The main panel of Fig. 3(a) displays the frequency dependence of MRac at the highest field for θ = 0°. The absolute value of negative ac MR increases with increasing frequency and becomes maximum around 500 MHz (∼22%) but decreases towards zero with further increasing frequency. On the other hand, the value of positive ac MR at Hdc = ±Hp increases gradually with increasing frequency and reaches ∼23% (see the inset of Fig. 3(a)) for f = 3 GHz. It is noteworthy that the value of MRdc at 5 kOe is only 3% which is almost 7 times lower than the value of MRac at the same field for f = 500 MHz.
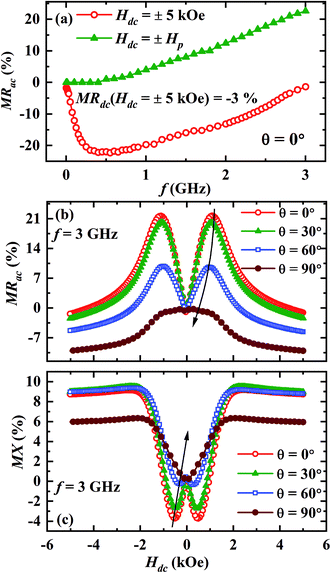 | ||
| Fig. 3 (a) The ac MR as a function of frequency at room temperature for θ = 0°, magnetic field dependence of (b) MRac and (c) MX for θ = 0°, 30°, 60° and 90° at a fixed frequency f = 3 GHz. | ||
We have also studied how the observed anomalous features vary if the angle between radio frequency (rf) current direction and the direction of dc magnetic field (θ) is changed. MRac and MX for θ = 0°, 30°, 60° and 90° are depicted in the Fig. 3(b) and (c), respectively for f = 3 GHz. It is clear that the intensity of the double peaks at Hdc = ±Hp in MRac as well as the double dips at Hdc = ±Hq in MX decreases with increasing θ. Moreover, the double peak (dip) positions in MRac (MX) also shift to lower fields as θ increases and they disappear completely for θ = 90°.
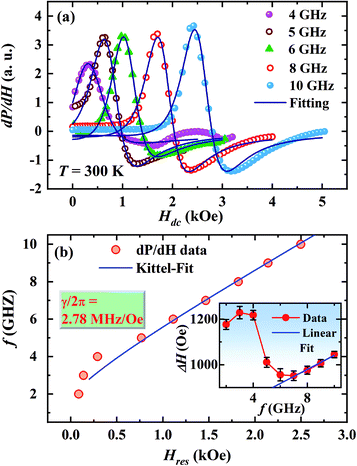
Fig. 4(b) shows the magnetic field dependence of microwave power absorption recorded as the field derivative (dP/dH) for different frequencies of the microwave magnetic field between f = 2–10 GHz at room temperature. The microwave absorption signal for each frequency exhibits a magnetic resonance feature a dip at a higher field followed by a peak at a lower field when the dc field is reduced from a high value to zero. The signal for 2 GHz shows a peak around Hdc = 160 Oe. The peak in dP/dH shifts towards higher Hdc as the frequency of the microwave electromagnetic field increases similar to the behavior of ac MR.
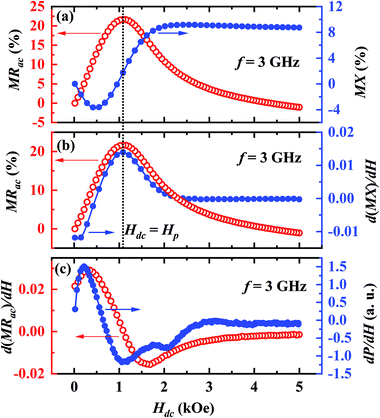
To understand a possible link between the anomalous behaviors of MRac and MX, we plot the MRac (left scale) and the MX (right scale) together in a single graph for f = 3 GHz in Fig. 5(a). A careful look reveals that the peak in MRac isotherm almost coincides with the point of inflection in MX isotherm but MX is nearly independent of Hdc above 2 kOe unlike that of the MRac. It is clear from the Fig. 5(b) that the peak in MRac (left y-axis) coincides with the peak in the field derivative of MX (right y-axis). In Fig. 5(c), we plot the field derivative of the MRac on the left y-axis and dP/dH on the right y-axis for f = 3 GHz. It is evident that the peak positions of d(MRac)/dH and dP/dH closely match with each other. However, the linewidth of d(MRac)/dH is higher than that of dP/dH.
4. Discussion
We summarize important observations from the above results as follows: (1) Pr0.6Sr0.4MnO3 is a room temperature ferromagnet with TC = 305 K. (2) The ac magnetoresistance MRac is negative and shows a peak at Hdc = 0 for f ≤ 500 MHz but exhibits positive double peaks at Hdc = ±Hp for higher frequencies. (3) The absolute value of negative ac MR at Hdc = 5 kOe increases with frequency and becomes maximum (∼22%) at f = 500 MHz which is significantly higher than the value of dc MR (∼−3%) at the same field. (4) The value of positive MRac at Hdc = ±Hp increases with frequency and becomes ∼+23% for f = 3 GHz. (5) As θ increases from resonant (0°) to non-resonant (90°) configuration, the double peak at Hdc = ±Hp in the MRac shifts towards the origin as well as the value of MRac at Hdc = ±Hp decreases considerably. (6) The magnetic field corresponding to the peak in MRac isotherm coincides with the point of inflection of MX isotherm. (7) The dP/dH shows a Lorentzian line shape and the maximum in dP/dH shifts towards higher Hdc with increasing frequency. (8) The peak positions in d(MRac)/dH and dP/dH closely match with each other.Let us first shed some light on the origin of such anomalous behavior of the ac magnetotransport in this sample. The application of a dc electric field to the sample forces the mobile eg electron to hop between Mn3+ and Mn4+ ions in the background of immobile t32g core electrons. The hopping is dependent on the relative angle between t2g spins of Mn ions. While dc or low frequency ac current flows uniformly throughout the volume of the sample, high frequency current tends to flow only in thin surface layer of thickness “δ” due to skin effect. The “skin depth” δ decreases with increasing angular frequency (ω = 2πf) of the ac current and dependent on dc resistivity (ρ) and transverse magnetic permeability (μt) of the sample through the expression,  where, μ0 is the free space permeability. Instead of resistance for dc current, we consider impedance for alternating current. The electrical impedance of a rectangular slab with thickness 2t and infinite width is given by,20
| Z = Rdckt coth (kt) | (1) |
 | (2) |
Besides the skin effect, the flow of radio frequency (rf) current in the sample generates a transverse circular rf magnetic field (Hrf) which interacts with the magnetization of the sample and hence, affects the transverse component of the magnetic permeability (μt). The transverse permeability is a complex quantity and given by  where,
  is the in-phase component (magnetization is in-phase with the rf magnetic field) and
  is the out-of-phase component (magnetization is not in-phase with the rf magnetic field).
Hence, the complex surface impedance is given by,21
 | (3) |
 and
and  .
.
Hence, the real (R) and imaginary (X) parts of the complex impedance are  and
and , respectively. Since μt is affected by external dc magnetic field, it influences the field dependence of both R and X. So, unlike dc magnetoresistance, ac magnetoresistance in the high frequency regime is dominated mostly by magnetization dynamics of the sample rather than changes in scattering rate of the conducting electrons.
When the applied dc magnetic field (Hdc) is smaller than the saturation field, μt of the sample depends on the relative alignment of the magnetic easy axis and the direction of Hdc. If Hdc is parallel to the easy axis, μt decreases monotonically from its maximum value in zero field to nonmagnetic limit (μt = 1) with increasing strength of the dc magnetic field. However, if Hdc is perpendicular to the magnetic easy axis, magnetization of the sample rotates but does not switch towards Hdc unless Hdc exceeds the anisotropy field Hk. The transverse permeability is expected to diverge at H = Hk for an ideal system but usually shows a peak at Hk in non-ideal case,20–22 Since,  , the ac resistance or surface resistance increases with Hdc and shows a peak at Hdc = ±Hp, where Hp is close to Hk, which explains the appearance of double peaks in MRac of our sample in the frequency range f = 500–1000 MHz for the orthogonal configuration of Hdc and Hrf (θ = 0°). The disappearance of double peak behaviour in MRac for θ = 90° is expected because μt will decrease monotonically with Hdc for the parallel configuration of Hdc and Hrf. The shift of R-peak at Hdc = ±Hp with frequency is small in the frequency regime f = 500–1000 MHz which could be due to dispersion in the anisotropy field (only few tens of Oe).23 However, gyromagnetic effect, i.e., precession of magnetization about the direction of dc magnetic field dominates at frequencies higher than 500 MHz. When the frequency of magnetization precession matches with that of the rf magnetic field, steady state precession of magnetization, i.e., ferromagnetic resonance (FMR) occurs in the sample. The FMR frequency fres for a thin plate like sample increases with the frequency following the Kittel's expression when Hdc is perpendicular to Hrf,24
 | (4) |
Britel et al., showed that a close link exists between the magnetoimpedance measured by electrical method and the FMR recorded using a microwave electron spin resonance (ESR) spectrometer.25 In an ESR spectrometer, a sample placed inside a microwave (MW) resonant cavity is irradiated with electromagnetic field in microwave range, usually 9–10 GHz. The magnetic component of electromagnetic field impinging on the sample inside MW cavity is transverse to the dc magnetic field produced externally by an electromagnet. Similarly, the rf/MW magnetic field generated by rf/MW current in the sample is also transverse to the dc magnetic field in our magnetoimpedance measurement when θ = 0°. The sample absorbs maximum power from the MW electromagnetic field during FMR. The power absorption (P) in the sample per unit volume is related to the out-of-phase component of transverse permeability through the expression
 | (5) |
![[thin space (1/6-em)]](https://www.rsc.org/images/entities/char_2009.gif) cos
cos![[thin space (1/6-em)]](https://www.rsc.org/images/entities/char_2009.gif) ωt),
ωt),  is the out-of-phase component of transverse susceptibility.
  goes through a maximum at the resonance field (Hres) and hence, P(Hdc) also shows maximum at Hdc = Hres. Since
  the appearance of peak in MRac at Hdc = ±Hp can be considered as a consequence of the maximum power absorption by the sample due to FMR. Similar behavior was reported in magnetic field dependence of impedance (Z) for Fe–Co–Si–B amorphous ribbons26 where the field corresponding to the peak in real component of Z shifts rapidly to higher fields with increasing frequency. D. de Cos et al.,27 also found a close correlation between dRac/dH obtained from magnetoimpedance and dP/dH obtained from microwave power absorption in cavity resonator.
The magnetic field dependence of power absorption, P(Hdc) usually shows a Lorentzian line shape described by the expression,28
 | (6) |
 | (7) |
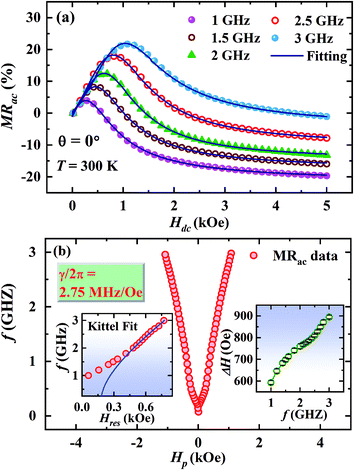
Fig. 6(a) displays the fitting of the MRac line shape with the eqn (7) for a few selected frequencies between f = 1 and 3 GHz. The main panel of Fig. 6(b) shows Hdc corresponding to the peak in MRac on x-scale and the corresponding frequency on y-scale which clearly indicates the evolution of double peaks and their rapid upshifting in Hdc with increasing frequency of ac current. The plot f vs. resonance field (Hres) above 1 GHz obtained from the fitting of the MRac line shape are shown in the left inset of Fig. 6(b). Fitting of the f vs. Hres curve with the Kittel's equation for FMR described by eqn (4) yields γ/2π = 2.75 MHz Oe−1 and hence, g = 1.9657 which is slightly lower than the theoretically expected value of g = 2 for ferromagnetic manganites.32 Belmeguenai et al.33 obtained g = 1.95 in La0.7Sr0.3MnO3 thin films using the microstrip FMR (MS-FMR) technique. In order to obtain an accurate value of g factor, measurements need to be extended to several tens of GHz. As shown in the right inset of Fig. 6(b), ΔH increases non-linearly with frequency in the low frequency region but linearly in the high frequency regime. We have also extracted the values of 4πMS and Hk from the fitting which are 1900 ± 70 Oe and 190 ± 20 Oe, respectively.
In order to confirm whether the observed anomalous behaviour of the MRac corresponds to FMR, we have fitted the field derivative of the power absorption (dP/dH) by a combined function containing derivatives of symmetric and antisymmetric Lorentzian functions as34
 | (8) |
The extracted the values of 4πMS and Hk from the fitting of dP/dH line shape are 2200 ± 100 Oe and 190 ± 30 Oe, respectively. It is to be noted that the value of Hk obtained from both magnetoimpedance and microwave absorption measurements are close to Hk = 200 ± 10 Oe estimated from the fitting of M(H) isotherm with the law of approach to saturation model which is expressed as,35
 | (9) |
 . The anisotropy field Hk can be estimated from the relation: Hk = 2K/μ0MS. The frequency dependence of ΔH extracted from the fitting of dP/dH curve is shown in the inset of Fig. 7(b) which clearly shows a nonlinear dependence below 6 GHz but a linear dependence for higher frequencies.
Nonlinear f-dependence of ΔH was found in various magnetic nanostructures which was attributed to the presence of two relaxation processes: the intrinsic Gilbert's damping and the two-magnon scattering.36 The two-magnon scattering is an extrinsic damping mechanism which causes inhomogeneous broadening of ΔH and responsible for damping enhancement. We have fitted the f dependence of ΔH above 6 GHz with the following equation,37
 | (10) |
In recent years, electrical detection of FMR using microstrip (MS) or co-planar waveguide (CPW) is gaining popularity to investigate spin dynamics in magnetic nanostructures.33,40 These techniques make use of a vector network analyzer (VNA) or a combination of MW signal generator, microwave diode and lock-in amplifier. The sample to be investigated is placed on the signal line of CPW or MS and the microwave magnetic field arising from the flow of MW current in the signal line induces spin precession in the sample. On the contrary, RF/WW current is directly injected into the sample in our method and our technique requires only an impedance analyzer to source MW current and record the impedance of the sample. Unlike a network analyzer, the rf impedance analyzer does not need a 50 ohm impedance matching. Even though the maximum attainable frequency is limited to 3 GHz, there are ample opportunities to exploit this technique to other ferromagnetic systems.
5. Summary
In summary, we have studied the magnetic field dependence of electrical impedance in the room temperature ferromagnet Pr0.6Sr0.4MnO3 using an impedance analyzer by passing alternating current in the frequency range 1 MHz to 3 GHz directly through the sample. Our magnetoimpedance studies show signature of ferromagnetic resonance which was also confirmed by microwave absorption measurements for multiple frequencies (f = 2 to 10 GHz) of microwave electromagnetic field using a commercial broadband ferromagnetic resonance spectrometer. Our line shape analysis indicates a large Gilbert's damping in this sample (α = 13.6 × 10⁻³). Our results show that high-frequency magnetoimpedance can be used as a materials characterization tool. Ferromagnetic resonance do find applications in catalysis.41 Application of this magnetoimpedance technique to other conducting magnetic oxides may open up a new area of research direction in physical chemistry.Conflicts of interest
There are no conflicts to declare.Acknowledgements
R. M. acknowledges the Ministry of Education, Singapore for supporting this work (Grant numbers: R144-000-381-112 and R144-000-373-112).References
- C. N. R. Rao and A. K. Raychaudhuri, “Colossal Magnetoresistance, Charge Ordering and Related Properties of Manganese Oxides”, ed. C. N. R. Rao and B. Raveau, World Scientific, Singapore, 1998 pp. 1–42 Search PubMed.
- Y. Tokura and Y. Tomioka, J. Magn. Magn. Mater., 1999, 200, 1 CrossRef CAS.
- T. Aoyama, K. Yamauchi, A. Iyama, S. Picozzi, K. Shimizu and T. Kimura, Nat. Commun., 2014, 5, 4927 CrossRef CAS PubMed; T. Arima, J. Phys. Soc. Jpn., 2011, 80, 052011 CrossRef.
- M. Aparnadevi and R. Mahendiran, AIP Adv., 2013, 3, 012114 CrossRef.
- H. Qin, J. Hu, B. Li, Y. Hao, J. Chen and M. Jiang, J. Magn. Magn. Mater., 2008, 320, 2770 CrossRef CAS; J. Hu, H. Qin, B. Li, Y. Wang and Y. Zhang, J. Magn. Magn. Mater., 2011, 323, 1185 CrossRef.
- A. Rebello, V. Naik and R. Mahendiran, J. Appl. Phys., 2009, 106, 073905 CrossRef.
- H. Chen, J. Hu, J. Chen, Y. Wang and Z. Wang, J. Appl. Phys., 2002, 91, 10003 CrossRef.
- B. Singh, Phys. Chem. Chem. Phys., 2016, 18, 12947 RSC.
- M. Dominguez, S. M. Bhagat, S. E. Lofland, J. S. Ramachandran, G. C. Xiong, H. L. Ju, T. Venkatesan and R. L. Greene, Europhys. Lett., 1995, 32, 349 CrossRef CAS.
- V. V. Srinivasu, S. E. Lofland, S. M. Bhagat, K. Ghosh and S. Tyagi, J. Appl. Phys., 1999, 86, 1067 CrossRef CAS.
- C. Ritter, P. G. Radaelli, M. R. Lees, J. Baratt, G. Balakrishnan and D. M. Paul, J. Solid State Chem., 1996, 127, 276 CrossRef CAS.
- S. Rößler, H. S. Nair, U. K. Rößler, C. M. N. Kumar, S. Elizabeth and S. Wirth, Phys. Rev. B: Condens. Matter Mater. Phys., 2011, 84, 184422 CrossRef.
- D. V. Maheswar Repaka, T. S. Tripathi, M. Aparnadevi and R. Mahendiran, J. Appl. Phys., 2012, 112, 123915 CrossRef.
- S. Rosler, S. Harikrishnan, C. M. N. Kumar, H. L. Bhat, S. Elizabeth, U. K. Rosler, F. Steglich and S. Wirth, J. Supercond. Novel Magn., 2009, 22, 205 CrossRef.
- R. Thaljaoui, W. Boujelben, M. Pękała, J. Szydłowska and A. Cheikhrouhou, J. Alloys Compd., 2012, 526, 98 CrossRef CAS; R. Thaljaoui, W. Boujelben, M. Pekała, J. Szydłowska and A. Cheikhrouhou, EPJ Web Conf., 2012, 29, 00050 CrossRef.
- A. I. Shames, E. Rozenberg, W. H. McCarroll, M. Greenblatt and G. Gorodetsky, Phys. Rev. B: Condens. Matter Mater. Phys., 2001, 64, 172401 CrossRef.
- G. Srinivasan and R. Suryanarayanan, J. Magn. Magn. Mater., 2002, 242, 686 CrossRef.
- J. Yang, X. Rong, D. Suter and Y. P. Sun, Phys. Chem. Chem. Phys., 2011, 13, 16343 RSC.
- A. Chanda and R. Mahendiran, J. Appl. Phys., 2018, 124, 043902 CrossRef.
- L. Kraus, Sens. Actuators, A, 2003, 106, 187 CrossRef CAS.
- L. V. Panina, K. Mohri and T. Uchiyama, Phys. A, 1997, 241, 429 CrossRef CAS; L. V. Panina, K. Mohri, K. Bushida and M. Noda, J. Appl. Phys., 1994, 76, 6198 CrossRef.
- M. Ipatov, V. Zhukova, A. Zhuklov and J. Gonzalez, Sci. Rep., 2016, 6, 36180 CrossRef CAS PubMed.
- A. M. H. de Andrade, M. A. Corrêa, A. D. C. Viegas, F. Bohn and R. L. Sommer, J. Appl. Phys., 2014, 115, 103908 CrossRef.
- C. Kittel, Phys. Rev., 1948, 73, 155 CrossRef CAS.
- M. R. Britel, D. Ménard, L. G. Melo, P. Ciureanu, A. Yelon, R. W. Cochrane, M. Rouabhi and B. Cornut, Appl. Phys. Lett., 2000, 77, 2737 CrossRef CAS.
- J. M. Barandiarán, A. García-Arribas and D. de Cos, J. Appl. Phys., 2006, 99, 103904 CrossRef.
- D. de Cos, G. Alvarez, A. Garia-Arribas, H. Montiel, J. M. Barandiaran, R. Zamorono and R. Valenzuela, Sens. Actuators, A, 2008, 142, 485 CrossRef CAS.
- Y.-Y. Song, S. Kalarickal and C. E. Patton, J. Appl. Phys., 2003, 94, 5103 CrossRef CAS.
- M. Harder, Z. X. Cao, Y. S. Gui, X. L. Fan and C.-M. Hu, Phys. Rev. B: Condens. Matter Mater. Phys., 2011, 84, 054423 CrossRef.
- T. Nan, S. Emori, C. T. Boone, X. Wang, T. M. Oxholm, J. G. Jones, B. M. Howe, G. J. Brown and N. X. Sun, Phys. Rev. B: Condens. Matter Mater. Phys., 2015, 91, 214416 CrossRef.
- N. Mecking, Y. S. Gui and C.-M. Hu, Phys. Rev. B: Condens. Matter Mater. Phys., 2007, 76, 224430 CrossRef.
- V. A. Ivanshin, J. Deisenhofer, H.-A. Krug von Nidda, A. Loidl, A. A. Mukhin, A. M. Balbashov and M. V. Eremin, Phys. Rev. B: Condens. Matter Mater. Phys., 2000, 61, 6213 CrossRef CAS.
- M. Belmeguenai, S. Mercone, C. Adamo, L. Méchin, C. Fur, P. Monod, P. Moch and D. G. Schlom, Phys. Rev. B: Condens. Matter Mater. Phys., 2010, 81, 054410 CrossRef.
- P. Dürrenfeld, F. Gerhard, J. Chico, R. K. Dumas, M. Ranjbar, A. Bergman, L. Bergqvist, A. Delin, C. Gould, L. W. Molenkamp and J. Akerman, Phys. Rev. B: Condens. Matter Mater. Phys., 2015, 92, 214424 CrossRef.
- B. D. Cullity, and C. D. Graham, Introduction to magnetic materials. John Wiley & Sons, 2011, p. 325 Search PubMed.
- K. Lenz, H. Wende, W. Kuch and K. Baberschke, Phys. Rev. B: Condens. Matter Mater. Phys., 2006, 73, 144424 CrossRef.
- S. S. Kalarickal, P. Krivosik, M. Wu, C. E. Patton, M. L. Schneider, P. Kabos, T. J. Silva and J. P. Nibarger, J. Appl. Phys., 2006, 99, 093909 CrossRef.
- Q. Qin, S. He, W. Song, P. Yang, Q. Wu, Y. P. Feng and J. Chen, Appl. Phys. Lett., 2017, 110, 112401 CrossRef.
- G. Y. Luo, M. Belmeguenai, Y. Roussigné, C. R. Chang, J. G. Lin and S. M. Chérif, AIP Adv., 2015, 5, 097148 CrossRef.
- H. K. Lee, I. Barsukov, A. G. Swartz, B. Kim, L. Yang, H. Y. Hwang and I. N. Krivorotov, AIP Adv., 2016, 6, 055212 CrossRef.
- E. G. Derouane, A. J. Simoens and J. C. Vedrine, Chem. Phys. Lett., 1977, 52, 549 CrossRef CAS; E. G. Derouane, A. J. Simoens, C. Colin, G. A. Martin, J. A. Dalmon and J. C. Vedrine, J. Catal., 1978, 52, 50 CrossRef.
| This journal is © The Royal Society of Chemistry 2019 |

