
 Open Access Article
 This Open Access Article is licensed under a
 Creative Commons Attribution 3.0 Unported Licence
Two-dimensional Cd(II) coordination polymer encapsulated by Tb3+ as a reversible luminescent probe for Fe3+†
Yuandi Wua,
Meihua Lina,
Dongyang Liua,
Ming Liua and
Jing Qian *abc
*abc
aCollege of Chemistry, Tianjin Normal University, Tianjin 300387, P. R. China. E-mail: qianjinger@aliyun.com
bTianjin Key Laboratory of Structure and Performance for Functional Molecules, Tianjin Normal University, Tianjin 300387, P. R. China
cKey Laboratory of Inorganic–Organic Hybrid Functional Materials Chemistry, Tianjin Normal University, Ministry of Education, Tianjin 300387, P. R. China
First published on 29th October 2019
Abstract
A two-dimensional luminescent cadmium(II) coordination polymer, [Cd(modbc)2]n (Cd-P); modbc = 2-methyl-6-oxygen-1,6-dihydro-3,4′-bipyridine-5-carbonitrile, was successfully synthesized by a solvothermal reaction and fully characterized. Cd-P exhibited excellent luminescence emission, and detected Cu2+, Co2+, Fe2+, Hg2+, Ni2+ and Fe3+ ions with high sensitivity and showed good anti-interference performance. After encapsulation of Tb3+ ions in Cd-P, the as-obtained fluorescent functionalized Tb3+@Cd-P maintained distinct chemical stabilities in different pHs and metal salt solutions. Subsequently, we explored the potential application of Tb3+@Cd-P as a probe for Fe3+ ions. A new and convenient method for individual identification of Fe3+ ions by the combination of Cd-P and Tb3+@Cd-P was successfully established. A possible sensing mechanism is discussed in detail.
1. Introduction
Chemists have been highly successful at developing detection methods for anions, cations, small organic molecules and biological macromolecules. Fluorescent organogels have become novel and promising materials, especially in sensor applications.1,2 Metal–organic frameworks (MOFs) can be defined as one of the ideal candidates for chemical sensors.3 Luminescent coordination polymers (CPs) as chemosensors, have also attracted more and more attention for the selective and sensitive detection of some explosives,4,5 organic compounds,6,7 inorganic ions,8,9 etc., through “turn on”10 or “turn off”11 sensing. Among them, rapid selection and sensitive detection of Fe3+ ions has aroused widespread interest because Fe3+ ions have important cell functions such as hemoglobin formation and play a vital role in biological systems.12–14 Its deficiency or excess over the normal allowable limit can lead to physical diseases such as diabetes, anemia, arthritis, mental decline, cancer and so on.15,16 In addition, with the rapid development of industry, a large number of harmful inorganic ions is being released into the environment, and causing adverse effects on people's health.17–19 In a word, not only is Fe3+ recognized as an industrial pollutant but also it plays a significant role in living organisms. Therefore, it is an urgent problem to explore the high effective probes to detect Fe3+.20–233D microporous CPs, which can produce significant fluorescence signals and visible emission colors, and have become the most reported chemical sensors.4,7–11,24 At present, compared with the transition-metal-based CPs, Ln-CPs have aroused great interest due to their unique optical characteristics such as large stokes shift, high color purity, and long fluorescence lifetime via the “antenna effect” obtained from the 4f–4f electron transitions.7,8,25,26 Recently, an alternative strategy for constructing Ln-CPs and optimizing photoluminescence was proposed by doping lanthanide ions to CPs via post-synthesis method (PSM).27–29 Any desired fluorescent probes can be acquired by modifying the molar ratio of the starting reactants.30–33 In the construction of CPs for the above applications, poly-carboxylic acid and N-donor ligands have been widely chosen as building blocks. However, the achievement of a fast response, practicability, and reproducible performance for Fe3+ detection using fluorescence is still challenging.34
In fact, it was rarely reported that low-dimensional chemical sensors with one-dimensional or two-dimensional structures were considered for selective detection of inorganic ions.35,36 In this study, asymmetric unflexible 2-methyl-6-oxygen-1,6-dihydro-3,4′-bipyridine-5-carbonitrile (modbc) containing coordination N and O atoms, was utilized as an anionic ligand (Scheme 1). Then, we report a multifunctional highly luminescent [Cd(modbc)2]n (Cd-P), and obtain a Ln-decorated CP Tb3+@Cd-P. Cd-P was fully characterized by IR spectroscopy, elemental analysis, single crystal, XPS, powder X-ray diffraction, thermal and photoluminescence properties. Moreover, selective and sensing properties of Cd-P and Tb3+@Cd-P were investigated in H2O for Fe3+ ions in detail.
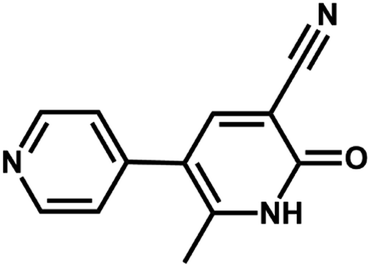 | ||
| Scheme 1 The structure of modbc. | ||
2. Experimental section
2.1. Synthesis of [Cd(modbc)2]n (Cd-P)
Cd-P was obtained by one-pot solvothermal synthesis from CdSO4 (0.05 mmol, 0.008 g), modbc (0.1 mmol, 0.021 g) in 10 mL of water/DMF (4![[thin space (1/6-em)]](https://www.rsc.org/images/entities/char_2009.gif) :1). The reactants were placed in a 25 ml reactor, and heated to 120 °C for 72 h under self-generated pressure, then cooled to atmospheric temperature at a rate of 2.0 °C h−1. Light yellow rodlike-shaped crystals suitable for X-ray analysis were obtained, which were filtered, washed and dried (Tables S1 and S2†). Total yield of Cd-P was ca. 54% based on CdSO4. Anal. Calcd for Cd0.50C12H8N3O: C, 54.1; H, 3.03; N, 15.77%. Found: C, 53.59; H, 3.47; N, 15.34%. FT-IR (KBr, cm−1): 3377.05 (vs.), 2982.1 (s), 2215.19 (m), 1601.95 (s), 1386.11 (s), 1109.61 (vs.), 983.56 (vs.), 856.65 (s), 617.75 (m), 541.33 (vs.) (Fig. S1†).
:1). The reactants were placed in a 25 ml reactor, and heated to 120 °C for 72 h under self-generated pressure, then cooled to atmospheric temperature at a rate of 2.0 °C h−1. Light yellow rodlike-shaped crystals suitable for X-ray analysis were obtained, which were filtered, washed and dried (Tables S1 and S2†). Total yield of Cd-P was ca. 54% based on CdSO4. Anal. Calcd for Cd0.50C12H8N3O: C, 54.1; H, 3.03; N, 15.77%. Found: C, 53.59; H, 3.47; N, 15.34%. FT-IR (KBr, cm−1): 3377.05 (vs.), 2982.1 (s), 2215.19 (m), 1601.95 (s), 1386.11 (s), 1109.61 (vs.), 983.56 (vs.), 856.65 (s), 617.75 (m), 541.33 (vs.) (Fig. S1†).
2.2. Preparation of Tb3+@Cd-P
Tb3+@Cd-P was prepared by adding 100 mg powder of Cd-P to the aqueous solution of Tb(NO3)3 soaking for 24 h, and separated by centrifugation and washed with deionized water to remove the remaining Tb3+. The collected crystal powder was dried for 12 h under vacuum conditions of 60 °C.2.3. Experiment of luminescent detection
Cd-P and Tb3+@Cd-P (0.01 mM) were well-dispersed in 5 mM Tris–HCl/NaCl buffer (pH 7.0) by sonicating for 0.5 h to obtain a solution, which were used for luminescent experiments. The aqueous solutions of nitrate salts or chloride of Na+, Ag+, Cd2+, Cu2+, Zn2+, Pb2+, Ca2+, Mn2+, Co2+, Ni2+, Hg2+, Fe3+ (1.0 × 10⁻³ M) were prepared for luminescent experiments. Generally, ferrous salt is easy to be oxidized in the air, but it is relatively stable and not easy to be oxidized after forming double salt, so we chose double salt (NH4)2Fe(SO4)2 to prepare the aqueous solution of Fe2+. In addition, the same concentrations (1.0 × 10⁻³ M) of aqueous solutions containing potassium salts of MnO4−, CO32−, SO42−, Cl−, and Cr2O72− were also prepared. The Stern–Volmer equation: I0/I = 1 + Ksv[Q] was applied to judge the quenching effect.37 The detection limit was calculated according to 3σ/k recommended by IUPAC, where the standard deviation, σ value was estimated by fifteen repeated fluorescent measurements of Cd-P and Tb3+@Cd-P, and k value was obtained using a calibration curve of I vs. [Q].38 The fluorescence stability of Cd-P and Tb3+@Cd-P in the aqueous solution at different pH values were investigated.3. Results and discussion
3.1. Structural description
By one-pot solvothermal method, CdSO4 combined with modbc produced a 2D framework at about 54% yield. Single-crystal X-ray diffraction shows that Cd-P crystallizes in the![[P with combining macron]](https://www.rsc.org/images/entities/i_char_0050_0304.gif) 43212 space group. The symmetric unit consists of one Cd2+ ion and two modbc anions. A six-coordinated Cd2+ ion exhibits a distorted octahedron geometry, which is completed by two oxygen atoms and four nitrogen atoms from different modbc molecules (Fig. 1a). Each modbc molecule adopts tridentate mode (Fig. 1b). The Cd–N and Cd–O bond lengths fall in the reasonable range of 2.269–2.501 Å, and adjacent Cd2+ ions are bridged by modbc ligands into the cadmium chain. The structural feature of Cd-P is that each cadmium chain serves as a secondary building unit and is further connected by a modbc– ligand into a 2D framework, containing tetranuclear homometallic Cd4(modbc)4 cycles, with different Cd1⋯Cd1 distances of 10.434 and 14.756 Å (Fig. 1c).
43212 space group. The symmetric unit consists of one Cd2+ ion and two modbc anions. A six-coordinated Cd2+ ion exhibits a distorted octahedron geometry, which is completed by two oxygen atoms and four nitrogen atoms from different modbc molecules (Fig. 1a). Each modbc molecule adopts tridentate mode (Fig. 1b). The Cd–N and Cd–O bond lengths fall in the reasonable range of 2.269–2.501 Å, and adjacent Cd2+ ions are bridged by modbc ligands into the cadmium chain. The structural feature of Cd-P is that each cadmium chain serves as a secondary building unit and is further connected by a modbc– ligand into a 2D framework, containing tetranuclear homometallic Cd4(modbc)4 cycles, with different Cd1⋯Cd1 distances of 10.434 and 14.756 Å (Fig. 1c).
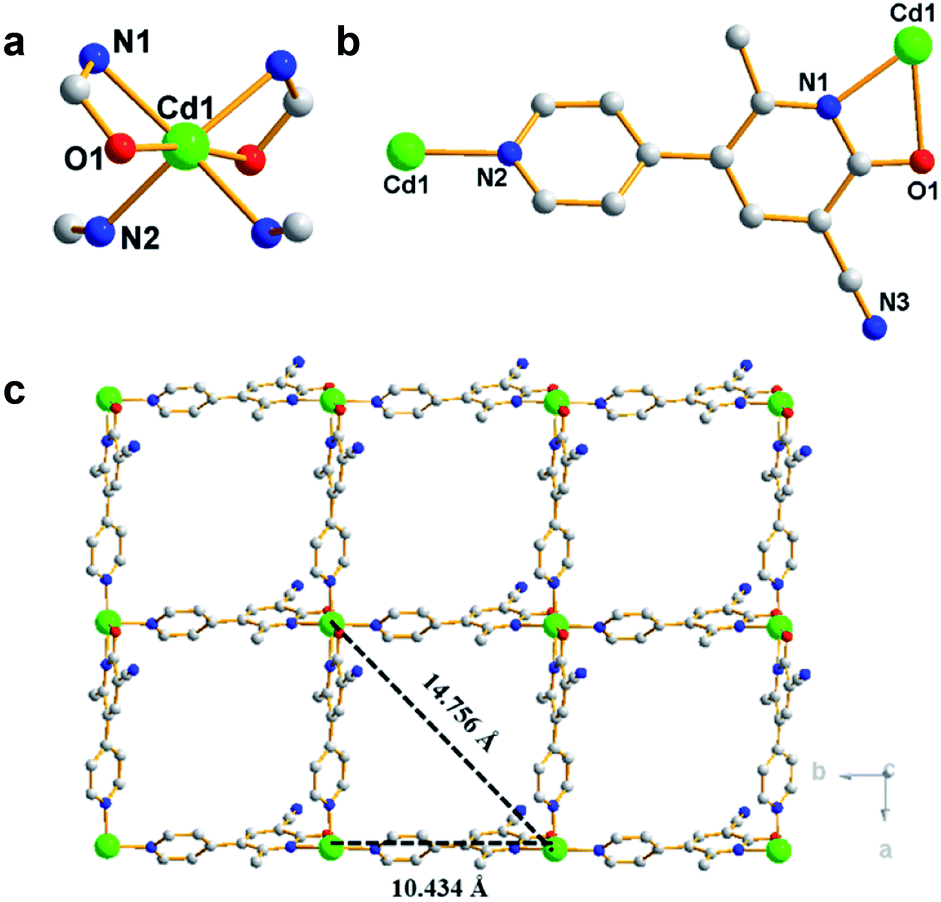 | ||
| Fig. 1 (a) Coordination environment of Cd2+ ion in Cd-P. (b) Coordination mode of modbc molecule. (c) Two-dimensional reticulated structure of Cd-P along the c axis; red, O; gray, C; green, Cd1; blue, N. All H atoms are omitted for clarity. | ||
3.2. Property characterization
As shown in Fig. S2,† thermogravimetric analysis (TGA) of Cd-P was measured to evaluate its thermal stability at ≤450 °C. Further, powder X-ray diffraction (PXRD) of Cd-P confirmed the phase purity and excellent stability in H2O and common organic solvents, as well as in metal salt aqueous system by matching the simulated pattern (Fig. S3†). The samples were heated for 8 h at different temperatures and the corresponding PXRD diagrams were determined. As shown in Fig. S4,† when heated to 180 °C, Cd-P framework still contains excellent chemical stability. High stability of Cd-P may result from the formation of strong bonds between N/O atoms and Cd2+ ions based on Pearson's hard/soft acid/base principle,39,40 or relatively highly dense 2D framework, and the synergy effect of these factors.41 Obviously, Cd-P framework with excellent chemical stability offers the possibility for its practical application as a metal ion sensor.Afterward, Cd-P was soaked in the aqueous solution of Tb(NO3)3 to obtain Tb3+@Cd-P. The crystalline integrity of Cd-P remained unchanged after the incorporation of Tb3+ ion, which was confirmed by PXRD. In order to explore the stability of the Tb3+@Cd-P, the sample was treated with FeCl3 solution. After multiple immersion in FeCl3 solution for 12 h, the PXRD patterns of Tb3+@Cd-P showed the excellent stability of the crystalline integrity (Fig. S5†). To obtain the number of Tb3+ ions doping into Cd-P, EDS analysis on Tb3+@Cd-P was performed (Fig. S6†). The result showed that the ratio of Cd2+ and Tb3+ ions was approximately 5:1. Further, X-ray photoelectron spectroscopy (XPS) analyses on Tb3+@Cd-P and Cd-P were performed. As shown in Fig. S7,† after treatment by Tb3+, three new peaks at 1277.6, 1243.4 and 151 eV appeared corresponding to Tb 3d3/2 Tb 3d5/2, Tb 4d, by which the existence of Tb3+ ions in the composites can be ascertained.42
3.3. Fluorescence properties
Considering that CPs composed of d10 metal ions and aromatic organic ligands may be the promising luminescent materials,43 the fluorescence properties of Cd-P were investigated in 5 mM Tris–HCl/NaCl buffer (pH 7.0) at room temperature. Under 318 and 328 nm excitation, the luminescence of Cd-P and Tb3+@Cd-P in aqueous solution show the intense emission centered at 400 and 390 nm, respectively, while the luminescence of modbc exhibits a similar emission centered at 475 nm at 412 nm excitation (Fig. S8†). Moreover, the fluorescence emission spectra of Cd-P and Tb3+@Cd-P show good fluorescence stability within 12 h. In addition, the fluorescence intensity of Cd-P and Tb3+@Cd-P dispersed in aqueous solution is basically unchanged in the range of pH 0.5–14.0 (Fig. S9†). Obviously, Cd-P framework with excellent chemical stability offers the possibility for its practical application based on the fact that industrial effluent and polluted rivers are usually acidic or alkaline.443.4. Detection of ions
To detect water pollution, we explored the potential detection of Cd-P to various cations and anions. The same concentrations (1.0 × 10⁻³ M) of aqueous solutions of Na+, Ag+, Cd2+, Cu2+, Zn2+, Pb2+, Ca2+, Mn2+, Co2+, Ni2+, Fe2+, Hg2+, Fe3+, MnO4−, CO32−, SO42−, Cl−, and Cr2O72− were prepared, and we investigated their effects on the fluorescence intensity of Cd-P. As shown in Fig. 2, Cd-P shows selective sensing ability toward different cations and anions. Obviously, Cu2+, Co2+, Ni2+, Fe2+, Hg2+ and Fe3+ ions present the higher quenching efficiency.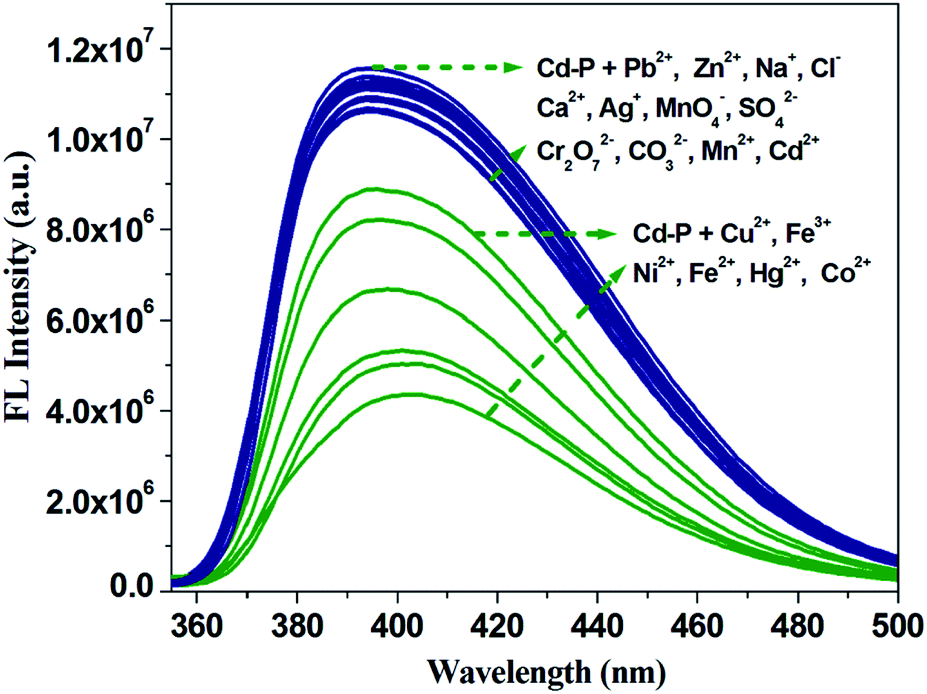 | ||
| Fig. 2 Luminous intensity of Cd-P upon different ions at 400 nm in 5 mM Tris–HCl/NaCl buffer (pH 7.0). [Cd-P] = 1.0 × 10⁻⁵ M and [ions] = 2.5 μM. λex: 318 nm, λF: 400 nm, slit width: 4 nm. | ||
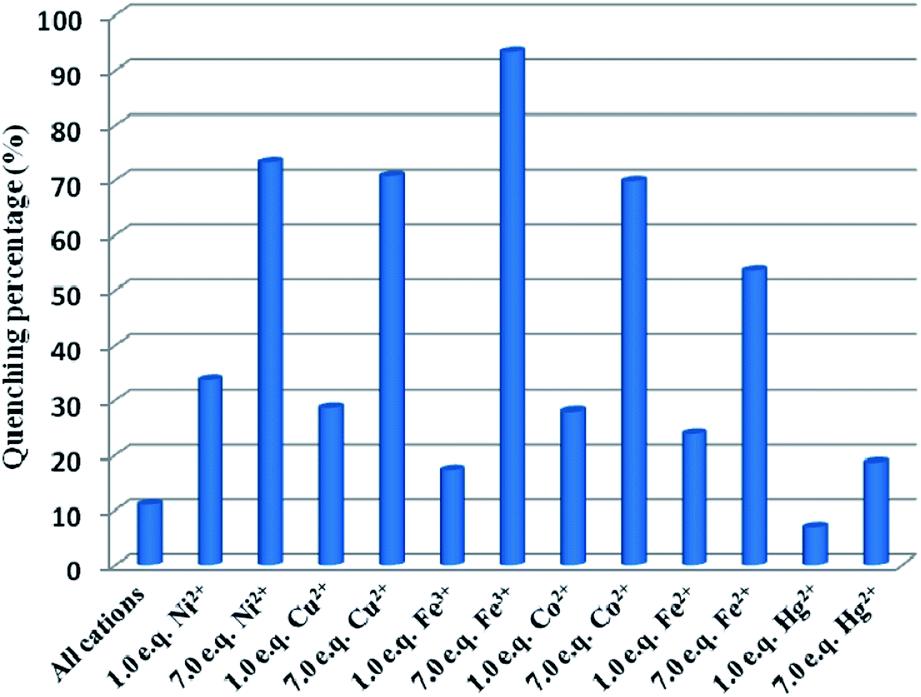
To investigate the fluorescence sensitivity ability of Cd-P for detecting Cu2+, Co2+, Fe2+, Hg2+, Ni2+ and Fe3+ ions, the corresponding luminescence spectra were recorded by ion concentration titration. As shown in Fig. S10,† the remarkable fluorescence declines of Cd-P are observed in ionic concentration range. Furthermore, based on the application requirements of wastewater or pollutant detection, the anti-interference ability of Cd-P sensing for Cu2+, Co2+, Fe2+, Hg2+, Ni2+ and Fe3+ ions to other metal ions was explored at the same fluorescence measurement conditions. It is quite pleasing that the quenching effects by Cu2+, Co2+, Fe2+, Hg2+, Ni2+ and Fe3+ ions on the luminescence intensity of Cd-P are almost not influenced by the interfering metal ions, as shown in Fig. 3 and S11.†
 | ||
| Fig. 3 Comparison of the luminescence intensity of Cd-P in 5 mM Tris–HCl/NaCl buffer (pH 7.0): blank, after addition of mixed ions (Na+, Ag+, Cd2+, Zn2+, Pb2+, Ca2+, Mn2+; total concentration of mixed metal ions is 35 μM), and followed by addition of Cu2+, Co2+, Ni2+, Fe2+, Hg2+ and Fe3+ ions, respectively ([analyte] = 5 or 35 μM). λex: 318 nm, λF: 400 nm, slit width: 4 nm. | ||
Quantitatively, at low concentrations, the good linearity plots of Co2+, Ni2+ Fe3+, Fe2+, Hg2+ and Cu2+ ions were obtained, as shown in Fig. 4. Also, the corresponding quenching constants, Ksv, were calculated, 1.76 ± 0.18 × 10⁶ M−1 for Co2+ ions, 0.95 ± 0.89 × 10⁶ M−1 for Cu2+ ions, 1.46 ± 0.058 × 10⁶ M−1 for Ni2+ ions, 1.06 ± 0.11 × 10⁵ M−1 for Fe3+ ions, 2.07 ± 0.27 × 10⁶ M−1 for Fe2+ ions, and 1.89 ± 0.36 × 10⁶ M−1 for Hg2+ ions, respectively. In addition, the LODs based on Cd-P were also obtained and 0.19 ± 0.06 μM for Co2+ ions, 0.26 ± 0.04 μM for Cu2+ ions, 0.23 ± 0.03 μM for Ni2+ ions, 0.047 ± 0.002 μM for Fe3+ ions, 0.58 ± 0.013 nM for Fe2+ ions, and 5.79 ± 2.0 mM for Hg2+ ions, respectively. However, at higher concentrations, the Stern–Volmer figures deviate from the line maybe due to energy transfer processes or self-absorption.37 In this work, the calculated LOD values of Cd-P for Cu2+, Ni2+ and Fe3+ ions are far lower than maximum allowable levels (MAL) in drinking water as required by the Environmental Protection Agency (EPA, 15.7, 0.34, and 5.36 μM, respectively).45
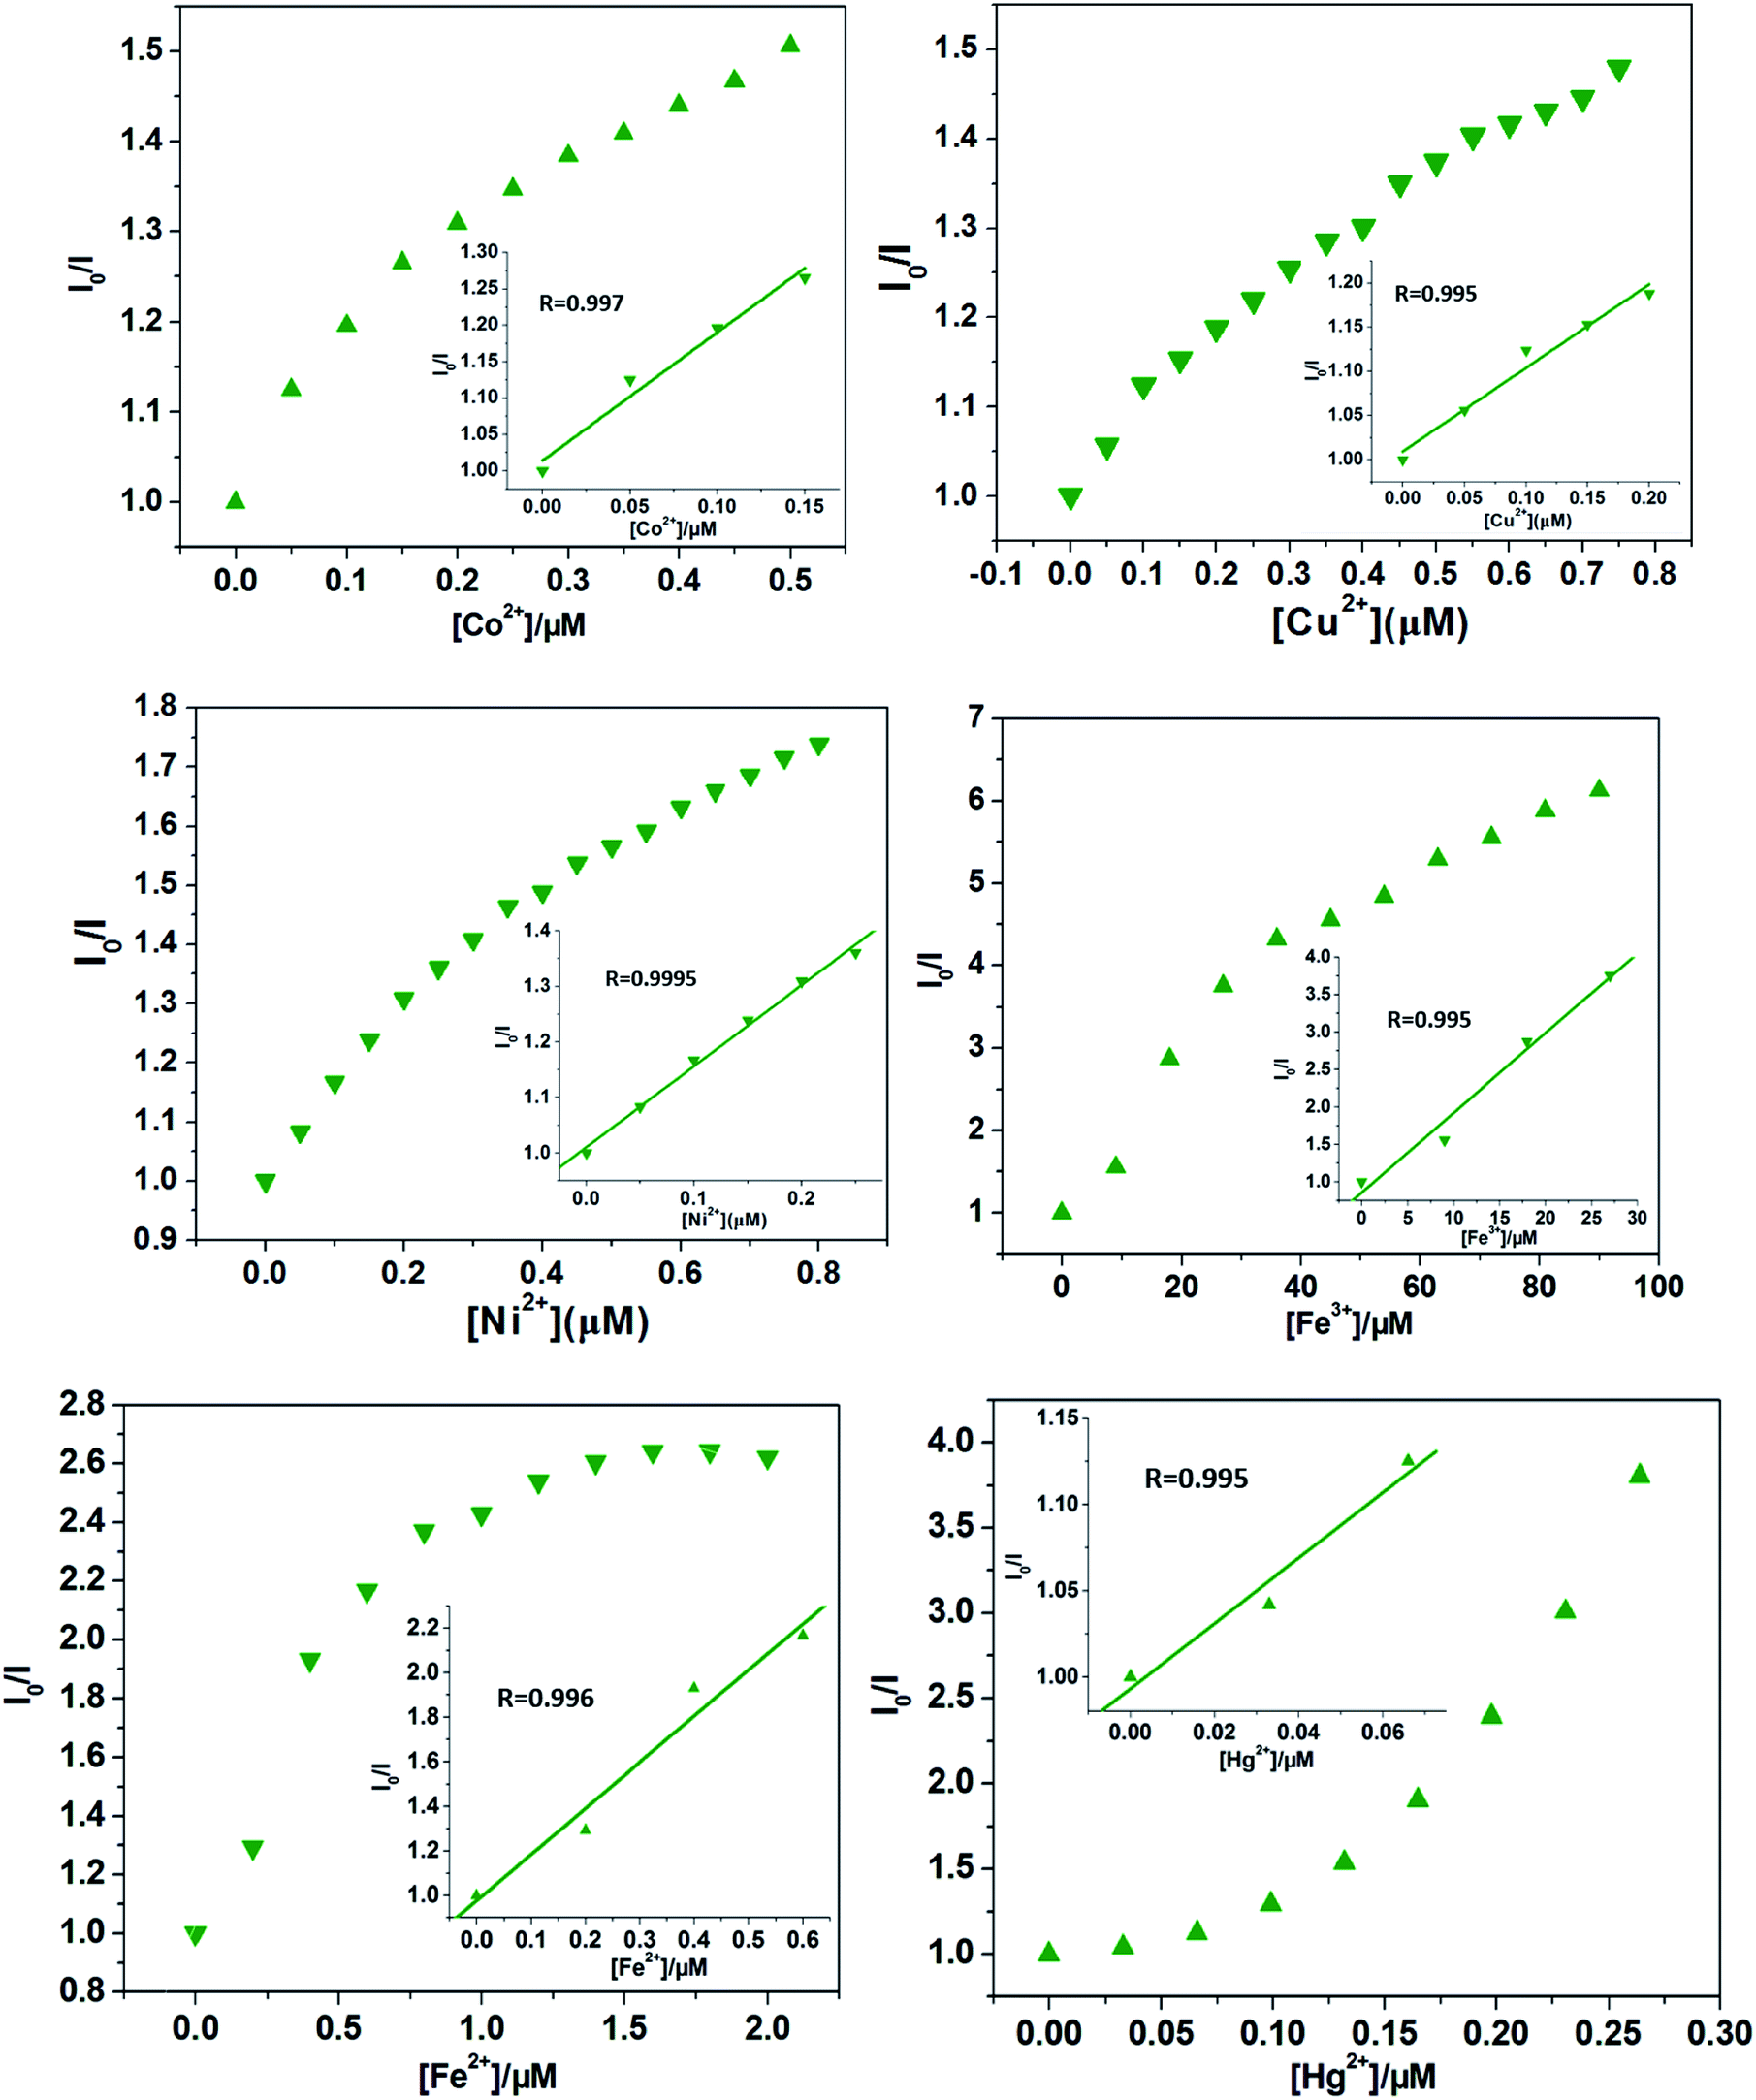 | ||
| Fig. 4 The Stern–Volmer plot of I0/I versus Co2+, Ni2+, Fe3+, Fe2+, Hg2+, and Cu2+ ions concentration, respectively (insets: the related Stern–Volmer plots at low Co2+, Ni2+, and Cu2+ ions concentration). λex: 318 nm, λF: 400 nm, slit width: 4 nm. | ||
3.5. Differentiation of Co2+, Ni2+, Fe3+, Fe2+, Hg2+ and Cu2+ ions
It is worth noting that Cd-P cannot selectively distinguish Cu2+, Co2+, Ni2+, Fe2+, Hg2+ and Fe3+ ions. To improve the selectivity of Cd-P, Tb3+@Cd-P was obtained via PSM. As expected, with the concentration titration of Fe3+ ions, the luminescence intensity of Tb3+@Cd-P is quenched prominently (Fig. S12†). Further, we investigated the selectivity of Tb3+@Cd-P toward a wide range of ions. The other measured ions show a negligible influence to the emission intensity of Tb3+@Cd-P except Fe3+ and Fe2+ ions, as shown in Fig. 5. To examine the sensing behavior of Tb3+@Cd-P to Fe2+, titration experiment of Tb3+@Cd-P with Fe2+ was performed (Fig. S13†). On gradual addition of Fe2+, the fluorescence of Tb3+@Cd-P solutions significantly enhanced. We also observed that (NH4)2Fe(SO4)2 exhibited the fluorescence emission at about 390 nm, as deposited in Fig. S14.† Therefore, we speculate that the luminescence of (NH4)2Fe(SO4)2 is responsible for the fluorescence enhancement by Fe2+. These results indicate that Tb3+@Cd-P can detect Fe3+ selectively among coexisting ions.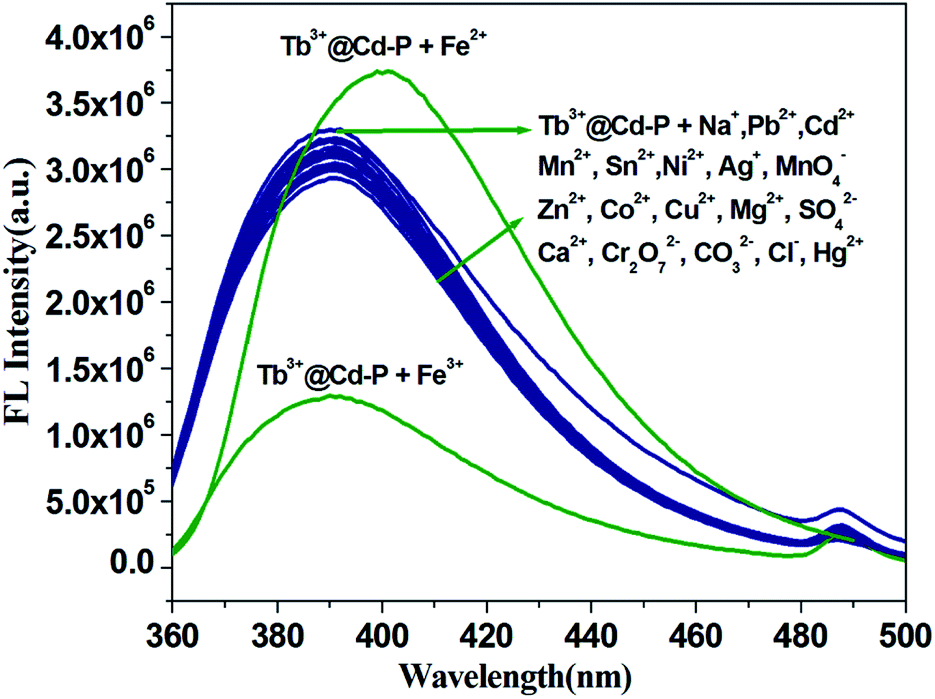 | ||
| Fig. 5 Luminous intensity of Tb3+@Cd-P upon different ions at 390 nm in 5 mM Tris–HCl/NaCl buffer (pH 7.0). [Tb3+@Cd-P] = 1.0 × 10⁻⁵ M and [ions] = 2.5 μM. λex: 328 nm, λF: 390 nm, slit width: 4 nm. | ||
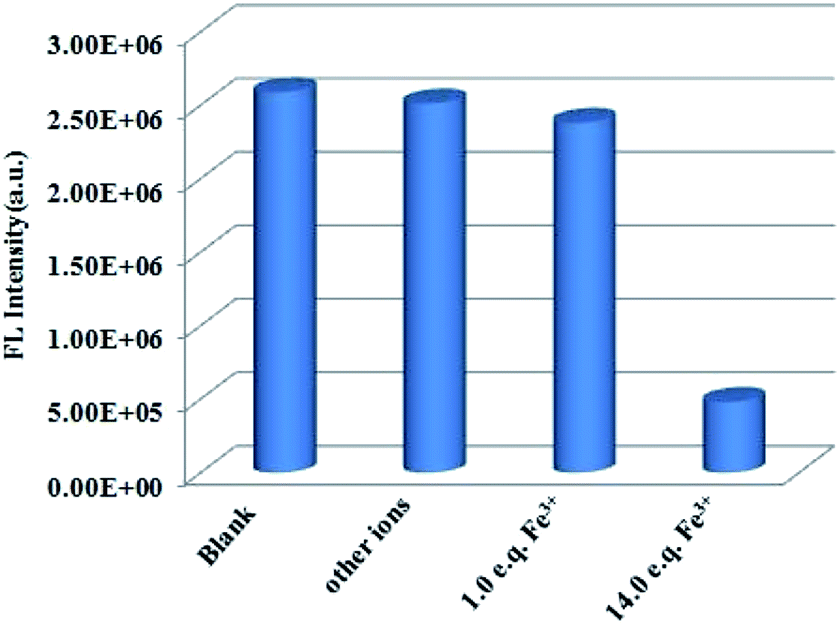
To further evaluate the anti-interference ability of Tb3+@Cd-P as a selective sensor for Fe3+, competitive experiments were conducted in the presence of other metal ions (Fig. 6 and S15†).46 No significant differences in luminescence intensity can be observed among these solutions. All these results clearly indicate Tb3+@Cd-P has a high selectivity and anti-interference ability in the detection of Fe3+ under aqueous conditions.47
 | ||
| Fig. 6 Comparison of the luminescence intensity of Tb3+@Cd-P in 5 mM Tris–HCl/NaCl buffer (pH 7.0): after addition of mixed ions (Na+, Ag+, Cd2+, Zn2+, Pb2+, Ca2+, Cu2+, Co2+, Ni2+, Sn2+, Mg2+, Hg2+, Fe2+, Mn2+; total concentration of mixed metal ions is 70 μM), and followed by addition of Fe3+ ions ([Fe3+] = 5 or 70 μM). λex: 328 nm, λF: 390 nm, slit width: 4 nm. | ||
One unexpected finding is that both Cd-P and Tb3+@Cd-P are easily sensitized by Fe3+ ions, and the rapid response time of the sensitization process obtained by the experiment is approximately 10 s (Fig. S16†). Compared with Cd-P, the influence of Fe3+ ions on the luminescence intensity of Tb3+@Cd-P is significantly smaller (Fig. 7a and b). To better analyze and compare with Cd-P, the Stern–Volmer plot of Tb3+@Cd-P for detecting Fe3+ was obtained (Fig. S17†), a linear presented at lower and higher experimental concentration range (0–20 μM; 36–90 μM), and the KSV and LOD values were 1.31 ± 0.01 × 10⁴ M−1, 1.09 ± 0.02 × 10⁵ M−1, respectively, displaying the high quenching efficiency of the Fe3+ ions.48–50 In addition, the LODs based on Tb3+@Cd-P were also obtained and 0.66 ± 0.02 μM for Fe3+ ions.
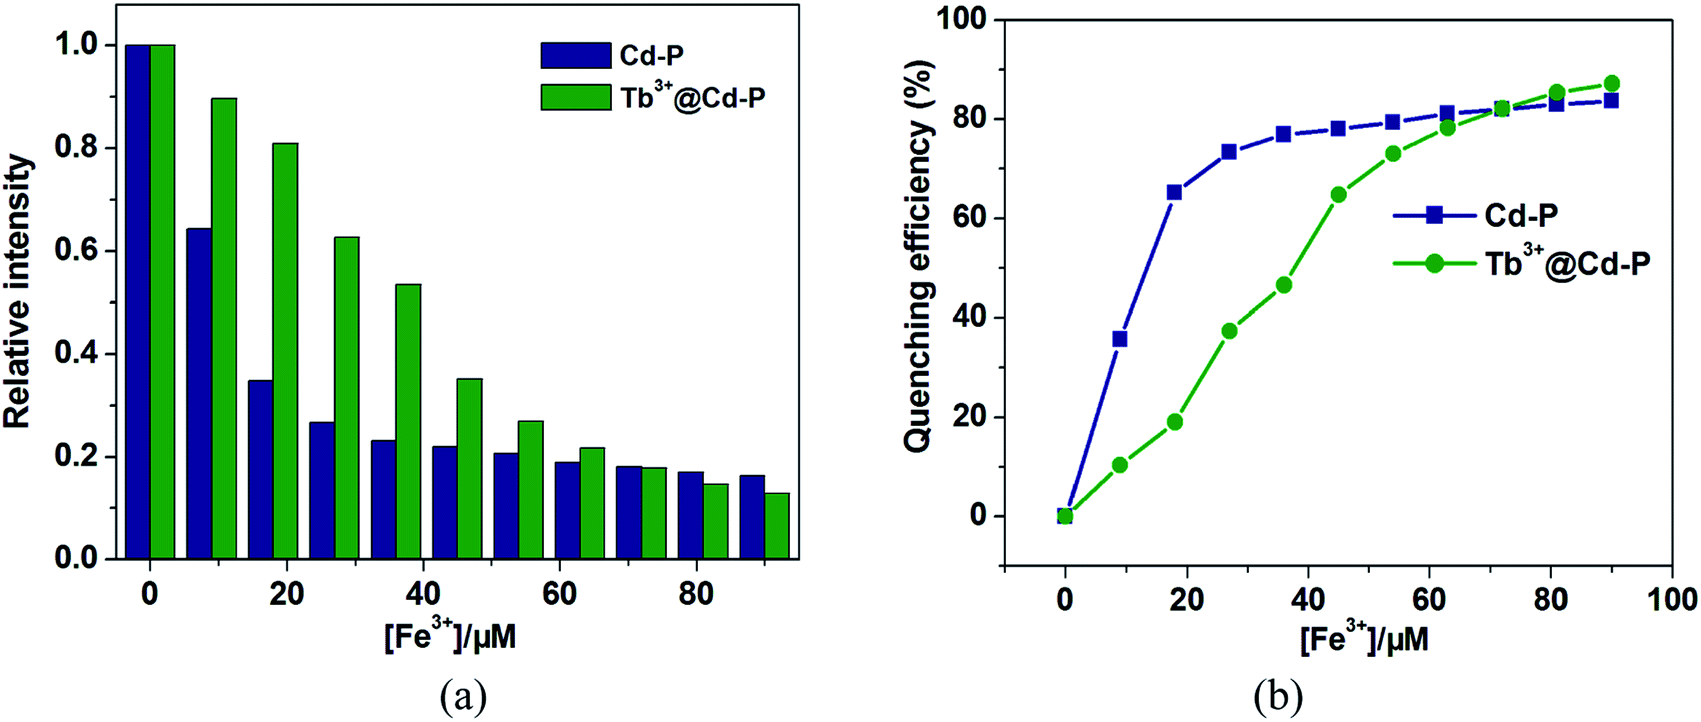 | ||
| Fig. 7 (a) Relative fluorescence intensity and (b) the corresponding quenching efficiency of Cd-P and Tb3+@Cd-P vs. different Fe3+ ion concentrations. λex: 328 nm, λF: 390 nm for Tb3+@Cd-P, slit width: 4 nm; λex: 318 nm, λF: 400 nm for Cd-P, slit width: 4 nm. | ||
For Fe3+ ions at lower concentration, the values of Ksv[Tb3+@Cd-P]/Ksv[Cd-P] and LOD[Tb3+@Cd-P]/LOD[Cd-P] were 0.12 and 14.04, respectively, which further verify the above conclusion. In short, although Cu2+, Co2+, Fe2+, Hg2+, Ni2+ and Fe3+ ions can reduce the luminescence intensity of Cd-P, the luminescence quenching of Tb3+@Cd-P is only affected by Fe3+ ions. In addition, the luminescence quenching degree of Tb3+@Cd-P and Cd-P for Fe3+ ions is also different. We can selectively differentiate Fe3+ ions by combining the changes of the luminescence intensities of Tb3+@Cd-P and Cd-P. It exhibits a better performance, and the LODs were estimated to be 10−7 M, which also lies well below several MOF fluorescent sensors for detecting Fe3+ ion for a specific comparison (Table S3†).
Considering the cost of emitting probes, their regenerative properties play an important role in practical applications. Hence, to obtain Tb3+@Cd-P + Fe3+ samples, we dispersed Tb3+@Cd-P in the aqueous solution of Fe(NO3)3 (10−3 M) for 12 h, and separated by centrifugation then washed with deionized water to remove the remaining Fe3+ ions. The emission intensity of recovered Tb3+@Cd-P is well comparable to that of the parent sample (Fig. 8 and S18†). Fortunately, after five regeneration cycles, the yield of Tb3+@Cd-P to differentiate Fe3+ ions reaches about 78%. Above results confirm that Tb3+@Cd-P can achieve a differential detection toward Cu2+, Co2+, Ni2+ and Fe3+ ions, and exhibits high detection sensitivities. Moreover, as an Fe3+ ion-responsive probe, the Tb3+@Cd-P can exert the anti-interference, regenerative recognition and fast procedure under aqueous solution.
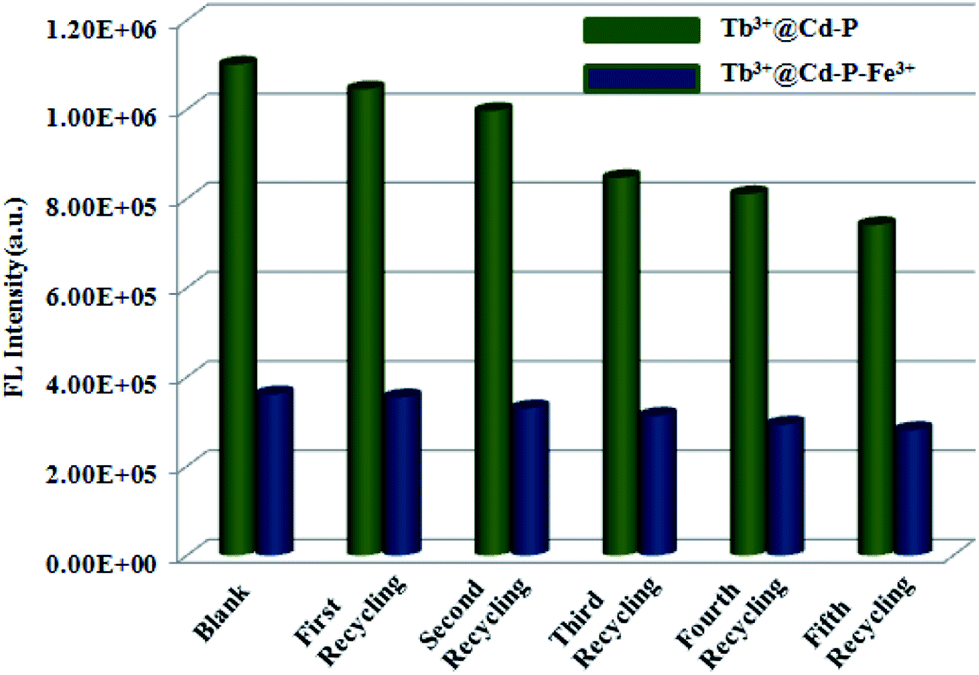 | ||
| Fig. 8 Five regeneration cycles for detection of Fe3+ ions by Tb3+@Cd-P. λex: 328 nm, λF: 390 nm, slit width: 4 nm. | ||
3.6. Discussion of the mechanism
The high stabilities of Cd-P (Fig. S3 and S4†) and Tb3+@Cd-P (Fig. S5†) in aqueous solution of metal salts, organic solvents, different temperatures, and the solutions with pH range from 0.5 to 14.0 (Fig. S9†) suggest that the luminescence quenching is not caused by framework collapse. In order to observe whether these metal ions can enter the frame structure of Cd-P, ICP-AES analysis on Cd-P has been performed, as shown in Table S4.† Further, the XPS spectra of Cd-P before and after added Cu2+, Co2+, Ni2+, Fe3+ metal salt samples present that both carboxyl oxygen atoms of Cd-P and hydroxyl oxygen atoms of H2O participate in the coordination of Fe3+ etc metal ions (Fig. S19†).28After Cd-P treatment by Tb3+ ions, EDS analysis on Tb3+@Cd-P shows that the ratio of Cd2+ and Tb3+ ions is approximately 5:1 (Fig. S6†). Fig. S20† shows that the UV-vis absorption band of Tb3+@Cd-P presents a significant red shift compared to Cd-P, indicating that Tb3+ ions interacts with Cd-P.51 Further, XPS analyses on Cd-P, Tb3+@Cd-P and Tb3+@Cd-P + Fe3+ also show that the luminescent CPs are high stability, and the luminescence quenching is not caused by framework collapse (Fig. S21† and 9a). Three new peaks at 1277.6, 1243.4 and 151 eV appear corresponding to Tb 3d3/2 Tb 3d5/2, Tb 4d, by which the existence of Tb3+ ions in the composites of Tb3+@Cd-P can be ascertained (Fig. 9b and c).42 The O 1s spectrum of Tb3+@Cd-P shown in Fig. 9d can be fitted into two peaks at 530.8 eV and 532.4 eV, which correspond to carboxyl group oxygen atoms and –OH species, respectively. In addition, the binding energy of N 1s does unchange (Fig. 9e), implying that the N atom of modbc may not be involved in the coordination interaction with Tb3+ ions. The result shows that carboxyl oxygen atoms of Cd-P and hydroxyl oxygen atoms of H2O participate in the coordination of Tb3+ ions.28 Therefore, the emission peak of Tb3+@Cd-P shows a significant blue shift from 400 to 390 nm after post-treatment by Tb3+ ions, which can be attributed to the O atom of modbc coordinated with Tb3+ ions, but does not result in the “antenna effect” obtained from the 4f–4f electron transitions.25 Tb3+@Cd-P after treatment by Fe3+ ions, the corresponding Fe 2p peak is found supporting the presence of Fe in Tb3+@Cd-P (Fig. 9f). The O 1s peak further shifts to 530.9 eV (Fig. 9d). The fast and simple regeneration method also shows that the binding between Tb3+@Cd-P and Fe3+ ions should be weaker (Fig. 8 and S18†), which may be that Fe3+ ions spread to the frameworks of CPs leading to luminescence quenching.7
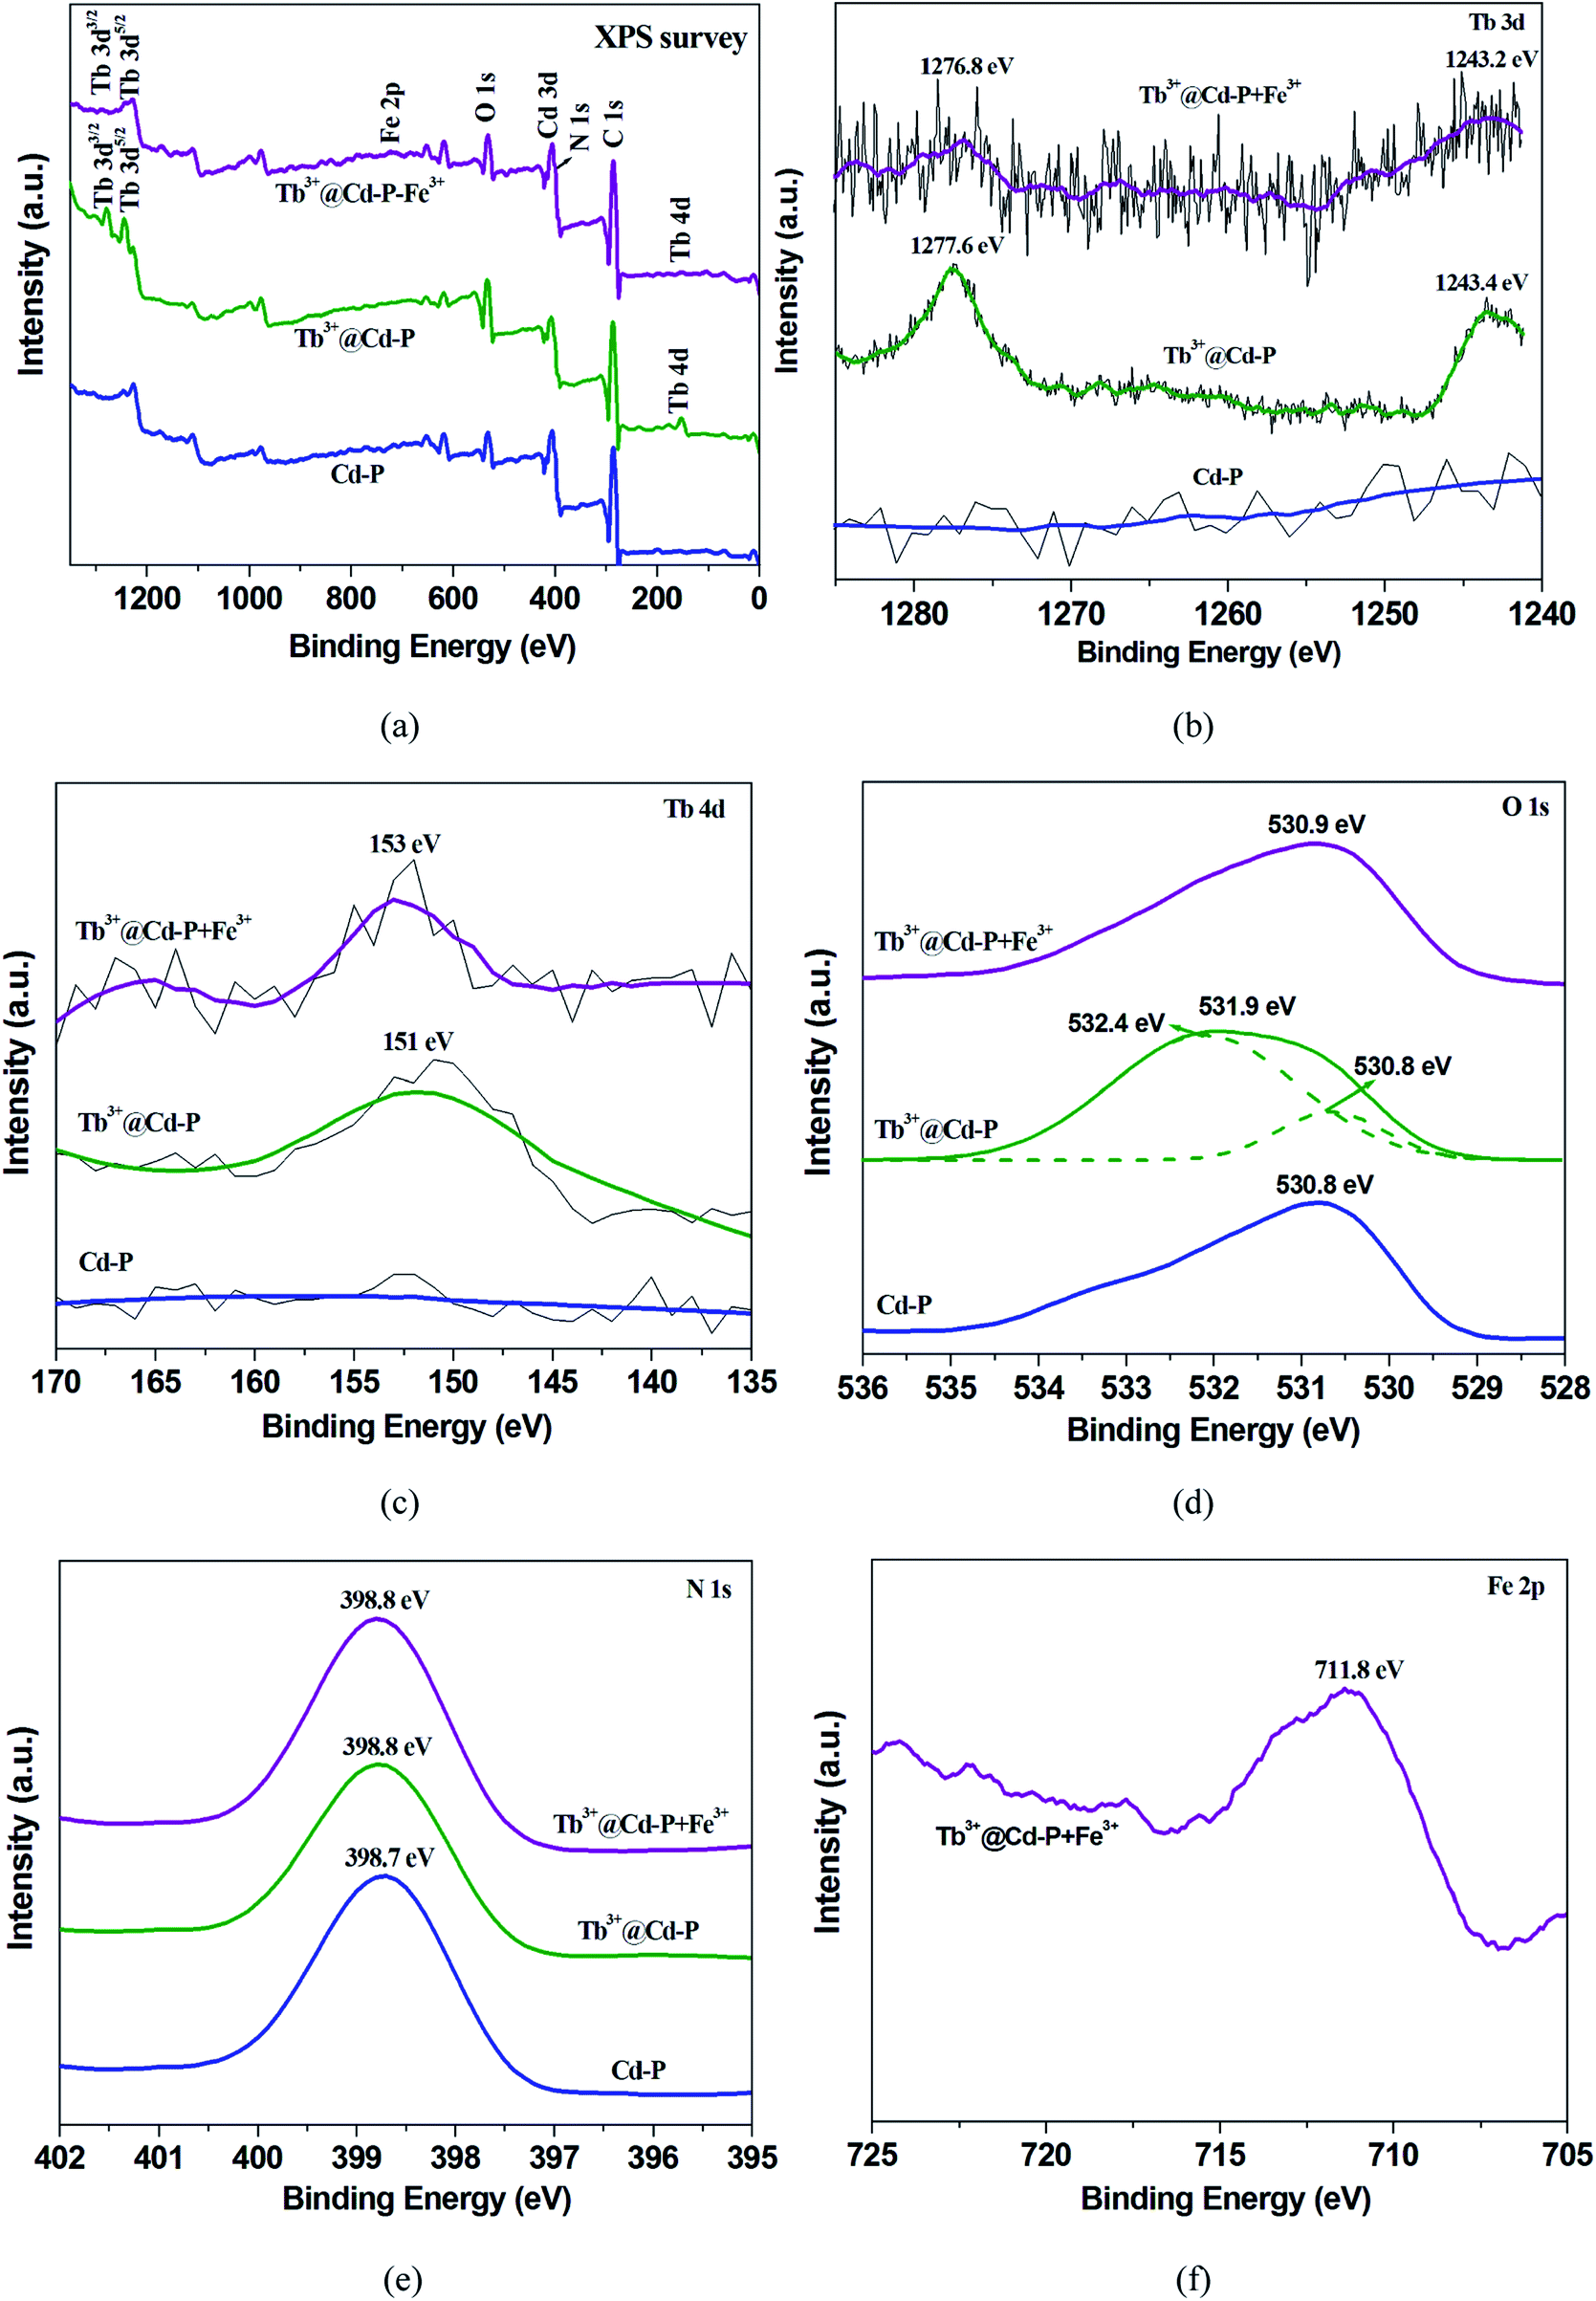 | ||
| Fig. 9 The XPS spectra of Cd-P, Tb3+@Cd-P, and Tb3+@Cd-P + Fe3+ samples: (a) the survey spectrum, the high resolution XPS spectra of (b) Tb 3d, (c) Tb 4d, (d) O 1s, (e) N 1s, and (f) Fe 2p, respectively. | ||
In addition, Fig. S8 and S20† show that there exists extensive overlap between UV-vis absorbance of Fe3+ and the excitation absorbance of Tb3+@Cd-P, while negligible for other metal ions.52 As well as the absorbance of Fe3+ corresponding to the excitation absorbance of Tb3+@Cd-P, ultimately lead to the luminescence quenching of Tb3+@Cd-P.53,54 As shown in Fig. S22 and Table S5,† the lifetimes are shortened from 4.15 to 1.99 ns, 4.15 to 1.94 ns, and 4.15 to 1.98 ns after Cd-P treated with Cu2+, Co2+, and Ni2+ ions, and the downward Stern−Volmer curve at higher Cu2+, Co2+ or Ni2+ ion concentrations demonstrate that both static and dynamic mechanisms operate at higher concentration. However, the lifetimes of Cd-P and Tb3+@Cd-P remain in the presence and absence of Fe3+ ions (Fig. S22, S23 and Table S4†), and the Stern–Volmer plots are linear at the full experimental concentration region, which suggest that there are the static quenching mechanisms in selectively differentiate Fe3+ ions by combining Tb3+@Cd-P and Cd-P.55
4. Conclusion
In summary, a Cd(II)-based polymer framework (Cd-P) was constructed and exhibited high sensitivity (Ksv ∼106 M−1 and LODs ∼10−7 M) toward Cu2+, Co2+, Hg2+, Fe2+, Ni2+ and Fe3+ ions via luminescence quenching. In addition, a fluorescent hybrid material, Tb3+@Cd-P, derived from Cd-P via PSM, which maintains high chemical stability, good selectivity, and excellent response toward Fe3+ ions, is most likely associated with the competition between the excitation of Tb3+@Cd-P and the absorption of Fe3+ ions, wherein there is also the weak interaction of Tb3+@Cd-P with Fe3+ ions. Also, we can differentiate selectivity Fe3+ ions by the combination of Cd-P and Tb3+@Cd-P. It should be mentioned that the two-dimensional luminescent probes for detecting a trace amount of Fe3+ ions (μM) and quick response time (∼10 s) are still few reports. Most importantly, Tb3+@Cd-P can act as a reversible luminescent probe for Fe3+ ions with potential application.Conflicts of interest
The authors declare no competing financial interest.Acknowledgements
This work was supported by the National Natural Science Foundation of China (No. 21571141) and Tianjin Natural Science Foundation, China (No. 15JCYBJC20300).References
- X. H. Cao, N. Zhao, A. P. Gao, Q. Q. Ding, Y. R. Li and X. P. Chang, Langmuir, 2018, 34, 7404–7415 CrossRef CAS.
- A. Panja and K. Ghosh, Mater. Chem. Front., 2018, 2, 1866–1875 RSC.
- T. L. Mako, J. M. Racicot and M. Levine, Chem. Rev., 2019, 119, 322–477 CrossRef CAS.
- B. Wang, X. L. Lv, D. Feng, L. H. Xie, J. Zhang, M. Li, Y. B. Xie, J. R. Li and H. C. Zhou, J. Am. Chem. Soc., 2016, 138, 6204–6216 CrossRef CAS.
- D. Tian, Y. Li, R. Y. Chen, Z. Chang, G. Y. Wang and X. H. Bu, J. Mater. Chem. A, 2014, 2, 1465–1470 RSC.
- L. E. Kreno, K. Leong, O. K. Farha, M. Allendorf, R. P. Van Duyne and J. T. Hupp, Chem. Rev., 2012, 112, 1105–1125 CrossRef CAS.
- W. Yan, C. L. Zhang, S. G. Chen, L. J. Han and H. Zheng, ACS Appl. Mater. Interfaces, 2017, 9, 1629–1634 CrossRef CAS.
- G. F. Ji, J. J. Liu, X. C. Gao, W. Sun, J. Z. Wang, S. L. Zhao and Z. L. Liu, J. Mater. Chem. A, 2017, 5, 10200–10205 RSC.
- X. Y. Xu and B. Yan, Sens. Actuators, B, 2016, 222, 347–353 CrossRef CAS.
- M. Zhang, G. Feng, Z. G. Song, Y. P. Zhou, H. Y. Chao, D. Q. Yuan, T. T. Y. Tan, Z. G. Guo, Z. G. Hu, B. Z. Tang, B. Liu and D. Zhao, J. Am. Chem. Soc., 2014, 136, 7241–7244 CrossRef CAS.
- S. Bhattacharyya, A. Chakraborty, K. Jayaramulu, A. Hazra and T. K. A. Maji, Chem. Commun., 2014, 50, 13567–13570 RSC.
- P. Y. Du, W. Gu and X. Liu, Inorg. Chem., 2016, 55, 7826–7828 CrossRef CAS.
- S. Y. Moon, N. R. Cha, Y. H. Kim and S. K. Chang, J. Org. Chem., 2004, 69, 181–183 CrossRef CAS.
- H. Matsumiya, N. Iki and S. T. Miyano, Anal. Bioanal. Chem., 2004, 62, 337–342 CAS.
- X. Liu and E. C. Theil, Acc. Chem. Res., 2005, 38, 167–175 CrossRef CAS.
- L. Hyman and K. Franz, Coord. Chem. Rev., 2012, 256, 2333–2356 CrossRef CAS.
- J. L. Bricks, A. Kovalchuk, C. Trieflinger, M. Nofz, M. Büschel, A. I. Tolmachev, J. Daub and K. Rurack, J. Am. Chem. Soc., 2005, 127, 13522–13529 CrossRef CAS.
- S. R. Zhang, D. Y. Du, J. S. Qin, S. J. Bao, S. L. Li, W. W. He and Z. M. Su, Chem.–Eur. J., 2014, 20, 3589–3594 CrossRef CAS.
- T. F. Liu, D. W. Feng, Y. P. Chen, L. F. Zou, M. Bosch, S. Yuan, Z. W. Wei, S. Fordham, K. C. Wang and H. C. Zhou, J. Am. Chem. Soc., 2015, 137, 413–419 CrossRef CAS.
- F. Yi, D. Chen, M. Wu, L. Han and H. Jiang, ChemPlusChem, 2016, 81, 675–690 CrossRef CAS.
- Z. Hu, B. J. Deibert and J. Li, Chem. Soc. Rev., 2014, 43, 5815–5840 RSC.
- W. P. Lustig, S. Mukherjee, N. D. Rudd, A. V. Desai, J. Li and S. K. Ghosh, Chem. Soc. Rev., 2017, 46, 3242–3285 RSC.
- X. Xu and B. Yan, ACS Appl. Mater. Interfaces, 2015, 7, 721–729 CrossRef CAS.
- P. C. Rao and S. Mandal, Inorg. Chem., 2018, 57, 11855–11858 CrossRef.
- G. Ji, J. Wang, X. Gao, J. Liu, W. Guan, H. Liu and Z. Liu, Eur. J. Inorg. Chem., 2018, 19, 1998–2003 CrossRef.
- Z. J. Lin, J. Lu, M. Hong and R. Cao, Chem. Soc. Rev., 2014, 43, 5867–5895 RSC.
- G. F. Ji, X. C. Gao, T. X. Zheng, W. H. Guan, H. T. Liu and Z. L. Liu, Inorg. Chem., 2018, 57, 10525–10532 CrossRef CAS.
- J. N. Hao and B. Yan, Nanoscale, 2016, 8, 12047–12053 RSC.
- J. An, C. M. Shade, D. A. C. Czegan, S. Petoud and N. L. Rosi, J. Am. Chem. Soc., 2011, 133, 1220–1223 CrossRef CAS.
- K. M. Buschbaum, F. Beuerle and C. Feldmann, Microporous Mesoporous Mater., 2015, 216, 171–199 CrossRef.
- L. V. Meyer, F. Schonfeld and K. Muller-Buschbaum, Chem. Commun., 2014, 50, 8093–8108 RSC.
- Z. Zhang, Y. He, L. Liu, X. Lu, X. Zhu, W. Wong, M. Pan and C. Su, Chem. Commun., 2016, 52, 3713–3716 RSC.
- T. Xia, Y. Cui, Y. Yang and G. Qian, ChemNanoMat, 2016, 3, 51–57 CrossRef.
- R. Lv, H. Li, J. Su, X. Fu, B. Y. Yang, W. Gu and X. Liu, Inorg. Chem., 2017, 56, 12348–12356 CrossRef CAS.
- D. Basudeb, J. Rajkumar, K. B. Anup, P. R. Partha, S. Chittaranjan and H. M. Mohammad, Inorg. Chem., 2019, 58, 2686–2694 CrossRef.
- A. Mürsel, Cryst. Growth Des., 2017, 17, 5499–5505 CrossRef.
- Y. L. Hou, H. Xu, R. R. Cheng and B. Zhao, Chem. Commun., 2015, 51, 6769–6772 RSC.
- L. Li, S. Shen, R. Lin, Y. Bai and H. Liu, Chem. Commun., 2017, 53, 9986–9989 RSC.
- F. Y. Yi, S. C. Wang, M. Gu, J. Q. Zheng and L. Han, J. Mater. Chem. C, 2018, 6, 2010–2018 RSC.
- Z. Q. Yao, G. Y. Li, J. Xu, T. L. Hu and X. H. Bu, Chem.–Eur. J., 2018, 24, 3192–3198 CrossRef CAS PubMed.
- C. Yu, Z. Shao and H. Hou, Chem. Sci., 2017, 8, 7611–7619 RSC.
- J. N. Hao and B. Yan, Adv. Funct. Mater., 2017, 27, 1603856 CrossRef.
- C. Liu and B. Yan, Photochem. Photobiol. Sci., 2015, 14, 1644–1650 RSC.
- L. F. Liang, L. Y. Liu, F. L. Jiang, C. P. Liu, D. Q. Yuan, Q. H. Chen, D. Wu, H. L. Jiang and M. C. Hong, Inorg. Chem., 2018, 57, 4891–4897 CrossRef CAS.
- WHO, WHO Guidelines for Drinking-Water Quality, 4th edn, WHO Press, Geneva, 2011 Search PubMed.
- Z. Y. Zhang, S. Z. Lu, C. M. Sha and D. M. Xu, Sens. Actuators, B, 2015, 208, 258–266 CrossRef CAS.
- C. C. Hu, Q. Gao, Z. X. Zhu, L. L. Chang, W. J. Zhou, K. S. Xia, B. Han and C. G. Zhou, Sens. Actuators, B, 2018, 259, 411–419 CrossRef CAS.
- G. X. Wen, Y. P. Wu, W. W. Dong, J. Zhao, D. S. Li and J. Zhang, Inorg. Chem., 2016, 55, 10114–10117 CrossRef CAS.
- K. Fan, S. S. Bao, W. X. Nie, C. H. Liao and L. M. Zheng, Inorg. Chem., 2018, 57, 1079–1089 CrossRef CAS PubMed.
- Z. F. Wu, L. K. Gong and X. Y. Huang, Inorg. Chem., 2017, 56, 7397–7403 CrossRef CAS.
- G. Ji, Z. Yang, H. Zhang, Y. Zhao, B. Yu, Z. Ma and Z. Liu, Angew. Chem., Int. Ed., 2016, 55, 9685–9689 CrossRef CAS.
- A. Shylaja, S. S. Roja, R. V. Priya and R. R. Kumar, J. Org. Chem., 2018, 83, 14084–14090 CrossRef CAS.
- G. X. Wen, Y. P. Wu, W. W. Dong, J. Zhao, D. S. Li and J. Zhang, Inorg. Chem., 2016, 55, 10114–10117 CrossRef CAS.
- L. N. Neupane, E. T. Oh, H. J. Park and K. H. Lee, Anal. Chem., 2016, 88, 3333–3340 CrossRef CAS.
- B. Gole, A. K. Bar and P. S. Mukherjee, Chem.–Eur. J., 2014, 20, 2276–2291 CrossRef CAS.
Footnote |
| † Electronic supplementary information (ESI) available: Experimental details, crystallographic data, tables, TGA, PXRD, XPS, EDS, and luminescent spectra. CCDC 1881136. For ESI and crystallographic data in CIF or other electronic format see DOI: 10.1039/c9ra06639j |
| This journal is © The Royal Society of Chemistry 2019 |