 Open Access Article
Facile assembly of novel g-C3N4@expanded graphite and surface loading of nano zero-valent iron for enhanced synergistic degradation of tetracycline†
Xiangyu Wang *a,
Yu Xiea,
Jun Mab and
Ping Ning
 *a
*a
aFaculty of Environmental Science and Engineering, Kunming University of Science and Technology, Kunming, 650500, China. E-mail: ningping58_2015@sina.com; imusthlee2014@sina.com
bState Key Laboratory of Urban Water Resources and Environment, Harbin Institute of Technology, Harbin, 150090, China
First published on 28th October 2019
Abstract
The two-stage removal process of tetracycline (TC) in aqueous solutions using a novel photocatalyst based on nano-zero-valent iron (NZVI), g-C3N4 and expanded graphite by carbon layer (EGC) is reported for the first time. The composite (NZVI/g-C3N4@EGC) exhibits remarkable adsorption, reduction ability and visible light activity over the reaction course. Compared with pristine g-C3N4 (25.9%) and pure NZVI (45.9%), NZVI/g-C3N4@EGC achieves high degradation efficiency of TC (98.5%) due to the formation of a heterogeneous photo-Fenton system. This study shows that synergistic effects are achieved in the reaction system, including maintaining the reduction ability of NZVI and enhancing the photocatalytic activity of g-C3N4 by facilitating the separation of photogenerated electrons (e−) and holes (h+). TC removal involved a two-stage process of adsorption–reduction and photo-degradation. The quencher experiments determined that holes (h+) and superoxide radicals (˙O2−) are the major reactive species in the degradation of TC. The degradation pathways of TC were proposed based on the analysis of the intermediates. In addition, NZVI/g-C3N4@EGC revealed a high stability in a five-cycle test and good magnetic properties for facile separation from aqueous solutions. From an application viewpoint, NZVI/g-C3N4@EGC has favorable prospects in the direction of the photocatalytic degradation of antibiotic wastewater.
Introduction
Antibiotics are widely used in modern clinical medicine as important drugs for the prevention and treatment of infectious diseases because of their inhibitory or killing effects on pathogenic microorganisms. However, the abuse of antibiotics results in numerous adverse reactions, endangering human health. Discharge into the environment causes the death of the surrounding bacteria and disrupts the ecological balance. Tetracycline (TC) is a common antibiotic that is used mainly for the treatment of respiratory, intestinal, and urinary tract infections. However, excessive use of TC alters the composition of the human gastrointestinal flora, causing a range of gastrointestinal and non-gastrointestinal diseases.1 Chee-Sanford et al. confirmed that after tetracycline antibiotics enter the body, they are not readily absorbed by the stomach, and about 75% of the dose is discharged into sewage as a parent compound.2 Therefore, the TC in the wastewater must be removed before it can be discharged into water. Generally, methods for degrading TC include adsorption, biodegradation, advanced oxidation processes, electrochemical degradation and photochemical degradation.3At present, the technology of nanoscale zero-valent iron in situ wastewater treatment has received widespread attention because of the strong reduction ability and environmental friendliness of iron ions. At the same time, heterogeneous Fenton technology involving iron-based materials as catalysts has been proven to have potential application prospects.4–8 However, the defects of NZVI particles are severe aggregation in aqueous solutions and the formation of a passivation layer on their surfaces, which lead to decreased activity. Therefore, TC cannot be completely mineralized by pure NZVI particles. In order to avoid the generation of refractory intermediates, photocatalysis has been combined to achieve complete degradation of TC. Photocatalytic degradation of pollutants is a highly acclaimed method9 that converts light energy from nature into the energy required for chemical reactions to produce a catalytic effect; the surrounding oxygen and water molecules are excited to highly reactive species, and almost all environmental harmful organic matter and some inorganic matter can be decomposed. g-C3N4 is widely used as a photocatalyst due to its low band gap value (2.7 eV), which leads to highly efficient absorption of visible light.10,11 However, g-C3N4 has the defects of high recombination rate of photogenerated electron–hole pairs and low quantum efficiency, which greatly decrease its utilization of visible light.12–14 Also, the inconvenient recycling and secondary pollution of powder photocatalysts in water treatment applications is an ongoing problem that needs to be solved.
Theoretically, in order to overcome the abovementioned defects, it is feasible to combine g-C3N4 with graphene. However, prior to the employment of graphene oxide, complex pretreatment processes are required to transform it into reduced graphene oxide. More importantly, if the pretreatment process is not optimized, the graphene oxide may not be completely transformed into reduced graphene oxide.15,16 Therefore, in this study, an easily available and low-cost carbon material, expanded graphite, was adopted. Expanded graphite (EG) has excellent electrical conductivity, a high specific surface area, high porosity and outstanding adsorption capacity.17,18 Due to these features, it is an ideal support material. However, the mechanical strength of EG is weak, and it readily collapses when subjected to external forces. According to Wang et al., coating a carbon layer on the EG surface is a good way to increase its mechanical strength. Meanwhile, doping with carbon enhances the photocatalytic activity of g-C3N4.19,20 Therefore, in order to maintain the stability of the EG structure, expanded graphite by carbon layer (EGC) was developed. In addition, the support of EGC effectively enhances the dispersion of NZVI particles, and the 1.2 V electrode potential difference between EGC and NZVI provides a high electrodynamic driving force to remove TC.21
The main objective of this study is to fabricate a novel magnetic NZVI/g-C3N4@EGC composite based on NZVI, g-C3N4 and EGC for the treatment of antibiotic wastewater; also, the degradation mechanism of TC by NZVI/g-C3N4@EGC under dark and visible light conditions was analyzed. The other objectives are: (1) to characterize the newly prepared catalysts using various techniques to study their surface morphologies, elemental compositions, specific surface areas, crystal structures and optical properties; (2) to study the effects of different reaction conditions on the degradation efficiency of tetracycline by NZVI/g-C3N4@EGC; (3) to test the recyclability and stability of NZVI/g-C3N4@EGC; and (4) to analyze the intermediates in the degradation process of tetracycline. The results show that NZVI/g-C3N4@EGC exhibits excellent adsorption, reduction and photo-degradation abilities. The formation of synergistic effects during the two-stage removal process led to high tetracycline degradation efficiency.
Materials and methods
Materials
Expandable graphite (99%, grain size 50 mesh) was purchased from Qingdao Herita Graphite Products Co., Ltd., (China). Tetracycline (C22H24N2O8), ferrous sulfate heptahydrate (FeSO4·7H2O), potassium borohydride (KBH4), glucose (C6H12O6), melamine (C3N3(NH2)3) and other chemicals were purchased from Aladdin Reagent Database Inc. (China). All the chemicals were of analytical grade and were used as received without further purification.Synthesis of NZVI/g-C3N4@EGC
The expanded graphite was obtained by the calcination of expandable graphite in a muffle furnace at 900 °C for 15 s. The g-C3N4 was prepared by calcining melamine in a tube furnace at 550 °C for 2 h at a heating rate of 5 °C min−1. 50 mg of g-C3N4 powder was placed in 100 mL of water–methanol solution and sonicated for 30 min to attain complete dispersion. 100 mg of expanded graphite and 2 g of glucose were introduced into the above suspension; then, the mixture was magnetically stirred for 24 h. At the end of this time, the formed mixture was dried at 80 °C overnight. Finally, the dried sample was calcined in a muffle furnace at a heating rate of 5 °C min−1 and maintained at 550 °C for 2 h, which formed a carbon layer to enhance the mechanical strength of the EG. After cooling to room temperature, it was used for further synthesis.Ternary composites were prepared by adding g-C3N4@EGC to a FeSO4·7H2O solution (dissolving various amounts of FeSO4·7H2O aqueous solution in a 1![[thin space (1/6-em)]](https://www.rsc.org/images/entities/char_2009.gif) :
:![[thin space (1/6-em)]](https://www.rsc.org/images/entities/char_2009.gif) 3 volume ratio (ethanol
3 volume ratio (ethanol![[thin space (1/6-em)]](https://www.rsc.org/images/entities/char_2009.gif) :
:![[thin space (1/6-em)]](https://www.rsc.org/images/entities/char_2009.gif) water) in ethanol solution) followed by slowly titrating the KBH4 solution with continuous stirring (excess BH4− ensures that the adsorbed Fe2+ on the g-C3N4@EGC surface is completely reduced). The KBH4 reduction method proceeds according to the following reaction:
water) in ethanol solution) followed by slowly titrating the KBH4 solution with continuous stirring (excess BH4− ensures that the adsorbed Fe2+ on the g-C3N4@EGC surface is completely reduced). The KBH4 reduction method proceeds according to the following reaction:
| Fe2+ + 2BH4− + 6H2O → Fe0 + 2B(OH)3 + 7H2↑ | (1) |
After the titration was complete, the mixture was stirred for 30 min at room temperature. Subsequently, the prepared ternary composite material was separated from the liquid solution by filtration. Finally, NZVI/g-C3N4@EGC was rinsed three times with deionized water, absolute ethanol and acetone, alternately. The prepared sample was dried and stored under vacuum conditions. All the above experimental steps were performed under a nitrogen atmosphere. To attain the optimal catalytic performance, the relevant products prepared with different mass ratios (FeSO4·7H2O![[thin space (1/6-em)]](https://www.rsc.org/images/entities/char_2009.gif) :
:![[thin space (1/6-em)]](https://www.rsc.org/images/entities/char_2009.gif) g-C3N4@EGC = 0.33, 0.50, 1.0, and 2.0, respectively) were abbreviated as Fe/CN@E-1, Fe/CN@E-2, Fe/CN@E-3 and Fe/CN@E-4, respectively. Among these, the mass ratios of doped NZVI and g-C3N4@EGC were calculated by eqn (1) to be 0.07, 0.1, 0.2 and 0.4, respectively. The NZVI-deposited g-C3N4 composite was prepared by the above method and abbreviated as Fe–CN.
g-C3N4@EGC = 0.33, 0.50, 1.0, and 2.0, respectively) were abbreviated as Fe/CN@E-1, Fe/CN@E-2, Fe/CN@E-3 and Fe/CN@E-4, respectively. Among these, the mass ratios of doped NZVI and g-C3N4@EGC were calculated by eqn (1) to be 0.07, 0.1, 0.2 and 0.4, respectively. The NZVI-deposited g-C3N4 composite was prepared by the above method and abbreviated as Fe–CN.
Characterization
The surface morphology of NZVI/g-C3N4@EGC was observed by field emission scanning electron microscopy (FESEM, Tescan MIRA3 Zeiss Merlin Compact) at an acceleration voltage of 20 kV and transmission electron microscopy (TEM, Tecnai G2 F20 JEOL-2100F). The elemental compositions of the ternary composites were examined by energy dispersive spectrometer (EDS, Oxford X-MAX) attached to the FESEM. The specific surface area and pore size distribution of NZVI/g-C3N4@EGC were measured by BET N2 adsorption analysis using a surface area analyzer (ASAP 2020 HD88Belsorp-max Microtrac). To study the crystal structures of the composites, the XRD patterns were recorded using an X-ray diffractometer (XRD, D8 Advance Davinci design) with Ni-filtered Cu/Kα radiation (λ = 0.15418 nm) operating at generator voltage; the generator currents were 40 kV and 40 mA, respectively. The diffraction patterns were recorded in the range from 10° to 80°. The surface chemical structure and composition of NZVI/g-C3N4@EGC were determined by Fourier transform infrared spectroscopy (FT-IR, Nicolet 6700 Bruker V70). X-ray photoelectron spectroscopy (XPS, Thermo Scientific Escalab 250Xi) measurements were recorded to investigate the surface chemical states. The lifetimes of the photogenerated carriers were investigated by photoluminescence (PL) spectroscopy using an Edinburgh FS980 fluorescence spectrophotometer with an excitation wavelength of 325 nm. Also, the UV-vis diffuse reflectance spectra of the samples were obtained on a UV-vis spectrophotometer (PerkinElmer Lambda 950). To study the magnetization of NZVI/g-C3N4@EGC, a Quantum Design PPMS Dynacool measurement system was used to measure the magnetic moment per mass in a magnetic field between ±2TG.Photocatalytic degradation of TC
The photocatalytic performance of NZVI/g-C3N4@EGC was evaluated by the degradation experiments of tetracycline under a 300 W Xe lamp equipped with a 400 nm cutoff filter. The initial concentration of TC was set to 30 mg L−1. In this photocatalytic degradation experiment, under magnetic stirring, 30 mg of NZVI/g-C3N4@EGC was dispersed in 60 mL of the target aqueous solution for 30 min to establish the adsorption–desorption equilibrium in the dark. After that, the visible light source was turned on to initiate the photocatalytic reaction. At regular intervals, a 3 mL aliquot was collected and centrifuged. The concentration of TC in the solution was analyzed by a UV spectrophotometer (UV-2100, Rayleigh Analytical Instrument Co. Ltd. Beijing, China) by monitoring the absorption maximum band at 360 nm. The degradation efficiency of TC was calculated using the equation:| DE (%) = [(C0 − Ct)/C0] × 100% | (2) |
Results and discussion
Characterization of photocatalysts
As shown in Fig. 1a, the SEM image of EG demonstrates an irregular surface morphology and a large number of wrinkles on its surface, which is consistent with previously reported research.19 As shown in Fig. 1b and c, the SEM images of NZVI/g-C3N4@EGC show that g-C3N4 nanosheets and NZVI particles are supported on the surface of expanded graphite. The TEM images of Fe/CN@E-3 are shown in Fig. 1d and e, with black spherical particles uniformly loaded onto the g-C3N4 nanosheets and expanded graphite surface; this proves that expanded graphite can hinder the agglomeration of NZVI. Fig. 1f shows the EDS image of NZVI/g-C3N4@EGC, which displays the signals of elements C, N, Fe, and O in the composite, where the signal of O is observed due to the presence of adsorbed water on the surface of the sample or oxidation of a small amount of the NZVI surface; this further proves the successful synthesis of NZVI/g-C3N4@EGC.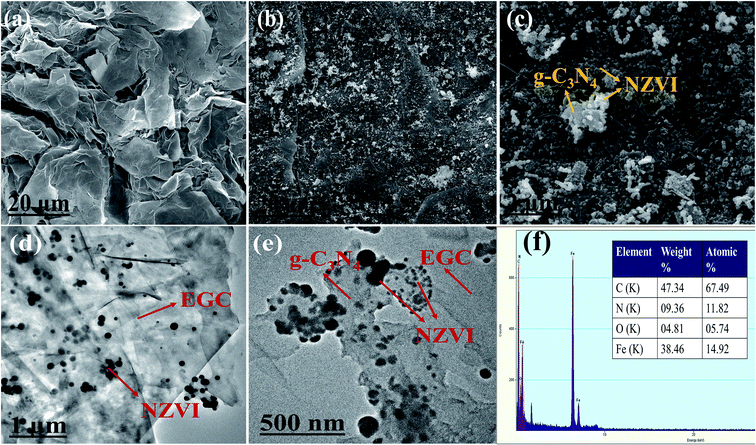 | ||
| Fig. 1 SEM images of (a) EG, (b and c) NZVI/g-C3N4@EGC; TEM images of (d and e) NZVI/g-C3N4@EGC; (f) EDS spectrum of NZVI/g-C3N4@EGC. | ||
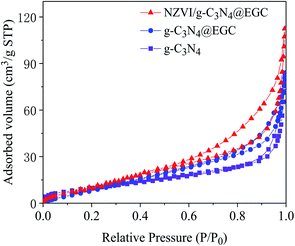
Fig. 2 shows the nitrogen adsorption–desorption isotherms of pristine g-C3N4, g-C3N4@EGC and NZVI/g-C3N4@EGC. All the samples show characteristic type IV isotherms with H3 hysteresis loops in accordance with the IUPAC classification, demonstrating that a typical mesoporous structure exists in the composites.22 The pore size distribution of the composite was obtained using the BJH method. The specific surface areas and pore parameters of the samples are shown in Table 1. Because NZVI and g-C3N4 were successfully loaded onto the surface of EGC, the specific surface area and total pore volume of NZVI/g-C3N4@EGC are higher than those of NZVI and g-C3N4. In addition, the high specific surface area is beneficial to provide more active sites, which is beneficial for the photocatalytic activity.23
| Samples | Surface area (m2 g−1) | Pore volume (cm3 g−1) |
|---|---|---|
| g-C3N4 | 38.37 | 0.13 |
| g-C3N4@EGC | 42.92 | 0.12 |
| NZVI/g-C3N4@EGC | 48.41 | 0.17 |
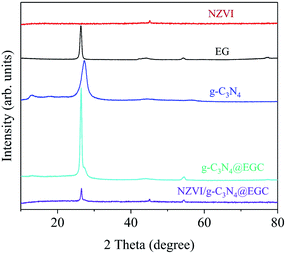
As shown in Fig. 3, the XRD patterns of g-C3N4 and NZVI/g-C3N4@EGC clearly show crystalline phase and crystal structure characteristics. The diffraction peaks at the 2θ values of 12.7° and 27.5° are characteristic of pristine g-C3N4 and are attributed to the (100) and (002) planes of the graphitic material, respectively. The (100) crystal plane is attributed to the periodic array associated with tri-s-triazine, and the (002) crystal plane is attributed to interlayer stacking of the graphite-like material structures.24 The NZVI/g-C3N4@EGC sample shows peaks at 26.2°, 44.2°, and 54.6°, which can be attributed to EGC, and the characteristic peak at 44.9° is a feature of Fe0. After the modification of NZVI, the characteristic peak of the EGC is still sharp, which confirms that the NZVI loading does not destroy the crystal structure of the EGC.25 Furthermore, the XRD patterns show that NZVI loading did not lead to the crystal destruction of g-C3N4, which is consistent with previous findings. This indicates the successful synthesis of the composite.
In order to analyze the chemical states and composition of NZVI/g-C3N4@EGC, the X-ray photoelectron spectroscopy (XPS) image is shown in Fig. 4a; comparison with the survey spectrum of EG demonstrates the coexistence of Fe, C, N, and O elements in freshly prepared NZVI/g-C3N4@EGC, which demonstrates the successful synthesis of the composite. As shown in Fig. 4b, the main peaks of C1s appear at 284.4 eV and 288.1 eV, corresponding to C–C and N–C![[double bond, length as m-dash]](https://www.rsc.org/images/entities/char_e001.gif) N, respectively.26,27 In Fig. 4c, the peaks of N1s appear at 398.3 eV and 399.3 eV; these can be ascribed to the sp2 hybridized aromatic N atoms bonded to carbon atoms (C
N, respectively.26,27 In Fig. 4c, the peaks of N1s appear at 398.3 eV and 399.3 eV; these can be ascribed to the sp2 hybridized aromatic N atoms bonded to carbon atoms (C![[double bond, length as m-dash]](https://www.rsc.org/images/entities/char_e001.gif) N–C), the tertiary nitrogen (N–C3) or H–N–C2.28 In Fig. 4d, the peaks of Fe2p appearing at 706.5 eV (Fe2p3/2) and 724.4 eV (Fe2p1/2) indicate the presence of NZVI, and the peak at 711.2 eV (Fe2p3/2) indicates the presence of ferric oxides; this is due to the oxidation of a small amount of NZVI during storage. The above results are in good agreement with the XRD analysis of NZVI/g-C3N4@EGC.
N–C), the tertiary nitrogen (N–C3) or H–N–C2.28 In Fig. 4d, the peaks of Fe2p appearing at 706.5 eV (Fe2p3/2) and 724.4 eV (Fe2p1/2) indicate the presence of NZVI, and the peak at 711.2 eV (Fe2p3/2) indicates the presence of ferric oxides; this is due to the oxidation of a small amount of NZVI during storage. The above results are in good agreement with the XRD analysis of NZVI/g-C3N4@EGC.
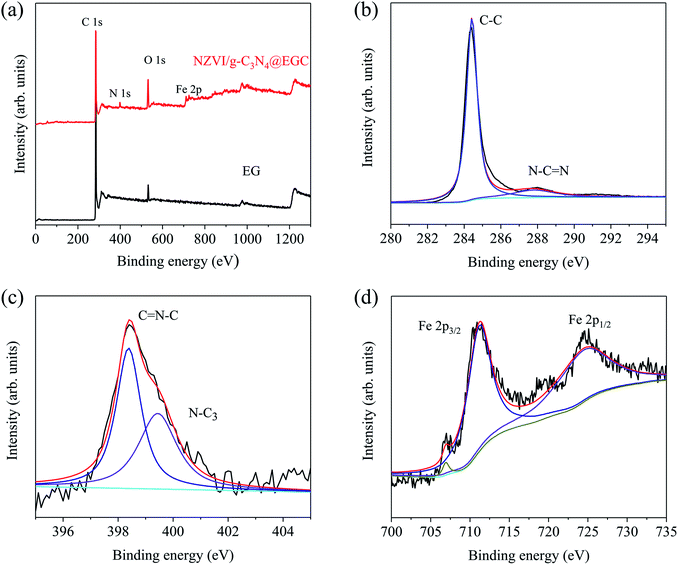 | ||
| Fig. 4 (a) XPS survey spectra of EG and NZVI/g-C3N4@EGC; (b) C 1s, (c) N 1s, and (d) Fe 2p XPS spectra of NZVI/g-C3N4@EGC. | ||
Optical properties of the photocatalysts
The optical properties and photocatalytic activities of pristine g-C3N4, g-C3N4@EGC and NZVI/g-C3N4@EGC were investigated by UV-vis diffuse reflectance spectroscopy. The results are shown in Fig. 5a, where the pristine g-C3N4 has an adsorption edge at around 450 nm; compared with pristine g-C3N4, g-C3N4@EGC presents a red shift of the absorption edge in the visible wavelength range, and it is found that the absorption intensity of g-C3N4@EGC in the visible light region (λ > 420 nm) is significantly improved. This may be due to the support of the EGC; the multiscale pore distribution of the EGC may facilitate the transfer of photo-induced electrons. However, after the support of EGC, g-C3N4@EGC showed a decrease in the absorption intensity in the range of wavelengths shorter than 420 nm, which is consistent with previously reported results.29 Simultaneously, the absorption edge of NZVI/g-C3N4@EGC displays a dramatic red shift, and the absorption intensity of NZVI/g-C3N4@EGC in the range of 250 to 800 nm was also found to be significantly enhanced compared with that of the pristine g-C3N4 and g-C3N4@EGC; this is probably because the existence of the iron energy level leads to a decrease in the energy gap of the electronic transition.30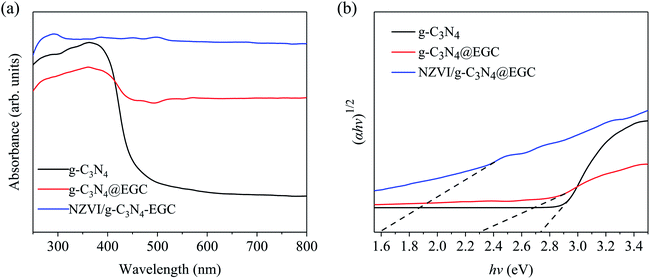 | ||
| Fig. 5 (a) UV-vis-DRS of g-C3N4, g-C3N4@EGC and NZVI/g-C3N4@EGC; (b) Tauc plots of g-C3N4, g-C3N4@EGC and NZVI/g-C3N4@EGC. | ||
The energy band gaps of pristine g-C3N4, g-C3N4@EGC and NZVI/g-C3N4@EGC were calculated according to the Tauc equation:31
| (αhν)1/2 = k(hν − Eg) | (3) |
By plotting (αhν)1/2 and the corresponding photon energy (hν), the energy band gap was evaluated by extrapolating the value to the X axis. As shown in Fig. 5b, the estimated band gap energies of pristine g-C3N4, g-C3N4@EGC and NZVI/g-C3N4@EGC were determined to be ∼2.7, ∼2.3 and ∼1.6 eV, respectively. The UV-vis DRS results showed that all samples have visible light absorption capacity, while NZVI/g-C3N4@EGC shows an enhanced ability to absorb and utilize visible light better than pristine g-C3N4 and g-C3N4@EGC.
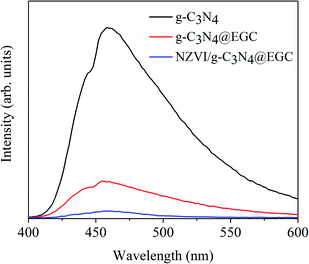
Photoluminescence (PL) emission spectra are widely used to study the transfer behavior of charge carriers in prepared samples. Generally, a stronger PL signal represents a shorter lifetime of the photogenerated carriers excited under radiation.32 Fig. 6 presents the PL spectra of pristine g-C3N4, g-C3N4@EGC and NZVI/g-C3N4@EGC under an excitation wavelength of 325 nm. It can be seen that pristine g-C3N4 has a higher PL emission peak at 455 nm, demonstrating the high recombination rate of photogenerated electron–hole pairs. Conversely, g-C3N4@EGC showed a weaker PL peak, further demonstrating that the presence of EGC can promote the transport of photogenerated electrons to achieve a highly efficient charge separation process. In addition, the PL intensity of NZVI/g-C3N4@EGC is obviously decreased compared with that of g-C3N4@EGC, indicating that the doping of NZVI can effectively promote the electron–hole migration ability. Due to the introduction of graphene and nano-iron, the charge is frequently transferred between g-C3N4, EGC and NZVI, which effectively promotes the photocatalytic activity.
Photocatalytic activity
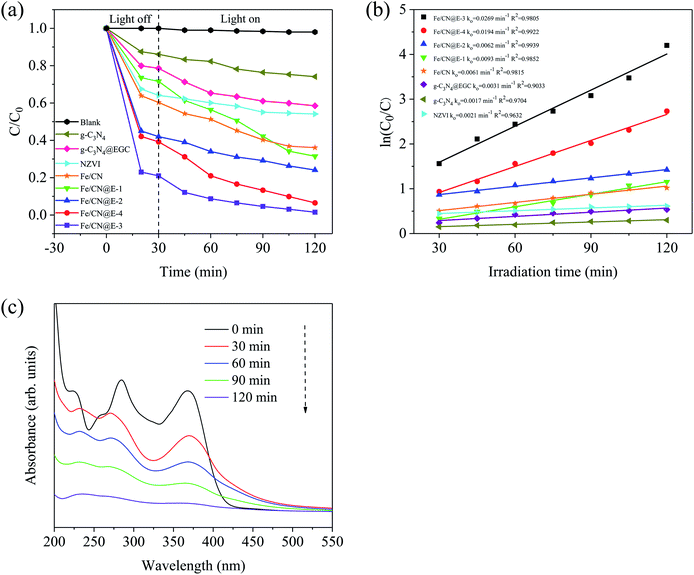
Fig. 7a shows the degradation efficiency of TC in samples prepared under visible light irradiation; the results indicate that TC was fairly stable in the absence of a catalyst, suggesting that its self-degradation effects were negligible. The pristine g-C3N4 and g-C3N4@EGC could degrade TC by 25.9% and 41.5% within 90 min of visible light irradiation, possibly because the support of EGC provides considerable adsorption capacity and improves the absorption of visible light; as expected, g-C3N4@EGC has a lower band gap value. For pure NZVI, its removal efficiency of TC is 45.9% within 120 min. However, after 60 min, it shows a slower removal efficiency; this is because the main removal mechanism of NZVI is reduction and adsorption.33,34 The low removal efficiency of TC is due to the fact that the defects of facile agglomeration and oxidation of NZVI particles lead to a decrease in the number of active sites. For Fe–CN, it degraded 63.9% of TC after 120 min, which is higher than the amounts degraded by pure NZVI, pristine g-C3N4 and g-C3N4@EGC; this is probably because the loading of NZVI provides reducing power to the composite and promotes the generation of synergy. Meanwhile, compared with pristine g-C3N4, NZVI, g-C3N4@EGC and Fe–CN, Fe0-doped ternary composites exhibit higher degradation efficiency to TC and improved the removal efficiency of composites in TC under dark conditions. After 90 min of visible light irradiation, Fe/CN@E-1, Fe/CN@E-2, Fe/CN@E-3 and Fe/CN@E-4 degraded 68.8%, 85.9%, 98.5% and 93.7% of the TC, respectively. Among the samples, Fe/CN@E-3 exhibits the highest degradation efficiency for TC. The results show that in the photocatalytic reaction system, there are significant synergistic effects of the three components, including adsorption, reduction ability and photocatalytic activity. In addition, the photocatalytic activity of NZVI/g-C3N4@EGC was compared with those of previously reported photocatalysts.35–42 The degradation efficiencies of tetracycline in different samples are listed in Table 2. It can be seen from the comparison that NZVI/g-C3N4@EGC requires a lower addition dosage and less visible light irradiation time to remove higher concentrations of TC.| Catalyst | Dosage (g) | C0 (mg L−1) | Time (min) | Removal (%) | Radiation source | Ref. |
|---|---|---|---|---|---|---|
| AgI/BiVO4 | 0.03 | 100 mL, 20 mg L−1 | 60 | 95 | UV-filter 300 W Xe lamp | 35 |
| MS@FCN | 0.08 | 100 mL, 20 mg L−1 | 120 | 90 | UV-filter 300 W Xe lamp | 36 |
| Ag3PO4/CuBiO4 | 0.05 | 100 mL, 10 mg L−1 | 60 | 75 | UV-filter 300 W Xe lamp | 37 |
| NaTaO3@WO3 | 0.025 | 100 mL, 20 mg L−1 | 420 | 61 | UV-filter 500 W Xe lamp | 38 |
| SrTiO3/Bi2O3 | 0.01 | 100 mL, 10 mg L−1 | 140 | 85 | UV-filter 250 W Xe lamp | 39 |
| N-CNT/mpg-CN | 0.05 | 50 mL, 20 mg L−1 | 240 | 67 | UV-filter 300 W Xe lamp | 40 |
| GQDs/mpg-CN | 0.05 | 50 mL, 20 mg L−1 | 120 | 70 | UV-filter 300 W Xe lamp | 41 |
| ZnO/CeO2/HNTs | 0.03 | 100 mL, 20 mg L−1 | 60 | 94 | Solar 300 W Xe lamp | 42 |
| NZVI/g-C3N4@EGC | 0.03 | 60 mL, 30 mg L−1 | 30 | 91 | UV-filter 300 W Xe lamp | — |
The pseudo-first-order kinetics model was applied to analyze the photo-degradation of tetracycline by the as-prepared samples under visible light illumination. As plotted in Fig. 7b, the values of the correlation coefficients R2 were above 0.9, illustrating that the removal process of TC could be well expressed with pseudo-first-order kinetics. By observing the linear correlation between ln(C0/C) and the irradiation time, it can be seen that NZVI/g-C3N4@EGC exhibited the fastest reaction rate. Especially, the reaction rate constant of Fe/CN@E-3 (ko = 0.0269 min−1) was approximately 15.8-fold, 12.8-fold, 8.7-fold and 4.4-fold those of pristine g-C3N4 (ko = 0.0017 min−1), pure NZVI (ko = 0.0021 min−1), g-C3N4@EGC (ko = 0.0031 min−1) and Fe–CN (ko = 0.0061 min−1), respectively. This indicates that the reduction ability provided by NZVI plays an important role. However, the reaction rate constant of Fe/CN@E-4 (ko = 0.0194 min−1) is slightly lower than that of Fe/CN@E-3 because the excess NZVI particles were deposited on the surface of g-C3N4@EGC, which resulted in a decrease in the number of active sites on the g-C3N4 surface.
In order to detect changes in the concentration of TC and its intermediates during the degradation process, the absorbance variations of TC over NZVI/g-C3N4@EGC are shown in Fig. 7c. The ultraviolet-visible light patterns show two characteristic peaks of TC located at 275 nm and 360 nm. As the reaction progresses, the absorbance of TC gradually decreases until it completely disappears after 120 min, thereby supporting the complete degradation of tetracycline.43 Meanwhile, the appearance of a new peak at 240 nm indirectly proves that the tetracycline molecules are mainly destroyed and form aromatic degradation by-products with stable molecular structures.44 Finally, the absorption peaks of TC and the degradation by-products of TC were found to disappear, indicating decomposition into CO2 and H2O.45
In order to verify the feasibility of photocatalytic materials in practical applications, it is necessary to study the removal efficiency of TC in different water environments. Fig. 8a shows the effects of the initial TC concentration on the photocatalytic performance of Fe/CN@E-3. When the initial concentrations of TC were 10 mg L−1, 20 mg L−1, 30 mg L−1, 50 mg L−1, and 70 mg L−1, the degradation efficiencies of Fe/CN@E-3 towards TC were 99.4%, 98.9%, 98.5%, 93.8%, and 81.8%, respectively. This is because as the initial concentration of tetracycline increases, the active sites of Fe/CN@E-3 become more occupied, resulting in a decrease in the degradation efficiency. At the same time, the increase in concentration increases the turbidity of the solution, which hinders the absorption of visible light by the photocatalyst.
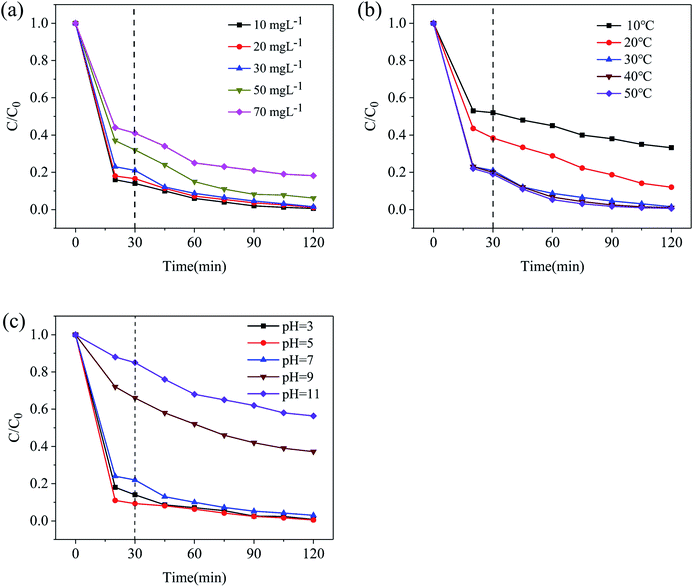 | ||
| Fig. 8 Factorial effects on the photo-degradation of tetracycline over Fe/CN@E-3 under visible light: (a) initial tetracycline concentration, (b) reaction temperature, (c) pH value. | ||
Fig. 8b depicts the effects of reaction temperature on the degradation efficiency of Fe/CN@E-3 towards TC. When the temperature is raised from 10 °C to 50 °C, the degradation efficiency of Fe/CN@E-3 towards TC gradually increases from 66.8% to 99.4%. Obviously, as the reaction temperature increases, the degradation efficiency of TC increases. This is because higher temperatures cause the TC decomposition products to desorb faster in water; as a result, new TC molecules are more efficiently adsorbed onto the surface of Fe/CN@E-3, which facilitates the removal of TC.
The pH of the solution has an important influence on water treatment. As shown in Fig. 8c, when the pH values of the solution were 3, 5, 7 and 9, the degradation efficiencies of Fe/CN@E-3 towards tetracycline were 99.2%, 99.5%, 97.0%, 62.8% and 43.6%, respectively. It can be seen that TC can be almost completely degraded in an acidic solution. This is because the corrosion rate of NZVI in the acidic solution was accelerated, a large amount of iron ions were generated in the solution and the degradation of TC was further promoted by the homogeneous Fenton-like reaction process.45 However, the surface of NZVI was easily passivated by iron hydroxide in an alkaline solution; the formation of the hydrous ferric oxide passivation layer leads to blockage of the reaction sites, which greatly decreased the photocatalytic performance of Fe/CN@E-3.
It is well known that the recyclability of catalytic materials is important for practical applications. Hence, the magnetic behavior was studied by the hysteresis loop curve of Fe/CN@E-3 at room temperature. Fig. S1† shows that Fe/CN@E-3 has ferromagnetic behavior with a saturation magnetization of 26.5 emu g−1; thus, it could be readily collected from water by supplying an external magnetic field. The reusability and stability of Fe/CN@E-3 for continuous tetracycline degradation reactions were verified by a 5-cycle test. As can be seen from Fig. 9a, compared with the freshly prepared catalyst, the photocatalytic performance of the regenerated catalyst did not deteriorate significantly after 5 successive cycling runs, which confirms that Fe/CN@E-3 has sufficient stability during the degradation of TC. In addition, after water purification, as a magnetic composite, Fe/CN@E-3 can be easily separated from the target polluted water for reuse by using an external magnetic field. Consequently, Fe/CN@E-3 has good water treatment prospects due to its recyclability and facile recycling characteristics.
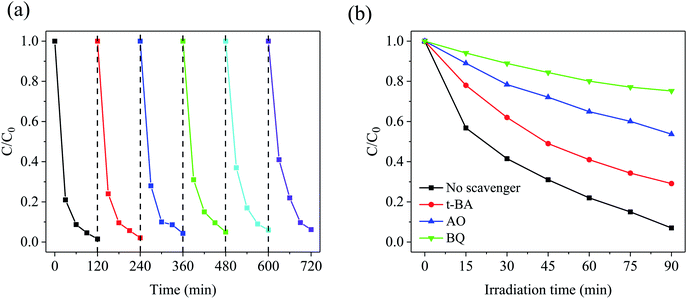 | ||
| Fig. 9 (a) Recycling runs in the degradation of tetracycline over Fe/CN@E-3; (b) effects of different scavengers on TC degradation. | ||
Possible degradation mechanism
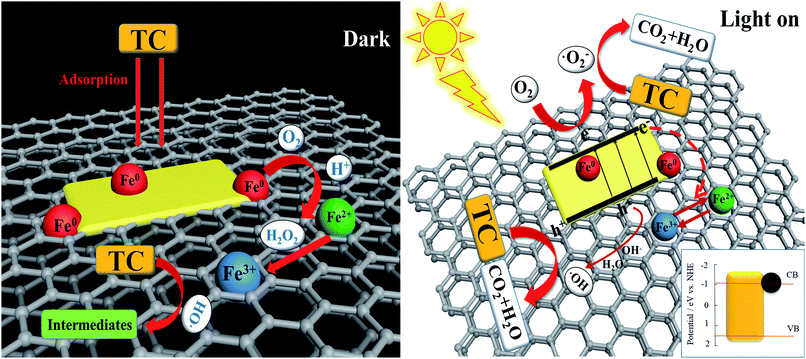
To illustrate the photo-degradation mechanism of TC, a series of free radical trap experiments were performed to examine the major active species that cause TC degradation. Generally, hydroxyl radicals (˙OH), superoxide radicals (˙O2−) and photogenerated holes (h+) are recognized reactive species in the photocatalytic degradation of organic pollutants.46 Hence, the scavengers tert-butanol (t-BA), ammonium oxalate (AO) and p-benzoquinone (BQ) were added to the reaction system to remove ˙OH, h+, and ˙O2−, respectively.47 The observed changes in the degradation efficiency of TC are displayed in Fig. 9b. Compared with the blank control group, the degradation efficiency of TC decreased by about 14%, 52% and 73%, respectively. After AO and BQ were respectively added to the reaction system to capture h+ and ˙O2−, the degradation efficiency of TC was significantly decreased; however, the effect of the lack of ˙OH was not obvious, which indicates that h+ and ˙O2− may be the major reactive species and ˙OH serves as a minor reactive species in the degradation reaction of TC.48 Furthermore, ESR spectroscopy with the DMPO technique was used to reveal the radical species in the reaction system in the dark and under visible light irradiation; the results are shown in Fig. S2a and b.† No signals were detected in the dark, indicating that the amounts of ˙OH and ˙O2− were insufficient. However, a strong DMPO–˙O2− signal and a weaker DMPO–˙OH signal were detected in the suspension of Fe/CN@E-3 after 10 min of visible light irradiation; these results indicate that ˙O2− is the main reactive species in the degradation process of TC, while ˙OH does not play a key role in the reaction system.49 The results of the ESR-DMPO method are in good agreement with the results of the abovementioned free radical trapping experiments.Based on the above results, a possible mechanism for the synergistic degradation of TC using Fe/CN@E-3 is schematically shown in Fig. 10. Due to the adsorption capacity of Fe/CN@E-3, a large amount of tetracycline was separated from the solution, enhancing its contact with the active species. In addition, the EGC support can effectively inhibit the aggregation of NZVI particles and provide a large number of reaction sites to accelerate the reduction reaction during the degradation process. At the same time, iron ions were formed in solution, which promoted the generation of ˙OH by the Fenton-like reaction. At this time, the adsorption and reduction reaction are the main removal pathways of TC (eqn. (4)–(7)).34
| TC + NZVI/g-C3N4@EGC → TC–NZVI/g-C3N4@EGC | (4) |
| Fe0 + O2 + 2H+ → H2O2 + Fe2+ | (5) |
| Fe2+ + H2O2 → Fe3+ + ˙OH + OH− | (6) |
| ˙OH + TC → intermediates | (7) |
Under the irradiation of visible light, the electrons (e−) of g-C3N4 were promoted to the conduction band, leaving positive holes (h+) in the valence band; here, h+ could directly participate in the degradation of TC, and e− could be transferred in two ways: (1) because of the excellent electrical conductivity of EGC, e− was rapidly transferred to the surface of EGC and came in contact with O2, then generated superoxide radicals (˙O2−). (2) e− was trapped by iron ions and inhibited further oxidation of Fe0, which accelerated the heterogeneous Fenton-like process and maintained the reduction ability of Fe0.50 In addition, holes (h+) could react with surface hydroxyl groups (–OH) and H2O adsorbed on the surface of the EGC, resulting in the formation of ˙OH.51 With the formation of h+, ˙O2− and the minor reactive species ˙OH, the tetracycline molecules and intermediates were gradually mineralized into carbon CO2 and H2O.48 The corresponding reaction process can be expressed as follows (eqn. (8)–(13)):
| NZVI/g-C3N4@EGC + hν → e− + h+ | (8) |
| O2 + e− → ˙O2− | (9) |
| Fe3+ + e− → Fe2+ | (10) |
| h+ + OH− → ˙OH | (11) |
| h+ + H2O → ˙OH + H+ | (12) |
| ˙O2−/h+/˙OH + TC/intermediates → CO2 + H2O | (13) |
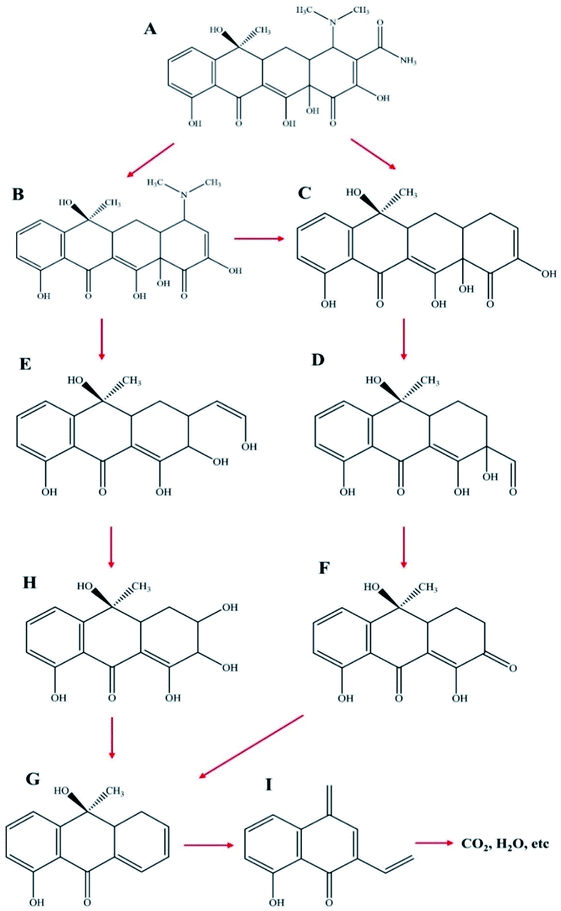
For further explanation and description of the photo-degradation process, the possible intermediates and degradation process were analyzed by HPLC-mass spectrometry. The changes in the measured mass and the intermediate products of TC after 30 min and 60 min of irradiation were analyzed, and the results are shown in Fig. 11a–c. As shown in Fig. 12, first, tetracycline A (m/z = 445) was fragmented into B (m/z = 403) and C (m/z = 360) by losing –CONH2 and –N(CH3)2. With the attack of the reactive species, B and C generated E (m/z = 317) and D (m/z = 306), respectively, by losing –N(CH3)2 and by direct cleavage of the aromatic ring. As the reaction proceeded, D formed F (m/z = 274) by losing –OH and then lost –OH and ![[double bond, length as m-dash]](https://www.rsc.org/images/entities/char_e001.gif) O groups to generate G (m/z = 241). Furthermore, the intermediate E was decomposed into H (m/z = 291) by a rearrangement reaction. Subsequently, H was further decomposed into G by an addition reaction and elimination reaction. Then, G was decomposed into I (m/z = 199) by the removal of the C
O groups to generate G (m/z = 241). Furthermore, the intermediate E was decomposed into H (m/z = 291) by a rearrangement reaction. Subsequently, H was further decomposed into G by an addition reaction and elimination reaction. Then, G was decomposed into I (m/z = 199) by the removal of the C![[double bond, length as m-dash]](https://www.rsc.org/images/entities/char_e001.gif) C group. Finally, these intermediates could be further degraded to CO2, H2O and other small molecules.
C group. Finally, these intermediates could be further degraded to CO2, H2O and other small molecules.
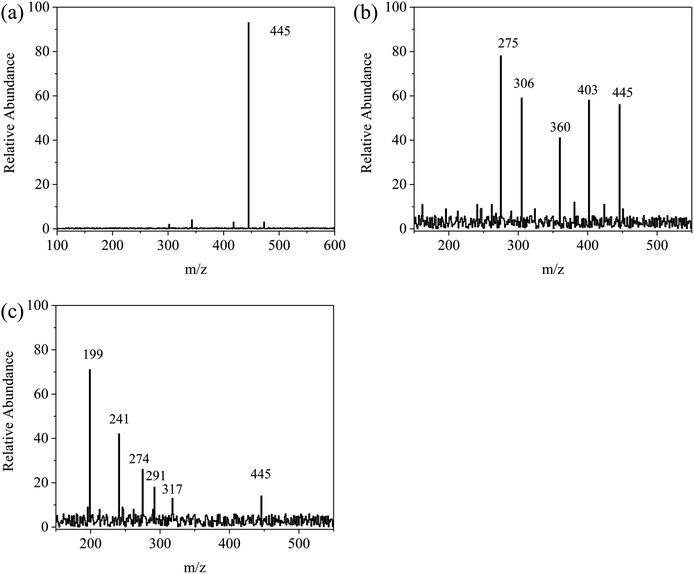 | ||
| Fig. 11 EIC of m/z for degraded tetracycline: (a) the initial tetracycline solution, (b) degradation of tetracycline in 30 min by Fe/CN@E-3, (c) degradation of tetracycline in 60 min by Fe/CN@E-3. | ||
Conclusions
In this study, we firstly synthesized a magnetic NZVI/g-C3N4@EGC composite. SEM, TEM, XRD, XPS and FTIR studies were used to analyze the structure and chemical composition of NZVI/g-C3N4@EGC. The optical properties were analyzed by UV-vis-DRS and PL spectroscopy. The adsorption, reduction and photocatalytic performance of NZVI/g-C3N4@EGC were used to complete the degradation of TC; the removal efficiency reached 98.5%. The high degradation efficiency of TC can be attributed to the synergistic effect and the formation of a heterogeneous photo-Fenton system. The results show that the doping of NZVI particles and the support of EGC promote the transfer of photogenerated electrons while the photocatalytic performance of g-C3N4 and the reductive ability of NZVI are maintained. The removal process of TC experienced two stages; the first stage was adsorption and reduction, in which NZVI decomposed TC molecules into various intermediates. Then, the second stage achieved complete mineralization of TC and its intermediates by visible light-driven photo-degradation. Moreover, NZVI/g-C3N4@EGC exhibited high stability and reusability in degrading TC, and the magnetic composite was easily recycled from water. This work provides a potential environmentally benign material for the treatment of antibiotic wastewater and offers new insight into improving the catalyst activity through the formation of synergistic effects.Conflicts of interest
There are no conflicts to declare.Acknowledgements
This research was supported by the National Natural Science Foundation of China (Grant No. 51968031) and the National Key Research and Development Program of China (Grant No. 2018YFC1900301).References
- A. Sullivan, C. Edlund and C. E. Nord, Lancet Infect. Dis., 2001, 1, 101–114 CrossRef CAS
.
- J. C. Chee-Sanford, R. I. Mackie, S. Koike, I. G. Krapac, Y. F. Lin, A. C. Yannarell, S. Maxwell and R. I. Aminov, J. Environ. Qual., 2009, 38, 1086–1181 CrossRef CAS
.
- N. Li, L. Zhou, X. Y. Jin, G. Owens and Z. L. Chen, J. Hazard. Mater., 2019, 366, 563–572 CrossRef CAS
.
- H. Wu, Z. H. Ai and L. Z. Zhang, Water Res., 2014, 52, 92–100 CrossRef CAS
.
- X. Y. Wang, Y. Du, H. L. Liu and J. Ma, RSC Adv., 2018, 23, 12791–12798 RSC
.
- J. X. Li, X. M. Dou, H. J. Qin, Y. K. Sun, D. Q. Yin and X. H. Guan, Water Res., 2019, 148, 70–85 CrossRef CAS
.
- X. H. Guan, Y. K. Sun, H. J. Qin, J. X. Li, I. M. C. Lo, D. He and H. R. Dong, Water Res., 2015, 75, 224–248 CrossRef CAS
.
- X. L. Weng, W. L. Cai, S. Lin and Z. L. Chen, Appl. Clay Sci., 2017, 147, 137–142 CrossRef CAS
.
- Z. H. Ai, N. Wu and L. Z. Zhang, Catal. Today, 2014, 224, 180–187 CrossRef CAS
.
- X. Wang, M. Z. Hong, F. W. Zhang, Z. Y. Zhuang and Y. Yu, ACS Sustainable Chem. Eng., 2016, 4, 4055–4063 CrossRef CAS
.
- Z. J. Xie, Y. P. Feng, F. L. Wang, D. N. Chen, Q. X. Zhang, Y. Q. Zeng, W. Y. Lv and G. G. Liu, Appl. Catal., B, 2018, 229, 96–104 CrossRef CAS
.
- J. F. Chen, Q. Yang, J. B. Zhong, J. Z. Li, C. Hu, Z. Deng and R. Duan, Mater. Chem. Phys., 2018, 217, 207–215 CrossRef CAS
.
- G. Z. Liao, D. Y. Zhu, L. S. Li and B. Y. Lan, J. Hazard. Mater., 2014, 280, 531–535 CrossRef CAS
.
- J. Liu, Y. Liu, N. Y. Liu, Y. Z. Han, X. Zhang, H. Huang, Y. Lifshitz, S. T. Lee, J. Zhong and Z. H. Kang, Science, 2015, 347, 970–974 CrossRef CAS
.
- B. Y. Li, X. Yu, X. L. Yu, R. F. Du, L. Liu and Y. H. Zhang, Ind. Eng. Chem. Res., 2018, 57, 4311–4319 CrossRef
.
- D. Z. Lu, X. Y. Zhang, S. Wang, W. B. Peng, M. M. Wei, D. Neena, H. Q. Fan and H. J. Hao, Appl. Surf. Sci., 2019, 470, 368–375 CrossRef CAS
.
- X. J. Yu, Y. H. Zhang and X. W. Cheng, Electrochim. Acta, 2014, 137, 668–675 CrossRef CAS
.
- X. Q. Yue, R. J. Zhang, F. C. Zhang and L. Q. Wang, Desalination, 2010, 252, 163–166 CrossRef CAS
.
- X. Wang, X. J. Wang, J. F. Zhao, J. K. Song, L. J. Zhou, J. Y. Wang, X. Tong and Y. S. Chen, Appl. Catal., B, 2017, 206, 479–489 CrossRef CAS
.
- P. Xiao, D. L. Jiang, T. Liu, D. Li and M. Chen, Mater. Lett., 2018, 212, 111–113 CrossRef CAS
.
- J. X. Zhang, Y. B. Zhang, X. Quan, Y. Li, S. Chen, H. M. Zhao and D. Wang, Biochem. Eng. J., 2012, 63, 31–37 CrossRef CAS
.
- X. Wang, W. Wang, X. J. Wang, J. Zhang, Z. L. Gu, L. J. Zhou and J. F. Zhao, RSC Adv., 2015, 5, 41385–41392 RSC
.
- Q. H. Liang, Z. Li, Z. H. Huang, F. Y. Kang and Q. H. Yang, Adv. Funct. Mater., 2015, 25, 6885–6892 CrossRef CAS
.
- Z. W. Tong, D. Yang, J. F. Shi, Y. H. Nan, Y. Y. Sun and Z. Y. Jiang, ACS Appl. Mater. Interfaces, 2015, 7, 25693–25701 CrossRef CAS
.
- C. B. Xu, W. J. Yang, W. J. Liu, H. L. Sun, C. L. Jiao and A. J. Lin, J. Environ. Sci., 2018, 67, 14–22 CrossRef
.
- S. Chella, P. Kollu, E. V. P. R. Komarala, S. Doshi, M. Saranya, S. Felix, R. Ramachandran, P. Saravanan, V. L. Koneru, V. Venugopal, S. K. Jeong and A. N. Grace, Appl. Surf. Sci., 2015, 327, 27–36 CrossRef CAS
.
- A. Thomas, A. Fischer, F. Goettmann, M. Antonietti, J. O. Mueller, R. Schloegl and J. M. Carlsson, J. Mater. Chem., 2008, 18, 4893–4908 RSC
.
- L. Q. Ye, J. Y. Liu, Z. Jiang, T. Y. Peng and L. Zan, Appl. Catal., B, 2013, 142, 1–7 Search PubMed
.
- X. J. Wang, J. Y. Wang, J. Zhang, B. Louangsouphom, J. K. Song, X. Wang and J. F. Zhao, J. Photochem. Photobiol., A, 2017, 347, 105–115 CrossRef CAS
.
- S. F. Kang, Y. Fang, Y. K. Huang, L. F. Cui, Y. Z. Wang, H. F. Qin, Y. M. Zhang, X. Li and Y. G. Wang, Appl. Catal., B, 2015, 168, 472–482 CrossRef
.
- Y. J. Shih, C. C. Su, C. W. Chen and C. D. Dong, Catal. Commun., 2015, 72, 127–132 CrossRef CAS
.
- S. F. Chen, Y. F. Hu, S. G. Meng and X. L. Fu, Appl. Catal., B, 2014, 150–151, 564–573 CrossRef CAS
.
- L. J. Xu and J. L. Wang, Appl. Catal., B, 2013, 142, 396–405 CrossRef
.
- J. Y. Cao, Z. K. Xiong and B. Lai, Chem. Eng. J., 2018, 343, 492–499 CrossRef CAS
.
- F. Chen, Q. Yang, J. Sun, F. B. Yao, S. Wang, Y. L. Wang, X. Y. Wang, X. M. Li, C. G. Niu and D. B. Wang, ACS Appl. Mater. Interfaces, 2016, 8, 32887–32900 CrossRef CAS
.
- Z. Zhu, X. Tang, S. Kang, P. W. Huo, M. S. Song, W. D. Shi, Z. Y. Lu and Y. S. Yan, J. Phys. Chem. C, 2016, 120, 27250–27258 CrossRef CAS
.
- W. L. Shi, F. Guo and S. L. Yuan, Appl. Catal., B, 2017, 209, 720–728 CrossRef CAS
.
- L. N. Qu, J. Y. Lang, S. W. Wang, Z. L. Chai, Y. G. Su and X. J. Wang, Appl. Surf. Sci., 2016, 388, 412–419 CrossRef CAS
.
- H. N. Che, J. B. Chen, K. Huang, W. Hu, H. Hu, X. T. Liu, G. B. Che, C. B. Liu and W. D. Shi, J. Alloys Compd., 2016, 688, 882–890 CrossRef CAS
.
- J. Y. Liu, Y. H. Song, H. Xu, X. W. Zhu, J. B. Lian, Y. Xu, Y. Zhao, L. Y. Huang, H. Y. Ji and H. M. Li, J. Colloid Interface Sci., 2017, 494, 38–46 CrossRef CAS
.
- J. Y. Liu, H. Xu, Y. G. Xu, Y. H. Song, J. B. Lian, Y. Zhao, L. Wang, L. Y. Huang, H. Y. Ji and H. M. Li, Appl. Catal., B, 2017, 207, 429–437 CrossRef CAS
.
- Z. F. Ye, J. Z. Li, M. J. Zhou, H. Q. Wang, Y. Ma, P. W. Huo, L. B. Yu and Y. S. Yan, Chem. Eng. J., 2016, 304, 917–933 CrossRef CAS
.
- H. F. Xiong, D. L. Zou, D. D. Zhou, S. S. Dong, J. W. Wang and B. E. Rittmann, Chem. Eng. J., 2017, 316, 7–14 CrossRef CAS
.
- N. Q. Zhang, J. Y. Chen, Z. Q. Fang and E. P. Tsang, Chem. Eng. J., 2019, 369, 588–599 CrossRef CAS
.
- Z. Y. Lu, X. X. Zhao, Z. Zhu, M. S. Song, N. L. Gao, Y. S. Wang, Z. F. Ma, W. D. Shi, Y. S. Yan and H. J. Dong, Catal. Sci. Technol., 2016, 6, 6513–6524 RSC
.
- X. Y. Wang, M. Y. Lu, J. Ma, P. Ning and L. Che, J. Taiwan Inst. Chem. Eng., 2018, 91, 609–622 CrossRef CAS
.
- X. Y. Gao, W. Peng, G. B. Tang, Q. Guo and Y. M. Luo, J. Alloys Compd., 2018, 757, 455–465 CrossRef CAS
.
- X. M. Liang, Y. Q. Zhang, D. Li, B. W. Wen, D. L. Jiang and M. Chen, Appl. Surf. Sci., 2019, 466, 863–873 CrossRef CAS
.
- H. Y. Liu, C. Liang, C. G. Niu, D. W. Huang, Y. B. Du, H. Guo, L. Zhang, Y. Y. Yang and G. M. Zeng, Appl. Surf. Sci., 2019, 475, 421–434 CrossRef CAS
.
- X. Y. Wang, A. Q. Wang, M. Y. Lu and J. Ma, Chem. Eng. J., 2018, 337, 372–384 CrossRef CAS
.
- G. L. Zhou, H. Q. Sun, S. B. Wang, H. M. Ang and M. O. Tade, Sep. Purif. Technol., 2011, 80, 626–634 CrossRef CAS
.
Footnote |
| † Electronic supplementary information (ESI) available. See DOI: 10.1039/c9ra06620a |
| This journal is © The Royal Society of Chemistry 2019 |

