
 Open Access Article
 This Open Access Article is licensed under a Creative Commons Attribution-Non Commercial 3.0 Unported Licence
Nanoscale magnetic and charge anisotropies at manganite interfaces†
Santiago J. Carreira *ab,
Myriam H. Aguirrecde,
Javier Briaticof and
Laura B. Sterenab
*ab,
Myriam H. Aguirrecde,
Javier Briaticof and
Laura B. Sterenab
aConsejo Nacional de Investigaciones Científicas y Técnicas, Argentina. E-mail: steren@tandar.cnea.gov.ar; Tel: +54-11-6772-7103
bLaboratorio de Nanoestructuras Magnéticas y Dispositivos, Dpto. Materia Condensada, Instituto de Nanociencia y Nanotecnología (INN), Centro Atómico Constituyentes (CNEA), 1650 San Martín, Buenos Aires, Argentina
cInstituto de Ciencia de Materiales de Aragón (ICMA), Instituto de Nanociencia de Aragón (INA), Universidad de Zaragoza, E-50018 Zaragoza, Spain. E-mail: maguirre@unizar.es; Fax: +34 976 76 2776; Tel: +34 876 55 5365
dDepartamento de Física de la Materia Condensada, Universidad de Zaragoza, E-50009 Zaragoza, Spain
eLaboratorio de Microscopías Avanzadas, Universidad de Zaragoza, E-50018 Zaragoza, Spain
fUnité Mixte de Physique, CNRS, Thales, Université Paris-Sud, Université Paris-Saclay, Palaiseau 91767, France
First published on 25th November 2019
Abstract
Strong correlated manganites are still under intense research owing to their complex phase diagrams in terms of Sr-doping and their sensitivity to intrinsic and extrinsic structural deformations. Here, we performed X-ray absorption spectroscopy measurements of manganite bilayers to explore the effects that a local Sr-doping gradient produce on the charge and antiferromagnetic anisotropies. In order to gradually tune the Sr-doping level along the axis perpendicular to the samples we have grown a series of bilayers with different thicknesses of low-doped manganites (from 0 nm to 6 nm) deposited over a La0.7Sr0.3MnO3 metallic layer. This strategy permitted us to resolve with high accuracy the thickness region where the charge and spin anisotropies vary and the critical thickness tc over which the out of plane orbital asymmetry does not have any further modifications. We found that the antiferromagnetic spin axis points preferentially out of the sample plane regardless the capping layer thickness. However, it tilts partially into the sample plane far from this critical thickness, owing to the combined contributions of the external structural strain and electron doping. Furthermore, we found that the doping level of the capping layer strongly affects the critical thickness, giving clear evidence of the influence exerted by the electron doping on the orbital and magnetic configurations. These anisotropic changes induce subtle modifications on the domain reorientation of La0.7Sr0.3MnO3, as evidenced from the magnetic hysteresis cycles.
1. Introduction
Artificial heterostructures of complex oxides are still highly attractive as an alternative path to overcome the miniaturization issues that arise in current semiconductor technologies. Among these oxides, perovskite manganites offer an excellent illustration of the rich and complex electronic and magnetic phases that can arise at oxide interfaces, due to the strong interrelation between the charge, spin and lattice degrees of freedom.1–4 Owing to their colossal magnetoresistance and half metallicity,4,5 these materials are considered an excellent source of spin polarized currents, with potential applications in magnetic field sensors, magnetic memory devices and spintronic devices.6–8 Moreover, the compound La0.7Sr0.3MnO3 (LS0.3MO) is usually employed as a spin injector in spin valves9 and in magnetic tunnel junctions.10In epitaxial thin films of manganites, the symmetry of the Mn 3d orbitals and the magnetic exchange interactions are strongly affected by the strains induced by the substrate, stabilizing unique electronic phases.
As a general trend, a compressive strain induces an elongation of the oxygen octahedral along the axis perpendicular to the sample plane, stabilizing the occupation of the eg 3z2–r2, whereas a tensile strain promotes a compression of the oxygen octahedral, favouring the x2–y2 filling.11,12 In addition to the strain effects, the atomic plane termination at manganite free surfaces, namely MnO2 or La/SrO, can locally alter the orbital filling. For instance, the absence of the apical oxygen in the MnO2 plane termination may stabilize the 3z2–r2 orbital occupation, even under a tensile strain environment.13 The contribution of the spin density distribution to the surface magnetic anisotropy plays also a decisive role in the resulting orbital configuration, in addition to the strain induced by the substrate.14 The scenario becomes even more rich and complex when we consider Sr-doping gradients with characteristic lengths ranging in the nanometer scale. Such situation deserves particular attention in thin films of lightly Sr-doped manganites, as they exhibit, according to the bulk phase diagram, magnetic and transport phase transitions within the doping range 0 ≤ x ≤ 0.1. The high sensitivity to slightly doping modifications becomes evident in thin films of La0.9Sr0.1MnO3 (LS0.1MO), where their magnetism and transport properties are enhanced with respect to their bulk counterpart. Moreover, they exhibit a thickness dependence of the metal to insulator transition driven by strain relaxation and off-stoichiometry effects.15
We recently reported the evolution of the ratio Mn3+/Mn4+ in terms of the barrier thickness and found that the Mn3+ content increases as a consequence of the larger contribution of the low-doped manganite barrier to the signal.16 The magnetic order in manganite thin films is not purely ferromagnetic, but presents antiferromagnetic (AF) phases coexisting with the ferromagnetism and the contribution of each magnetic order is governed mainly by the strain and the bandwidth of the Mn 3d orbitals.17,18 The presence of AF clusters embedded into a ferromagnetic matrix becomes particularly important at the interface between manganites with different Sr-dopings, because the bandwidth and transport properties are severely affected by the Mn3+/Mn4+ ratio.17,19 In our system the AF clusters are Mn3+-enriched and the proportion of these clusters in the material are expected to increase as we approach to the interface with the low/un-doped manganites present. This scenario motivated us to explore in detail the nature of the local AF anisotropy in manganite thin films with Sr-doping gradients, where orbital and charge reconstructions take place simultaneously within a few units cells.
We are particularly intrigued in studying the local magnetic anisotropy at manganites' surfaces, where a Sr-doping gradient is artificially altered along the axis perpendicular to the sample plane, creating a spatial doping gradient which can locally modify their interfacial electronic properties. To this goal, we explored the orbital and magnetic phases throughout manganite interfaces La0.7Sr0.3MnO3/La1−xSrxMnO3 (LS0.3MO/LSxMO) with x = 0 and x = 0.1, in order to correlate the local changes in the composition with the structural distortions, orbital ordering and magnetic anisotropy. As a surface-sensitive technique, X-ray absorption spectroscopy has proven to be the most adequate tool to reveal both orbital occupancy and the existence of complex magnetic phases.11,12,20–23 In order to describe the LS0.3MO/LSxMO interfaces and determine the evolution of their properties as the LSxMO capping layer thickness increases, we studied bilayers with different LSxMO thicknesses, in the range 0 nm ≤ t ≤ 6 nm (hereafter refer as t-LSxMO series, where t is the thickness and x is the nominal Sr-doping of the capping layer).
These experiments allowed us to establish characteristic length scales for the spatial evolution of the anisotropy in the orbital filling of the 3d energy levels. Remarkably, the spatial evolution of the AF axis presents a non-trivial behaviour, with the highest out of plane anisotropy at intermediate Sr-doping gradients.
These intriguing properties promote subtle effects on the overall magnetic anisotropy of the films, which are revealed by the coercive field dependence observed in terms of the capping layer thickness t. The competition between the strain and charge doping at the surface gives rise to a complex spatial profile of the overall magnetic anisotropy profiles.
These findings provide an outstanding progress in the field of nanoscale magnetism, as they determine quantitatively length scales for the orbital and magnetic reconstruction at manganite surfaces. The direct link of these features and the evolution of the lattice deformation and local stoichiometry are unambiguously verified, as well as their link with the overall magnetic domain reorientation of the LS0.3MO.
2. Results and discussion
2.1 Structural and chemical analysis
The symmetry of the crystalline structure in manganites is severely affected by the Sr-doping level and subtle structural distortions of the oxygen octahedral strongly alter the resulting electronic and magnetic properties. In this work we use as the inner layer the half-metallic manganite LS0.3MO, which in bulk crystallize in a rhombohedral structure R3c with a pseudocubic lattice parameter a (LS0.3MO) = 3.875 Å.24 The outer layers, however, consist of low-doped manganites LSxMO which in bulk exhibit an orthorhombic structure. The pseudocubic lattice constant for the un-doped compound LaMnO3 is a (LMO) = 3.94 Å,25 whereas for the low-doped counterpart LS0.1MO is a (LS0.1MO) = 3.92 Å.26 When the LS0.3MO and LSxMO are brought together in a thin film, the differences in the unit cell size will produce local strain modifications in the near surface region and these modifications can be revealed with a strain analysis of HRSTEM-HAADF images.In Fig. 1(a) we show a typical STEM-HAADF image of a bilayer, where the z-contrast at the interface with the SrTiO3 substrate is clearly visible and no interdiffusion effects were detected. On the contrary, the chemical contrast at the interface of LS0.3MO/LSxMO is too small to be visible in the HRSTEM images. The presence of the low-doped manganite at the outer layers is revealed by assessing the structural deformation along the perpendicular direction with Geometrical Phase Analysis (GPA) on the STEM images.27 In the strain map shown in Fig. 1(b), three distinct regions can be observed along the z-axis, corresponding to different out of plane lattice parameters c. Taking into account that the in-plane parameter a of both layers matches with those of the substrate, we found that the LS0.3MO unit cell is compressed with respect to the SrTiO3 substrate (c/a < 1) and, on the contrary, the LSxMO is elongated along the z-axis.
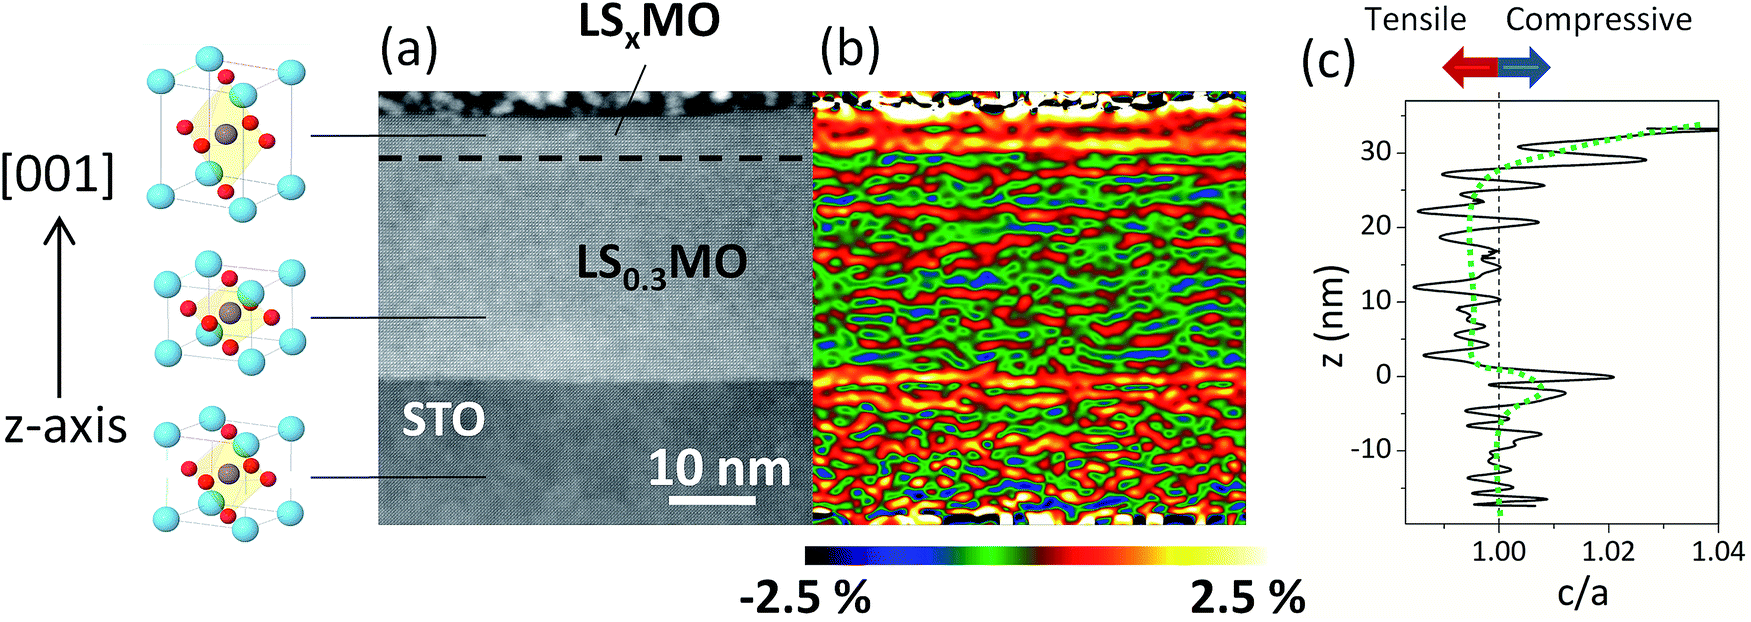 | ||
| Fig. 1 (a) Cross sectional STEM-HAADF image of a STO//LS0.3MO/LSxMO bilayer. The LS0.3MO/LSxMO interface is indicated by a dashed line. (b) GPA strain analysis map of the deformation perpendicular to the film plane. (c) Estimated c/a ratio along the z-axis, extracted from the analysis of the GPA image. A vertical dashed line separates the tensile (c < a) from the compressive (c > a) regions. | ||
Therefore, a clear transition from a compressed oxygen octahedral with c/a < 1 to an elongated oxygen octahedral with c/a > 1 is present at the interfaces LS0.3MO/LSxMO. Based on the GPA images and considering coherent in plane deformations we can deduce the mean unit cell deformation c/a along the z-axis, relative to the substrate, which is plotted in Fig. 1(c). This analysis was complemented with standard X-ray diffraction measurements (further details in Fig. S1 of ESI†), in order to calculate the out of plane lattice constant of the LS0.3MO for both series and to have an estimation of the unit cell distortion of both layers. The structural data is resumed in Table 1, where we also included the vertical deformation of both layers relative to their bulk counterparts εzz = 100(c − cbulk)/cbulk. For both series we found that the LS0.3MO is contracted and the LSxMO is expanded with respect to their bulk values, which further confirms the presence of a local strain gradient with important implications on the subsequent magnetic behavior.
| Series | LS0.3MO | LSxMO | ||||
|---|---|---|---|---|---|---|
| c (Å) (±0.05) | εzz (%) | c/a | c (Å) (±0.05) | εzz (%) | c/a | |
| t-LMO | 3.87 | −0.1 | 0.991 | 3.95 | 0.3 | 1.012 |
| t-LS0.1MO | 3.86 | −0.4 | 0.988 | 3.94 | 1 | 1.010 |
From the electronic perspective, the presence of the low-doped manganites at the surface will supply electrons to fill the 3d shells of the Mn ions, altering the Mn3+/Mn4+ ratio. Atomic resolution Electron Energy Loss Spectroscopy (EELS) analysis of the STEM images is a valuable tool to probe, with spatial resolution, the oxidation state of the Mn in the near surface region. The L edges of the Mn ions results from excitations of 2p electrons into 3d empty bound states or the continuum. Due to the spin–orbit splitting of the 2p state, the spectra shows two absorption peaks L3 and L2, which can be found around 644 eV and 655 eV respectively, and are related to the transitions 2p3/2 → 3d5/2 and 2p1/2 → 3d3/2, as depicted in Fig. 2(a).28 Experimentally, it is found that the intensity ratio between these lines L3/L2 increases with the number of electrons in the 3d bands.29 Specifically for a 3d metal such as Mn, the L3/L2 ratio decreases when the Mn oxidation state increases from +2 to +7.
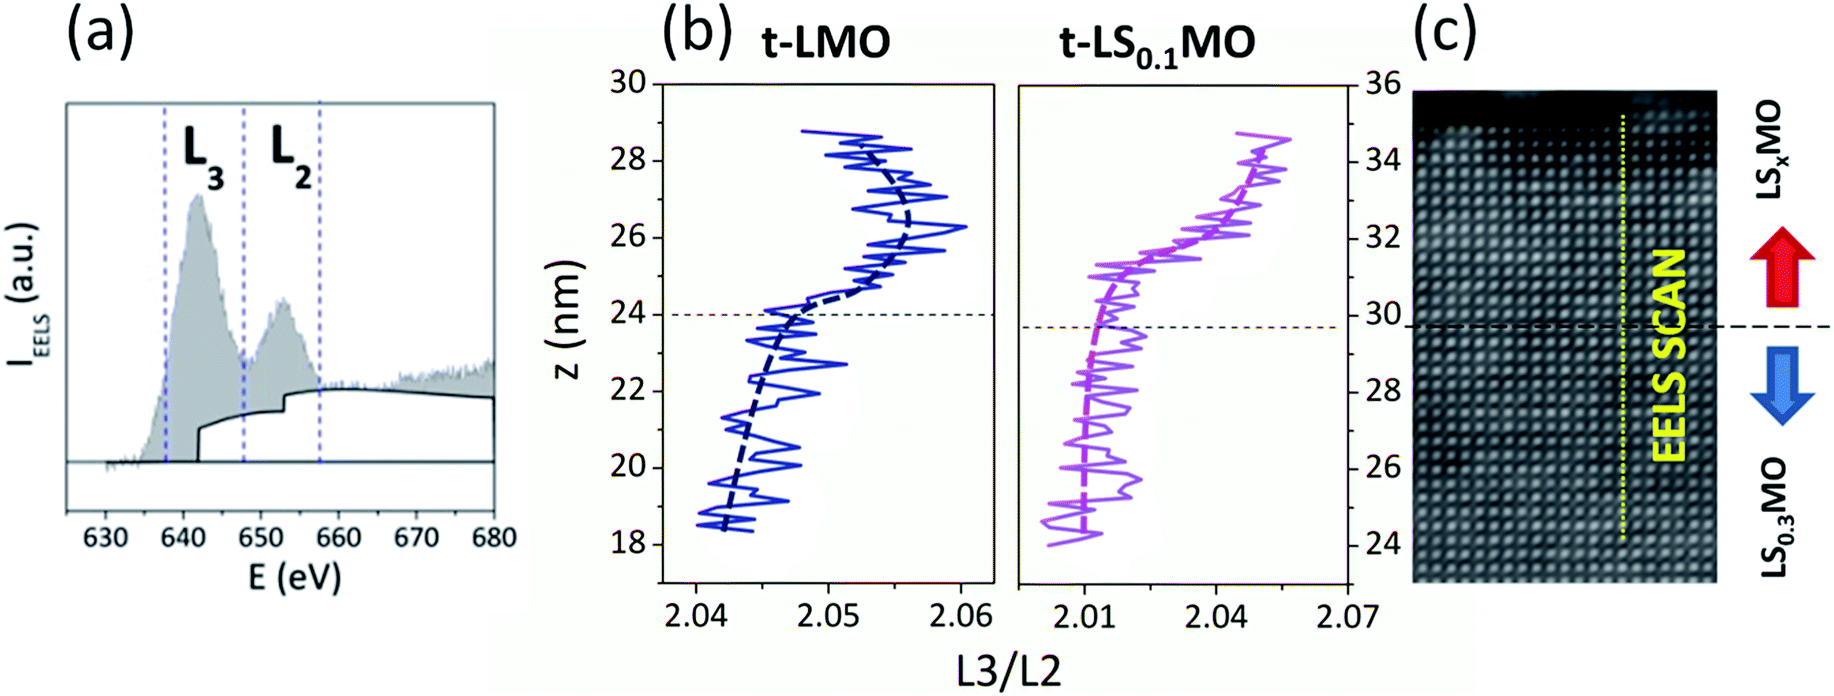 | ||
| Fig. 2 (a) EELS spectra at the Mn L edge. The vertical lines indicate the energy boundaries in which the integrals of each absorption edge were calculated. (b) L3/L2 intensity ratio extracted from the EELS scans throughout the interfaces LS0.3MO/LSxMO, along the direction specified in (c). The horizontal dash lines in (b) and (c) indicate the interface between the LS0.3MO inner layers and the LSxMO capping layers. The EELS scan crossing the interface between the LS0.3MO and the LSxMO is clearly indicated with a vertical dash line. | ||
In order to assess the spatial variation of the L3/L2 ratio we followed the criteria described by M. Varela et al. in ref. 29 and calculated the area under the EELS absorption spectra in a 10 eV window range around the L3 and L2 edges. The ratio of these areas as a function of the z-axis and the STEM image of the samples 4.7-LMO and 5.9-LS0.1MO are shown in Fig. 2(b) and (c) respectively. The ratio L3/L2 increases for both series of samples as we cross the interface and approach to the sample surface, revealing that the oxidation state of the Mn decreases within the capping layers. This is an expectable result, considering that the proportion of Mn3+ increases for the low-doped or un-doped capping layers with respect to the inner LS0.3MO layer, reducing the overall Mn3+/Mn4+ ratio.
2.2 X-ray linear dichroism experiments
X-ray absorption spectroscopy (XAS) experiments in total electron yield mode (TEY) at the Mn L-edge were performed to disentangle the contributions of different orbital and magnetic states at the interfaces, where Sr-doping gradients are present. The experimental geometry used in shown in Fig. 3. The incidence angle of the photon beam in XAS measurements was 30° with respect to the sample surface. The electric field of the incident linear polarized radiation lies into the sample plane for the horizontal polarized radiation (HPR) and almost perpendicular to the sample plane for the vertical polarized radiation (VPR).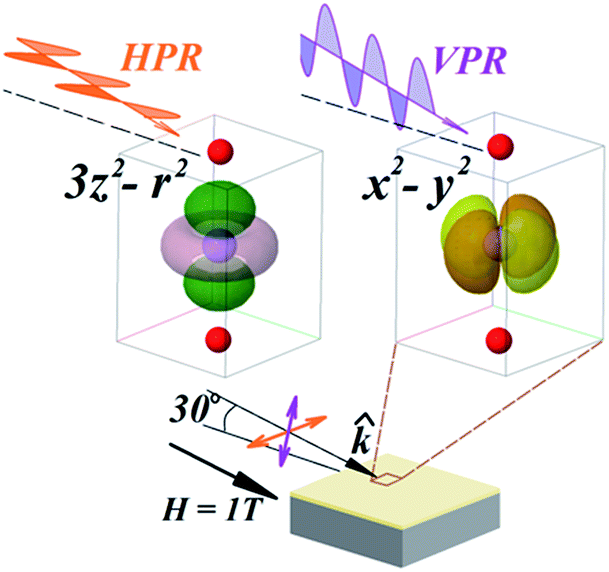 | ||
| Fig. 3 Scheme of the experimental geometry. The orientation of the Mn eg orbitals x2–y2 and 3z2–r2 with respect to the polarized radiation are indicated. | ||
To determine the orbital occupancy and the magnetic structure at the interfaces we performed linearly polarized X-ray absorption spectroscopy (XLD). The linearly-polarized X-ray absorption detects the charge anisotropy along the direction of the electric field, measuring the number of valence holes. In magnetic materials, the magnetization axis is detected through the spin–orbit coupling of the spins to the lattice. The XLD spectrum includes, therefore, orbital (XNLD) and magnetic (XMLD) contributions.22,30 To disentangle the orbital from magnetic dichroisms in magnetic materials, XAS experiments are performed at different temperatures. The XNLD is assumed to be temperature independent and so it will be the only effect that could be causing a dichroic signal close and above the magnetic ordering temperature.27,31
In Fig. 4(a) and (b) we present typical XLD spectra for t-LMO and t-LS0.1MO samples measured at three different temperatures:

 and
and  are the ordering temperature of the LS0.3MO and capping layers respectively. T1 and T3 have been kept at 4 K and 300 K respectively, while T2 was set to 150 K and 230 K for t-LMO and t-LS0.1MO series of samples.
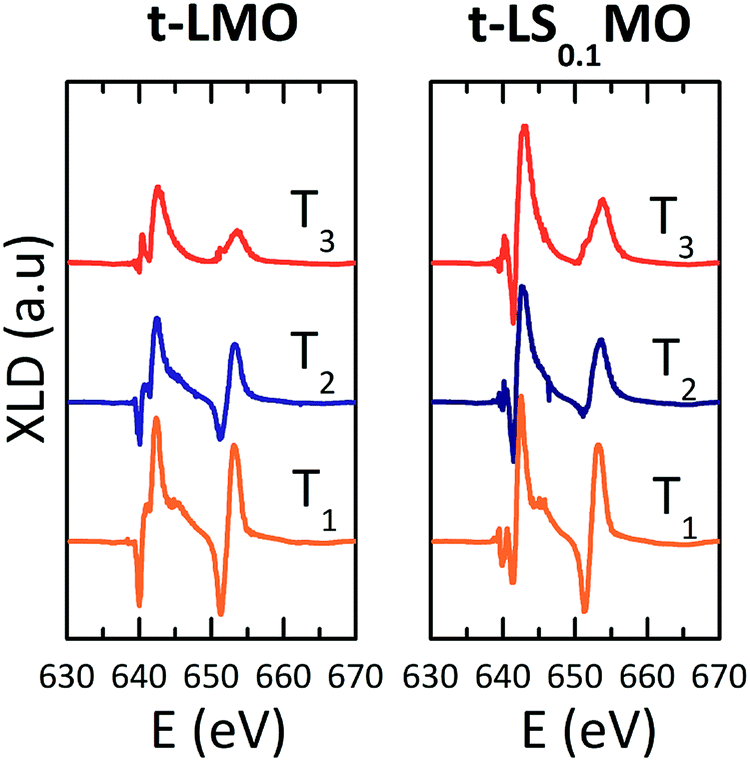 | ||
Fig. 4 Typical XLD spectra for one sample from the t-LS0.1MO (left) and t-LMO (right) sample series. Spectra measured at low temperatures far below  , T1; around , T1; around  , T2, and around , T2, and around  , T3. The curves at different temperatures were shifted vertically. , T3. The curves at different temperatures were shifted vertically. | ||
The area under the XNLD spectra is proportional to the charge anisotropy and its sign defines the electronic preferential occupation asymmetry. We calculated the integral of the XNLD spectra in the energy range between 630 eV and 670 eV, IXNLD,Mn, to explore the orbital occupation asymmetry across the interfaces.
The IXNLD,Mn of the XNLD bilayers spectra is plotted as a function of the barrier thickness in Fig. 5. As a general trend, this intensity increases with the barrier thickness for both set of samples, consistent to an increasing electronic population at the 3z2–r2 orbitals as the barrier thickness increases.
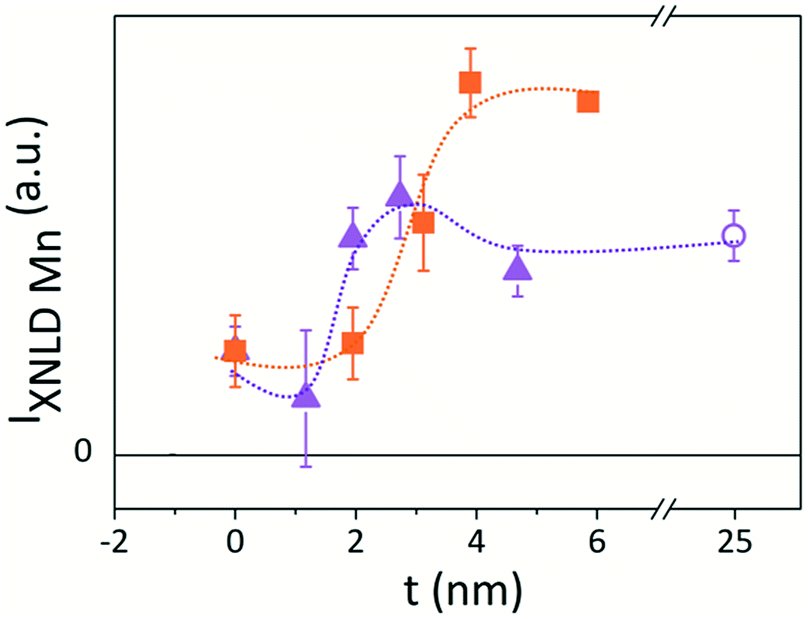 | ||
| Fig. 5 Thickness dependence of the IXNLD,Mn for the (triangles) t-LMO and for the (squares) t-LS0.1MO sample series. The value corresponding to the LaMnO3 reference sample (open circle) is also shown. Dashed lines serve as a guide to the eye. | ||
It is noteworthy that IXNLD,Mn is positive even for the LS0.3MO reference sample, where their surface structure is still subject to a tensile strain (c < a). This could be originated by the absence of the apical oxygen characteristic of the MnO2 surface termination, as revealed by the RHEED patterns measured in situ after growth (see Fig. S3 of the ESI†). For the thicker barriers the IXNLD,Mn reaches a plateau, indicating that the orbital asymmetry does not increase any further. Moreover, the IXNLD,Mn of the LaMnO3 surface shows similar values to those obtained with the thicker barriers of the t-LMO series, suggesting that the orbital configuration of the LaMnO3 surface resemblance to those observed for the bilayers with the thicker capping layers. These results show that the 3z2–r2 preferential orbital occupation at the outer layers increases gradually within a thickness range that depends on the doping, being ≈3 nm for the t-LMO and ≈4 nm for the t-LS0.1MO, and saturates beyond a critical thickness tc of the low-doped capping layer. This charge anisotropy is also reflected in the XNLD spectra obtained at the O-K edge, which is sensitive to dipolar transitions from the O-1s to O-2p energy levels (Fig. 6).32–34
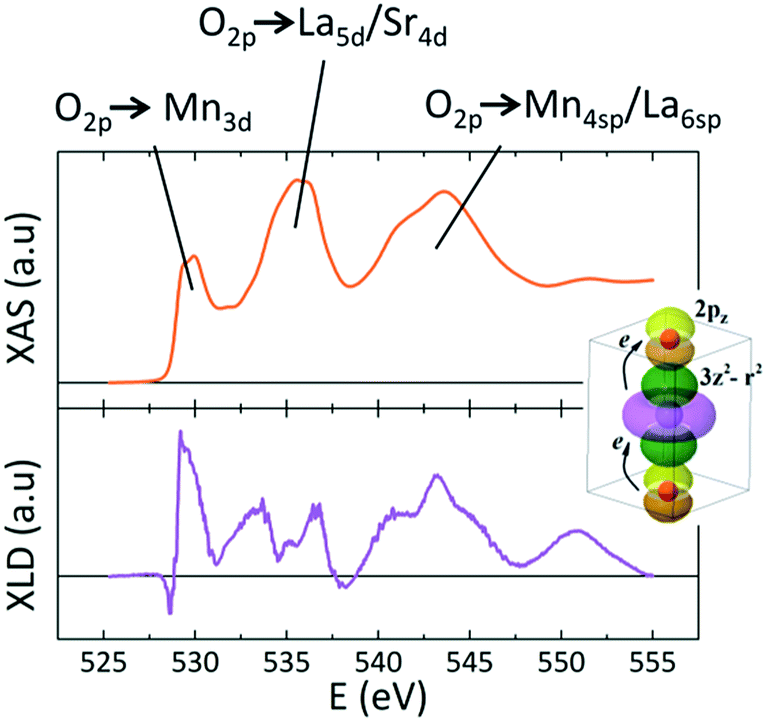 | ||
| Fig. 6 Typical XAS (upper panel) and XLD (lower panel) spectra at the O-K edge for one bilayer of the t-LMO series. The three absorption regions related to the hybridizations O2p → Mn3d, O2p → La5d/Sr4d and O2p → Mn4sp/La6sp are indicated. The cartoon schematizes the orbital hybridization between the 2pz of the apical oxygen ions and the Mn 3z2–r2 orbitals. | ||
The XLD spectra at this edge keeps always positive values for the rest of the bilayers studied, regardless of the capping layer thickness, signaling that the orbital 2pz of the oxygen ion, whose lobes are parallel to the [001] axis, are strongly hybridized to the 3z2–r2 orbitals promoting the higher orbital occupation and electron delocalization along the [001] direction. As is sketched at the inset of Fig. 6, both Mn L-edge as well as O-K edge unveils a clear charge anisotropy in the orbital filling.
In order to assess the spatial evolution of the AF phases when the barrier thickness increases we calculated the area under the XMLD spectra, IAF, as a measure of the AF anisotropy along the [001] axis. In Fig. 7 we plotted the thickness dependence of the IAF(T) calculated between 649.7 eV and 652.7 eV for both sample' series and for T1 and T2. The calculation of IAF(T) in a wider energy range does not change the general trend, probing the robustness of these experimental results.
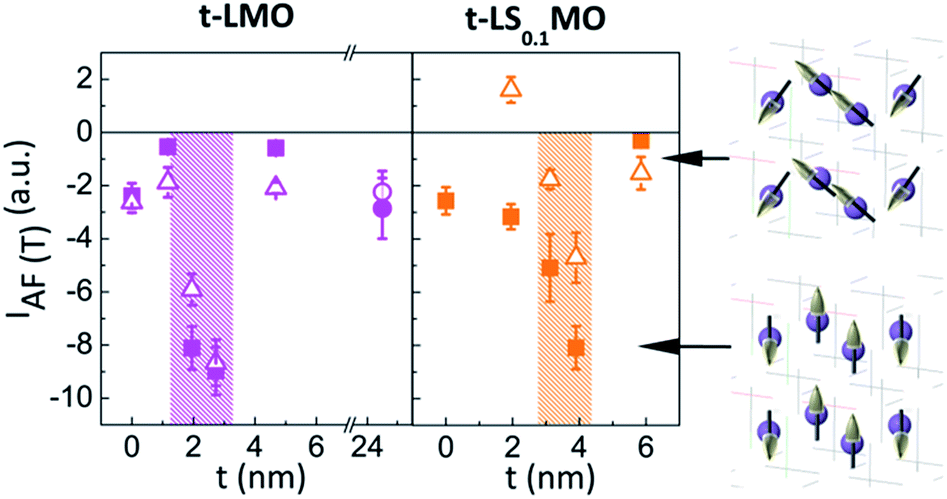 | ||
| Fig. 7 Thickness dependence of IAF for the t-LMO and t-LS0.1MO series, respectively. Measurements at 4 K (filled squares) and at 150 K (t-LMO)/230 K (t-LS0.1MO) (open triangles) are shown. On the right side of the graph, we represented with schemes the orientation of the antiferromagnetic spins proposed for each value of IAF. | ||
Note that IAF present a minimum value at intermediate capping layer thicknesses and takes values closer to zero (although still lower than zero) away from this intermediate thickness range. In terms of the experimental geometry considered here we deduced that the AF spin axis has a strong out of plane (OOP) component at this intermediate thickness, which partially tilts into the sample plane for capping layers thickness different from this critical value.
We should also keep in mind, however, that IAF is mainly negative, meaning that the spin alignment always keeps an OOP component that prevails. Recalling the evolution of the preferential orbital occupation discussed in Fig. 5 and 6, it is important to emphasize that the critical thickness tc where the orbital anisotropy saturates matches with the thickness value where IAF is minimum. Clearly the evolution of the orbital and AF contributions across the LS0.3MO/LSxMO interfaces are intimately related and should be analyzed consistently, based on a single model.
As a first approach, the evolution of the orbital and AF anisotropies can be correlated with the valence changes across the interface. The extra electrons supplied by the low-doped manganites modify gradually the Mn3+/Mn4+ ratio and fill preferentially the out of plane eg orbitals lying at lower energies, due to the broken symmetry induced by the compressive strain. The charge anisotropy in the [001] direction joint with the tetragonal distortion induced by the substrate reinforce the orbital hybridization and the ferromagnetic interaction along this axis and simultaneously the AF coupling within the (001) plane. As a result, the AF axis tilts locally out of sample plane and the charge carriers are delocalized with a preferred orientation.
The existence of the critical thickness, however, may be interpreted using different approaches. First, we need to consider that the probing region of the X-ray beam in TEY mode (∼4 nm) is similar to the capping layer thickness.38 Therefore, we can assume that above this critical thickness the XAS signal is no longer sensitive to the interface LS0.3MO/LSxMO but probes mainly the barrier properties. This argument is consistent with the overall Mn valence profile, which does not show any further modifications once reached the critical barrier thickness tc.16 The out-of-plane orbitals are fully occupied above this critical thickness and the extra electrons begin to fill the in-plane x2–y2 orbitals, which partially disrupts with the OOP anisotropy of the orbital filling and OOP AF spin alignment. The local oxygen octahedral rotations characteristic of the lightly doped manganites39 are expected to increase at the outer layers and may compete with the coherent distortions of the unit cell induced by the substrate, favoring distinct electronic configurations.
Additionally, we found that the orbital and AF anisotropies for the thicker barriers of the t-LMO series are similar to those measured for the LaMnO3 surface. Furthermore, the critical thickness of the t-LMO series (∼3 nm) is lower than the one observed for the t-LS0.1MO series (∼4 nm). This is an expectable result considering that the proportion of eg electrons supplied by the undoped LaMnO3 is larger than those supplied by the low doped La0.9Sr0.1MnO3. Consequently, the critical thickness needed to saturate the OOP orbital occupation should be lower for the t-LMO sample' series.
The local structural distortion of the oxygen octahedral evolves from a tensile strain at the inner layers to a compressively unit cell at the outer layers. However, the anisotropy of the AF spin axis as well as the preferential orbital filling does not show the same trend. This observation gives clear evidence that in systems with a local variation of the electron doping joint with local structural distortions, the final orbital and magnetic configurations results from the interplay between external factors like the strain state and atomic surface termination as well as intrinsic features like the Mn3+/Mn4+ ratio driven by the Sr-doping.
We could also envisage a complementary approach to explain these findings. Following the arguments discussed by D. Pesquera et al.17 and the complex phase diagram of the bulk Sr-doped manganite compounds, the saturation of the preferential orbital occupation above a critical thickness may also be interpreted in terms of local bandwidth changes across the interface. In contrast to the large bandwidth and metallic properties exhibited by the LS0.3MO at the inner layers, the lightly or undoped LSxMO capping layers present narrower bands with electrons more localized. In materials with a reduced electron mobility the effects of strain on the orbital anisotropy and AF phases tends to be reduced as well, which is revealing in the unmodified XNLD and XMLD integrals for the sample with the thicker capping layers.
Complementary to the local magnetic properties, it is important to explore whether these local anisotropy changes at the surface may be reflected on the overall magnetic properties of the films, when magnetic hysteresis cycles are performed. To this end, we measured hysteresis cycles at 4 K with an MPMS-SQUID of both sample' series with the magnetic field oriented in-plane and compared the magnetization reversal process (further details on the magnetic cycles can be found in Fig. S4–S6 of the ESI†). In Fig. 8(a) we plotted the evolution of the coercive field in terms of the capping layers thickness, where it becomes evident that subtle changes in the magnetization reversal arise and the minimum coercive field agrees with the critical thickness discussed before.
 | ||
| Fig. 8 (a) In-plane coercive field vs. thickness for t-LMO and t-LS0.1MO series. (b) Sketch of the physical model based on the magnetic pinning effect. | ||
This result may appear counterintuitive at first because lower in-plane coercive fields are found when larger out of plane AF anisotropy takes place, but a simple model based on magnetic pinning of domains can explain these phenomena.
As sketched in Fig. 8(b), we argue that the in-plane component of the AF order at the surface turns out to be more effective to pin the neighboring LS0.3MO magnetic domains and prevent the reversal of the LS0.3MO magnetization under the application of an external magnetic field. The effects on the overall magnetic behavior are subtle and will depend on the nature and coherence of the AF order over large areas. Still, these findings provide an exciting platform to correlated local and macroscopic properties in manganite thin films.
3. Conclusions
In summary, we found a direct correlation between local AF spin axis and the preferential orbital occupation throughout the interfaces LS0.3MO/LSxMO. The AF anisotropy reaches a maximum value with the spin axis oriented OOP for intermediate barrier thicknesses, giving rise to a strong ferromagnetic interaction along this axis and a large orbital hybridization mediated by the eg (3z2–r2) levels. In addition, we quantified the barrier thickness' range where the electronic reconstruction takes place and found that apart from this critical thickness tc the AF spin axis tilts partially away from the [001] axis. This critical thickness arises from the contribution of the local strain, stabilizing the OOP electronic occupation for an axial expansion of the unit cell and Sr-doping of the capping layers, which determine the amount of extra electrons supplied at the interface. The spatial variation of the AF anisotropy brings subtle change on the overall magnetization reversal process of the LS0.3MO, as revealed from hysteresis cycles.These results provide valuable progresses in the field of strongly correlated oxide interfaces, where the structural, orbital and magnetic degrees of freedom can be tuned locally within a few unit cells.
4. Experimental section
Two series of La0.7Sr0.3MnO3/La1−xSrxMnO3 (x = 0, 0.1) bilayers (refer as LS0.3MO/LSxMO) were grown on (001) SrTiO3 single-crystalline substrates by pulsed laser deposition. The thickness of the LS0.3MO electrode was kept fix at around 22 nm in both samples' series while the capping layer thickness was varied between 1.2 nm ≤ t ≤ 4.7 nm in the LS0.3MO/LaMnO3 series (t-LMO) and 2 nm ≤ t ≤ 6 nm in the LS0.3MO/La0.9Sr0.1MnO3 (t-LS0.1MO) one. In addition, 20 nm-thick LS0.3MO and 25 nm-thick LaMnO3 thin films were grown in similar conditions to use as references. The films thickness and texture were checked by X-ray reflectivity, X-ray diffraction and the overall magnetic properties were checked with a 7 T-SQUID magnetometer. The structural quality of the samples was assessed locally with scanning transmission electron microscopy coupled with a high angle annular dark field detector (STEM-HAADF) in a FEI Titan G2 at 300 keV probe corrected (a CESCOR Cs-probe corrector from CEOS Company) and fitted with a Gatan Energy Filter Tridiem 866 ERS to perform EELS analysis. Element-specific soft X-ray magnetic spectroscopy in total electron yield detection mode was used to probe the magnetic order and orbital occupation throughout the interface between the LS0.3MO electrode and the capping layers. The synchrotron radiation experiments were performed at the electron storage ring of the Helmholtz-Zentrum Berlin (BESSY II) by using the 7 T high-field end station located at the UE46-PGM1 beamline. We performed X-ray absorption spectroscopy (XAS) experiments at the L edge of Mn (630 eV to 670 eV) and at the O K-edge (525 eV to 555 eV).Conflicts of interest
There are no conflicts to declare.Acknowledgements
Authors thanks the financial support of FONCYT PICT 2014-1047, CONICET PIP 112-201501-00213, MINCYT and the European Commission through the Horizon H2020 funding by H2020-MSCA-RISE-2016 – Project No. 734187 – SPICOLOST. The microscopy studies have been conducted in the “Laboratorio de Microscopías Avanzadas” at “Instituto de Nanociencia de Aragón” – Universidad de Zaragoza and we thanks the access of equipments. Authors would like to acknowledge the use of Servicio General de Apoyo a la Investigación-SAI, Universidad de Zaragoza”. Authors also acknowledge Dr Eugen Weschke for fruitful discussions and the possibility to access to the Synchrotron facility at BESSY II.Notes and references
- P. Zubko, S. Gariglio, M. Gabay, P. Ghosez and J.-M. Triscone, Annu. Rev. Condens. Matter Phys., 2011, 2, 141–165 CrossRef CAS
.
- M. Bibes, J. E. Villegas and A. Barthélémy, Adv. Phys., 2011, 60, 5–84 CrossRef CAS
- J. Varignon, L. Vila, A. Barthélémy and M. Bibes, Nat. Phys., 2018, 14, 322–325 Search PubMed
- L. D. Anh, N. Okamoto, M. Seki, H. Tabata, M. Tanaka and S. Ohya, Sci. Rep., 2017, 7, 1–7 Search PubMed
- E. Dagotto, T. Hotta and A. Moreo, Sci. Rep., 2001, 344, 1–153 Search PubMed
- A. Perucchi, L. Baldassarre, A. Nucara, P. Calvani, C. Adamo, D. G. Schlom, P. Orgiani, L. Maritato and S. Lupi, Nano Lett., 2010, 10, 4819–4823 CrossRef CAS PubMed
- E. J. Moon, P. V. Balachandran, B. J. Kirby, D. J. Keavney, R. J. Sichel-Tissot, C. M. Schlepütz, E. Karapetrova, X. M. Cheng, J. M. Rondinelli and S. J. May, Nano Lett., 2010, 14, 2509–2514 CrossRef PubMed
- B. Zhang, L. Wu, W.-G. Yin, C.-J. Sun, P. Yang, T. Venkatesan, J. Chen, Y. Zhu and G. M. Chow, Nano Lett., 2016, 16, 4174–4180 CrossRef CAS PubMed
- Z. H. Xiong, D. Wu, Z. V. Vardeny and J. Shi, Nature, 2004, 427, 821–824 CrossRef CAS PubMed
- M. Bowen, M. Bibes, A. Barthélémy, J.-P. Contour, A. Anane, Y. Lemaître and A. Fert, Appl. Phys. Lett., 2003, 82, 233–235 CrossRef CAS
- M. Huijben, L. W. Martin, Y.-H. Chu, M. B. Holcomb, P. Yu, G. Rijnders, D. H. A. Blank and R. Ramesh, Phys. Rev. B: Condens. Matter Mater. Phys., 2008, 78, 094413 CrossRef
- C. Aruta, G. Ghiringhelli, V. Bisogni, L. Braicovich, N. B. Brookes, A. Tebano and G. Balestrino, Phys. Rev. B: Condens. Matter Mater. Phys., 2009, 80, 014431 CrossRef
- D. Pesquera, G. Herranz, A. Barla, E. Pellegrin, F. Bondino, E. Magnano, F. Sánchez and J. Fontcuberta, Nat. Commun., 2011, 3, 1–7 Search PubMed
- G. Shibata, M. Kitamura, M. Minohara, K. Yoshimatsu, T. Kadono, K. Ishigami, T. Harano, Y. Takahashi, S. Sakamoto, Y. Nonaka, K. Ikeda, Z. Chi, M. Furuse, S. Fuchino, M. Okano, J. ichi Fujihira, A. Uchida, K. Watanabe, H. Fujihira, S. Fujihira, A. Tanaka, H. Kumigashira, T. Koide and A. Fujimori, npj Quantum Mater., 2018, 3, 1–6 CrossRef CAS
- R. Mbatang, D. Xue, E. Enriquez, R. Yuan, H. Han, P. Dowden, Q. Wang, E. Fohtung, D. Xue, T. Lookman, S. J. Pennycook and A. Chen, Nanoscale, 2019, 11, 7364–7370 RSC
- S. J. Carreira, M. H. Aguirre, J. Briatico, E. Weschke and L. B. Steren, Appl. Phys. Lett., 2018, 112, 032401 CrossRef
- D. Pesquera, A. Barla, M. Wojcik, E. Jedryka, F. Bondino, E. Magnano, S. Nappini, D. Gutiérrez, G. Radaelli, G. Herranz, F. Sánchez and J. Fontcuberta, Phys. Rev. Appl., 2016, 6, 034004 CrossRef
- Z. Liao, M. Huijben, Z. Zhong, N. Gauquelin, S. Macke, R. J. Green, S. V. Aert, J. Verbeeck, G. V. Tendeloo, K. Held, G. A. Sawatzky, G. Koster and G. Rijnders, Nat. Mater., 2016, 15, 425–431 CrossRef CAS PubMed
- E. J. Moon, R. Colby, Q. Wang, E. Karapetrova, C. M. Schlepütz, M. R. Fitzsimmons and S. J. May, Nat. Mater., 2014, 5, 1–7 Search PubMed
- A. Tebano, C. Aruta, S. Sanna, P. G. Medaglia, G. Balestrino, A. A. Sidorenko, R. D. Renzi, G. Ghiringhelli, L. Braicovich, V. Bisogni and N. B. Brookes, Phys. Rev. Lett., 2008, 100, 137401 CrossRef CAS PubMed
- J. Garcia-Barriocanal, J. Cezar, F. Bruno, P. Thakur, N. Brookes, C. Utfeld, A. Rivera-Calzada, S. Giblin, J. Taylor, J. Duffy, S. Dugdale, T. Nakamura, K. Kodama, C. Leon, S. Okamoto and J. Santamaria, Nat. Commun., 2010, 1, 1–7 Search PubMed
- C. Aruta, C. Adamo, A. Galdi, P. Orgiani, V. Bisogni, N. B. Brookes, J. C. Cezar, P. Thakur, C. A. Perroni, G. D. Filippis, V. Cataudella, D. G. Schlom, L. Maritato and G. Ghiringhelli, Phys. Rev. B: Condens. Matter Mater. Phys., 2009, 80, 140405(R) CrossRef
- H.-S. Lee and H.-H. Park, Adv. Condens. Matter Phys., 2015, 2015, 1–7 CrossRef CAS
- A.-M. Haghiri-Gosnet and J.-P. Renard, J. Phys. D: Appl. Phys., 2003, 36, R127–R150 CrossRef CAS
- T. Chatterji, F. Fauth, B. Ouladdiaf, P. Mandal and B. Ghosh, Phys. Rev. B: Condens. Matter Mater. Phys., 2003, 68, 052406 CrossRef
- S. Xu, Y. Moritomo, K. Ohoyama and A. Nakamura, J. Phys. Soc. Jpn., 2003, 72, 709–712 CrossRef CAS
- M. J. Hÿtch, E. Snoeck and R. Kilaas, Ultramicroscopy, 1998, 74, 131–146 CrossRef
- M. Abbate, F. M. F. de Groot, J. C. Fuggle, A. Fujimori, O. Strebel, F. Lopez, M. Domke, G. Kaindl, G. A. Sawatzky, M. Takano, Y. Takeda, H. Eisaki and S. Uchida, Phys. Rev. B: Condens. Matter Mater. Phys., 1992, 46, 4511–4519 CrossRef CAS PubMed
- M. Varela, M. P. Oxley, W. Luo, J. Tao, M. Watanabe, A. R. Lupini, S. T. Pantelides and S. J. Pennycook, Phys. Rev. B: Condens. Matter Mater. Phys., 2009, 79, 085117 CrossRef
- S. Valencia, L. Peña, Z. Konstantinovic, L. Balcells, R. Galceran, D. Schmitz, F. Sandiumenge, M. Casanove and B. Martínez, J. Phys.: Condens. Matter, 2014, 26, 166001 CrossRef CAS PubMed
- Y. Liu and X. Ke, J. Phys.: Condens. Matter, 2015, 27, 373003 CrossRef PubMed
- A. Galdi, C. Aruta, P. Orgiani, C. Adamo, V. Bisogni, N. B. Brookes, G. Ghiringhelli, D. G. Schlom, P. Thakur and L. Maritato, Phys. Rev. B: Condens. Matter Mater. Phys., 2012, 85, 125129 CrossRef
- M. Abbate, G. Zampieri, F. Prado, A. Caneiro and A. R. B. de Castro, Solid State Commun., 1999, 111, 437–441 CrossRef CAS
- E. Pellegrin, L. H. Tjeng, F. M. F. de Groot, R. Hesper, G. A. Sawatzky, Y. Moritomo and Y. Tokura, J. Electron Spectrosc. Relat. Phenom., 1997, 86, 115–118 CrossRef
- E. Arenholz, G. van der Laan, F. Yang, N. Kemik, M. D. Biegalski, H. M. Christen and Y. Takamura, Appl. Phys. Lett., 2009, 94, 072503 CrossRef
- C. Aruta, G. Ghiringhelli, A. Tebano, N. G. Boggio, N. B. Brookes, P. G. Medaglia and G. Balestrino, Phys. Rev. B: Condens. Matter Mater. Phys., 2006, 73, 235121 CrossRef
- Y. Tokura and N. Nagaosa, Science, 2000, 288, 462 CrossRef CAS PubMed
- S. Valencia, Z. Konstantinovic, D. Schmitz, A. Gaupp, L. Balcells and B. Martínez, Phys. Rev. B: Condens. Matter Mater. Phys., 2011, 84, 024413 CrossRef
- J. Roqueta, A. Pomar, L. Balcells, C. Frontera, S. Valencia, R. Abrudan, B. Bozzo, Z. Konstantinoviç, J. Santiso and B. Martínez, Cryst. Growth Des., 2015, 15, 5332–5337 CrossRef CAS
Footnote |
| † Electronic supplementary information (ESI) available. See DOI: 10.1039/c9ra06552k |
| This journal is © The Royal Society of Chemistry 2019 |