 Open Access Article
Transition metal oxide@hydroxide assemblies as electrode materials for asymmetric hybrid capacitors with excellent cycling stabilities
Pengfei
Hu
a,
Ying
Liu
a,
Jianrong
Song
a,
Xiufeng
Song
b and
Xiang
Wu
 *a
*a
aSchool of Materials Science and Engineering, Shenyang University of Technology, Shenyang 110870, P. R. China. E-mail: wuxiang05@163.com; wuxiang05@sut.edu.cn
bSchool of Materials Science and Engineering, Nanjing University of Science and Technology, Nanjing, P. R. China
First published on 11th October 2019
Abstract
In this work, three-dimensional cactus-like Co3O4@Ni(OH)2 electrode materials are grown directly on Ni foam via a two-step hydrothermal method. The as-prepared products possess a specific capacitance of 464.5 C g−1 at 0.5 A g−1 and 91.67% capacitance retention after 20![[thin space (1/6-em)]](https://www.rsc.org/images/entities/char_2009.gif) 000 cycles. The as-assembled device using the as-synthesized samples as positive electrodes delivers an energy density of 112.5 W h kg−1 at a power density of 1350 W h kg−1. The superior electrochemical performance of the electrode materials can be attributed to their unique structure, the synergistic effect between Co3O4 and Ni(OH)2 materials and reversible reaction kinetics. It suggests that the products are potential alternatives in future energy storage devices.
000 cycles. The as-assembled device using the as-synthesized samples as positive electrodes delivers an energy density of 112.5 W h kg−1 at a power density of 1350 W h kg−1. The superior electrochemical performance of the electrode materials can be attributed to their unique structure, the synergistic effect between Co3O4 and Ni(OH)2 materials and reversible reaction kinetics. It suggests that the products are potential alternatives in future energy storage devices.
1. Introduction
With the increasing depletion of fossil fuels and serious environmental pollution, to develop and design clean, renewable energy sources and emerging energy storage devices is a very imperious task.1–4 Among them, supercapacitors have attracted increasing attention due to their fast charging-discharging, high power density, long cycle life and environmental friendly characteristics.5–8 Carbon materials and conductive polymers with high specific surface area and low internal resistance have been widely investigated. For example, Fang and co-workers reported hierarchical porous carbon nanorods with a capacitance of 274 F g−1 at 0.5 A g−1.9 Liu et al. prepared MoS2/Ni3S2@PPy samples showing a specific capacitance of 845 C g−1 at 1 A g−1.10 However, poor cycling stability hinders their further application. Therefore, it is urgent to develop novel electrode materials with the desired architectures and properties.As electrode materials, transition metal oxides and hydroxides possess large theoretical capacity and accessible active sites for redox reaction.11–21 Therein Co3O4 materials possess a theoretical capacitance of 3500 F g−1 and tailoring spatial structures.22,23 Many research groups have reported Co3O4 structures as electrode materials with various shapes and structures for capacitors. For instance, Zhang et al. in situ synthesized Co3O4 samples by a facile hydrothermal reaction with a capacitance of 621.8 F g−1 at 1 A g−1.24 Chen and co-worker reported Co3O4 nanorod arrays by chemical bath deposition showing a capacitance of 387.25 F g−1 at 1 A g−1.25 Gao et al. prepared Co3O4 nanowires using a template-free process and obtained a capacitance of 746 F g−1 at 1 A g−1.26 Nevertheless, the practical capacity is far lower than their theoretical one, which limits their future applications in energy storage fields.27,28 Thus, to construct hybrid electrode materials with unique spatial architectures and high capacity is very important.
Two dimensional layered Ni(OH)2 nanostructures enable fast diffusion of electrons, which make active sites for redox reaction easily accessible.29–31 For example, Yang's group reported Ni(OH)2 electrode exhibiting a specific capacitance of 2110 F g−1 at 1 A g−1.32 Xiong et al. synthesized Ni(OH)2 nanosheets with a capacitance of 2384.3 F g−1 at 1 A g−1.33 Dai et al. prepared Ni(OH)2 nanocrystals grown on graphene sheets showing a capacitance of 1335 F g−1 at 1 A g−1.34 Herein, we design a kind of cactus-like Co3O4@Ni(OH)2 structure on Ni foam through a facile two-step hydrothermal approach. The as-prepared products show a specific capacitance of 464.5 C g−1 at 0.5 A g−1 and 91.67% of capacitance retention after 20![[thin space (1/6-em)]](https://www.rsc.org/images/entities/char_2009.gif) 000 cycles. A capacitor is assembled using Co3O4@Ni(OH)2 as positive electrode and active carbon as negative electrode, respectively. It delivers an energy density of 112.5 W h kg−1 at power density of 1350 W kg−1. The excellent performance could be attributed to fast ion transport channel, which constructed by direct contact between two materials and synergistic effect.
000 cycles. A capacitor is assembled using Co3O4@Ni(OH)2 as positive electrode and active carbon as negative electrode, respectively. It delivers an energy density of 112.5 W h kg−1 at power density of 1350 W kg−1. The excellent performance could be attributed to fast ion transport channel, which constructed by direct contact between two materials and synergistic effect.
2. Experimental
All the chemicals in this work are of analytical grade and directly used without further purification. Ni foam was treated, which is similar to our previous report.35 In a typical procedure, 3 mmol Co(NO3)2·6H2O (0.8731 g), 4 mmol NH4F (0.1482 g) and 10 mmol CO(NH2)2 (0.6006 g) were dissolved in 50 mL deionized water and stirred to form a homogeneous solution. Then the above solution was transferred into a 100 mL autoclave and a piece of pretreated Ni foam was immersed into it. The autoclave was sealed and heated at 120 °C for 6 h. After cooling down to room temperature naturally, the Ni foam was taken out and washed with ethanol and deionized water for three times, respectively, to remove possible impurities or excess ions. After that, it was dried at 60 °C for 12 h. Subsequently, the as-prepared samples were obtained by annealing at 350 °C for 2 h. The average mass loading is 2.1 mg cm−2. Then Ni foam coated Co3O4 nanowires were immersed into solution of Ni(NO3)2 and transferred to same volume of autoclave at 120 °C for 8 h. After cooled to room temperature, the as-prepared samples were cleaned and then dried at 60 °C for 12 h. The mass loading is 4.8 mg cm−2.The morphology and crystal structure of as-prepared products were analyzed using an X-ray diffraction analyzer (XRD, Shimadzu 7000, Cu Kα radiation, λ = 0.15406 nm, 40 kV), scanning electron microscope (SEM; Gemini SEM 300-71-31). Element compositions were studied by element mappings. The chemical states of products were recorded by X-ray photoelectron (ESCALAB 250).
Electrochemical performances of the as-synthesized products were investigated on a workstation (Shanghai Chenhua, CHI660E) in a three-electrode system. The samples were used as working electrode, Hg/HgO as reference one and Pt foil as counter one. Cyclic voltammetry (CV), galvanostatic charge-discharge (GCD) and electrochemical impedance spectroscopy (EIS) measurements were conducted in 3 M KOH aqueous electrolyte. Specific capacitance (Cs) was obtained from GCD curves according to following equation:
| Cs = IΔt/m | (1) |
Activated carbon, super p and polyvinylidene difluoride (PVDF) with a mass ratio of 7![[thin space (1/6-em)]](https://www.rsc.org/images/entities/char_2009.gif) :
:![[thin space (1/6-em)]](https://www.rsc.org/images/entities/char_2009.gif) 2
2![[thin space (1/6-em)]](https://www.rsc.org/images/entities/char_2009.gif) :
:![[thin space (1/6-em)]](https://www.rsc.org/images/entities/char_2009.gif) 1 were mixed on Ni foam as negative electrode for supercapacitor. Quasi-solid-state polyvinyl alcohol (PVA)-KOH electrolyte was made by mixing 2 g PVA and 2 g KOH in 20 mL deionized water. The mass loading of active carbon was calculated based on charge balance theory (Q+ = Q−), where Q+ and Q− represents stored charges that can be calculated as follow:
1 were mixed on Ni foam as negative electrode for supercapacitor. Quasi-solid-state polyvinyl alcohol (PVA)-KOH electrolyte was made by mixing 2 g PVA and 2 g KOH in 20 mL deionized water. The mass loading of active carbon was calculated based on charge balance theory (Q+ = Q−), where Q+ and Q− represents stored charges that can be calculated as follow:
| Q = Cs × ΔV × m | (2) |
| m+/m− = Cs− × ΔV−/Cs+ × ΔV+ | (3) |
The optimal mass ratio of Co3O4@Ni(OH)2//AC is 0.45. Energy density E (W h kg−1) and power density P (W kg−1) of the device can be calculated from the equations:
| E = 1/2 × Cs × ΔV2 | (4) |
| P = E × 3600/Δt | (5) |
3. Results and discussion
The phase purity and crystal structure of products are firstly characterized by XRD, as shown in Fig. 1a. All diffraction peaks (black line) of samples located at 19.0° (111), 31.2° (220), 36.8° (311), 38.5° (222), 55.6° (422), 59.3° (511) and 65.2° (440) can be indexed to Co3O4 (JCPDS No.42-1467). The diffraction peaks (red line) at 19.2°, 33.1°, 39.1°, 59.1° and 62.7° correspond to (001), (100), (002), (110), (111) crystal planes, which can be assigned to Ni(OH)2 (JCPDS No.14-0117). From the diffraction peaks (blue line), Co3O4@Ni(OH)2 products are successful prepared.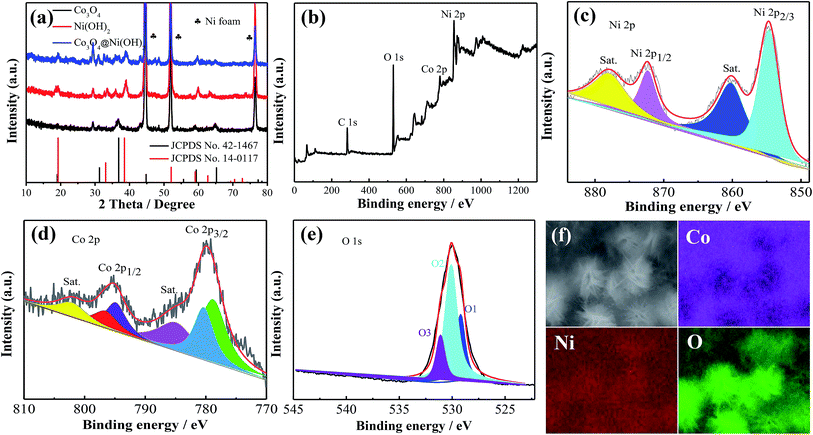 | ||
| Fig. 1 (a) XRD patterns of the products and XPS spectra of Co3O4@Ni(OH)2 sample (b) survey spectra (c) Ni 2p (d) Co 2p (e) O 1s (f) EDS of the composites. | ||
XPS is used to further study elemental composition and chemical states of products. The survey spectra (Fig. 1b) show the presence of Co, Ni and O elements. C is from the base. The de-convolution of Ni 2p XPS spectra in Fig. 1c presents two characteristic peaks of Ni 2p3/2 and Ni 2p1/2 at 855.5 and 873.1 eV and two satellite peaks at 862 and 879 eV, respectively.36Fig. 1d indicates that Co 2p spectra consist of Co2+ and Co3+. It could be de-convoluted into two sharp peaks and two satellite peaks. The peaks at 779.3 and 794.5 eV are related to Co3+ and those at 781 and 796.2 eV might be ascribed to Co2+.37 The peaks of O 1s spectra (Fig. 1e) at 529.7, 531.2 and 532.5 eV are associated with metal–oxygen bond, hydroxyl (OH−) and surface absorbed water, respectively.38 Elemental distributions of products are also investigated by element mappings, demonstrating that elements are uniformly distributed on the Ni foam, as shown in Fig. 1f.
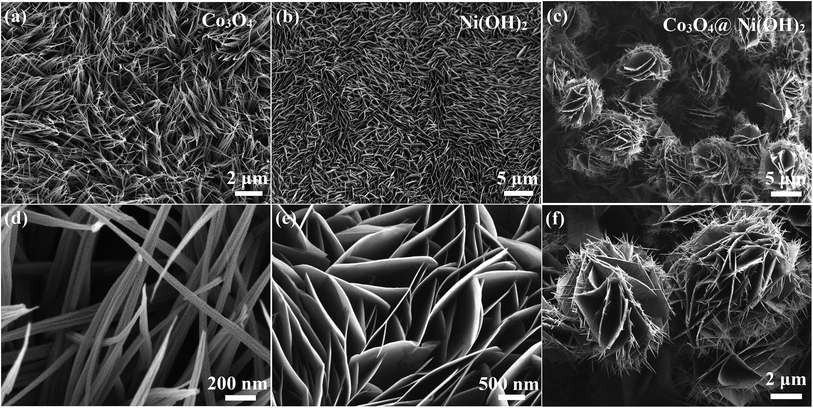
Fig. 2a is SEM images of as-prepared Co3O4 products. It shows that they consist of many nanowires. Further observation (Fig. 2d) finds that the average diameter of the nanowires is 70 nm. Fig. 2b shows SEM images of Ni(OH)2 sample, revealing that dense sheet-like structures appear. Local images can be seen in Fig. 2e. From SEM images shown in Fig. 2(c and f), it is found that hybrid materials consist of many nanowires and nanosheets that interconnect with each other to form unique three-dimensional cactus-like structures.
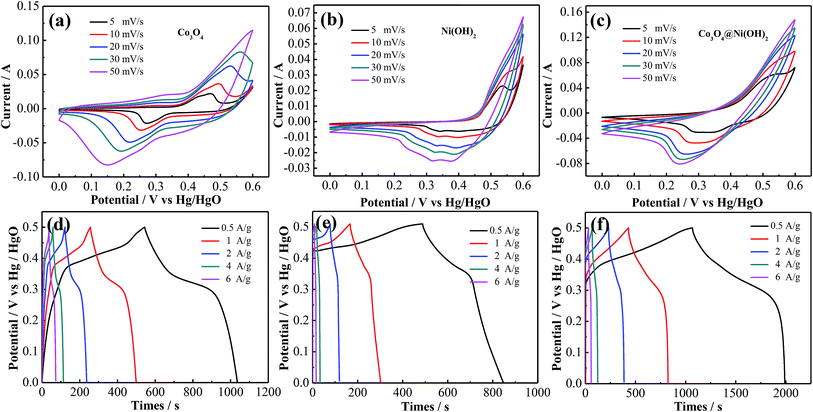
Electrochemical performances of as-synthesized products are studied in 3 M KOH aqueous solution in a three-electrode system. Fig. 3a–c show CV curves of three electrodes at scan rate from 5 to 50 mV s−1. CV curves of composite electrode present a pair of redox peaks, revealing that capacitive behavior of electrode materials. The redox peaks correspond to faradaic redox reactions during charging-discharging process as follows:39,40
| Co3O4 + OH− + H2O ↔ 3CoOOH + e− | (6) |
| CoOOH + OH− ↔ CoO2 + H2O + e− | (7) |
| Ni(OH)2 + OH− ↔ NiOOH + H2O + e− | (8) |
The shapes of CV curves maintains well, indicating excellent reversibility of redox reaction. The corresponding GCD curves of samples are shown in Fig. 3d–f. According to GCD curves of hybrid electrodes at various current densities, specific capacitances are 464.5, 407, 322, 240, and 180 C g−1 at 0.5, 1, 2, 4 and 6 A g−1, respectively.
Fig. 4a shows CV curves of as-synthesized products and pure Ni foam at 20 mV s−1. Obviously, the effect of pure Ni foam on capacities of the samples can be neglected due to its insignificant contribution. It is accordance with previous reports.41 The integrated area of CV curve of Co3O4@Ni(OH)2 samples is relatively larger, suggesting that composite electrode possesses a high capacitance. Fig. 4b shows GCD curves of three electrode materials at the same current density. The discharge time of hybrid electrode is longer than two other samples.
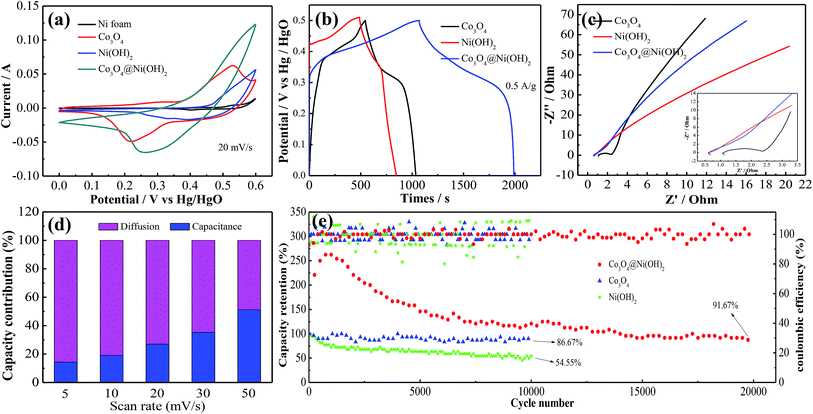 | ||
| Fig. 4 Electrochemical performance of the electrodes (a) CV curves (b) GCD curves (c) Nyquist plots (d) contribution ratio between diffusion and capacitance (e) cycling performance. | ||
To further investigate the conductivity of as-synthesized products, EIS are conducted within frequency range from 0.01 to 105 Hz. Fig. 4c demonstrates Nyquist plots of all samples, which include a semicircle at high frequency region and a straight line at low frequency one. The former represents equivalent series resistance (ESR), the latter corresponds to Warburg resistance. ESR of Co3O4@Ni(OH)2, Co3O4, Ni(OH)2 are 0.74, 0.88, 1.45 ohm cm−2, respectively, suggesting that hybrid electrode possesses a low internal resistance.
To understand surface and diffusion behavior of electrodes, the normalization formulas for CV kinetics analysis are listed as follows:42
| i = avb | (9) |
| i/v1/2 = av1/2 + b | (10) |
![[thin space (1/6-em)]](https://www.rsc.org/images/entities/char_2009.gif) 000 cycles, which is much higher than other two ones. The excellent cycling stability might benefit from synergistic effect between two electrodes. The activation of electrode materials results in the increases of specific capacitance in the initial cycles. With the adding of cycle times, electrode materials are gradually infiltrated by electrolyte, which results in an increase in capacitance.
000 cycles, which is much higher than other two ones. The excellent cycling stability might benefit from synergistic effect between two electrodes. The activation of electrode materials results in the increases of specific capacitance in the initial cycles. With the adding of cycle times, electrode materials are gradually infiltrated by electrolyte, which results in an increase in capacitance.
To estimate its practical application, a hybrid capacitor is assembled using as-prepared products and active carbon as positive and negative electrodes, respectively. CV curves of two electrodes show stable voltage windows between 0 and 0.6 V and between −1 and 0 V, respectively (Fig. 5a). The curves at 50 mV s−1 indicate that the device can work at 1.6 V, as shown in Fig. 5b. CV curves of device at scan rates from 5 to 50 mV s−1 (Fig. 5c) exhibits that it possesses ideal capacitive performance. According to GCD curves at various current densities (Fig. 5d), the device delivers a capacitance of 150 C g−1 at 0.5 A g−1. It keeps 87% of initial capacitance after 6000 cycles in Fig. 5e.
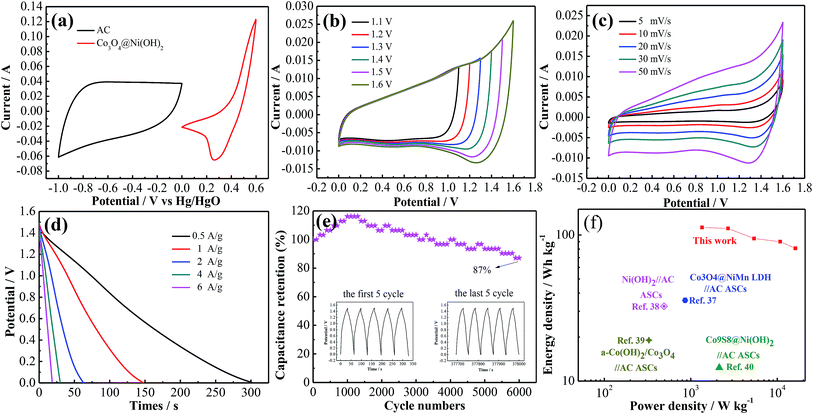 | ||
| Fig. 5 (a) CV curves of Co3O4@Ni(OH)2 and AC electrode at 20 mV s−1 (b and c) CV curves of device (d) GCD curves (e) cycling performance (f) Ragone plot. | ||
Energy density and power density of device are two significant parameters in actual applications. Fig. 5f shows Ragone plots of some devices. The device presents an energy density of 112.5 W h kg−1 at power density of 1350 W kg−1, which are better than some previous reports.40,43–45 According to Table 1, the hybrid electrode materials reported here possess high specific capacitance and excellent cycling stability.23,46–49
| Materials | Specific capacitance (1 A g−1) | Electrolyte | Retention rate | Ref. |
|---|---|---|---|---|
| Co3O4 mesoporous nanoneedle | 668 F g−1 (367.4 C g−1) | 2 M KOH | 104% (10![[thin space (1/6-em)]](https://www.rsc.org/images/entities/char_2009.gif) 000 cycles) 000 cycles) |
23 |
| α-Co(OH)2/Co3O4 flakes | 583 F g−1 (291.5 C g−1) | 2 M KOH | 87.6% (1000 cycles) | 46 |
| Sandwich-like Co3O4/CNTs | 562 F g−1 (252.9 C g−1) | 3 M KOH | 96% (5000 cycles) | 47 |
| 2D MoSe2–Ni(OH)2 nanohybrid | 933 F g−1 (419 C g−1) | 6 M KOH | 91.6% (5000 cycles) | 48 |
| Co3O4 nanosheets | 581 F g−1 (261.4 C g−1) | 2 M KOH | 91% (5000 cycles) | 49 |
| Co3O4@Ni(OH)2 cactus | 407 C g−1 | 3 M KOH | 91.67% (20![[thin space (1/6-em)]](https://www.rsc.org/images/entities/char_2009.gif) 000 cycles) 000 cycles) |
This work |
4. Conclusion
In summary, we have fabricated a kind of cactus-like 3D Co3O4@Ni(OH)2 structure on Ni foam via two-step hydrothermal process. Benefiting from the unique architecture, the as-obtained products possess superior electrochemical performances due to the synergistic effects between two single materials. Moreover, the device presents high energy density and excellent cycling stability. It demonstrates that the hybrid architectures can be used as alternative electrode materials in high-performance energy storage devices.Conflicts of interest
There are no conflicts to declare.Acknowledgements
This project is supported by the Fundamental Research Funds for the Central Universities (No 30919011410).Notes and references
- L. Kouchachvili, W. Yaici and E. Entchev, J. Power Sources, 2018, 473, 237–248 CrossRef.
- C. C. Duan, R. J. Kee, H. Y. Zhu, C. Karakaya, Y. C. Chen, S. Ricote, A. Jarry, E. J. Crumlin, D. Hook and R. Braun, Nature, 2018, 557, 217–222 CrossRef CAS.
- D. Prochowicz, M. M. Tavakoli, S.-H. Turren-Cruz, K. Pandey, M. Saliba and P. Yadav, Sustainable Energy Fuels, 2018, 2, 2407–2411 RSC.
- D. Chen, Z. Lou, K. Jiang and G. Z. Shen, Adv. Funct. Mater., 2018, 28, 1805596 CrossRef.
- Y. Zhou, H. J. Guo, G. C. Yan, Z. X. Wang, X. H. Li, Z. W. Yang, A. X. Zheng and J. X. Wang, Chem. Commun., 2018, 54, 3755–3758 RSC.
- D. P. Zhao, H. Q. Liu and X. Wu, Nano Energy, 2019, 57, 363–370 CrossRef CAS.
- W. H. Zuo, R. Z. Li, C. Zhou, Y. Y. Li, J. L. Xia and J. P. Liu, Adv. Sci., 2017, 4, 1600539 CrossRef.
- X. Wu, Z. C. Han, X. Zheng, S. Y. Yao, X. Yang and T. Y. Zhai, Nano Energy, 2017, 31, 410–417 CrossRef CAS.
- L. Fang, Y. P. Xie, Y. Y. Wang, Z. W. Zhang, P. F. Liu, N. A. Cheng, J. F. Liu, Y. C. Tu, H. B. Zhao and J. J. Zhang, Appl. Surf. Sci., 2019, 464, 479–487 CrossRef CAS.
- Y. Liu, P. F. Hu, J. R. Song, A. Umar and X. Wu, Inorg. Chem. Front., 2019, 6, 2824–2831 RSC.
- K. S. Ashutosh and S. Debasish, J. Mater. Chem. A, 2017, 5, 21715–21725 RSC.
- W. T. Sun, L. Xiao and X. Wu, J. Alloys Compd., 2019, 772, 465–471 CrossRef CAS.
- C. Liu, W. Jiang, F. Hu, X. Wu and D. F. Xue, Inorg. Chem. Front., 2018, 5, 835–843 RSC.
- A. K. Singh, D. Sarkar, K. Karmakar, K. Mandal and G. G. Khan, ACS Appl. Mater. Interfaces, 2016, 8, 20786–20792 CrossRef CAS.
- D. P. Zhao, F. Hu, A. Umar and X. Wu, New J. Chem., 2018, 42, 7399–7406 RSC.
- X. Wu and S. Y. Yao, Nano Energy, 2017, 42, 143–150 CrossRef CAS.
- J. X. Feng, L. X. Ding, S. H. Ye, X. J. He, H. Xu, Y. X. Tong and G. R. Li, Adv. Mater., 2015, 27, 7051–7057 CrossRef CAS.
- W. Jiang, F. Hu, Q. Y. Yan and X. Wu, Inorg. Chem. Front., 2017, 4, 1642–1648 RSC.
- Y. Zhao, M. Z. Dai, D. P. Zhao, L. Xiao, X. Wu and F. Liu, CrystEngComm, 2019, 21, 3349–3355 RSC.
- M. J. Xie, Z. C. Xu, S. Y. Duan, Z. F. Tian, Y. Zhang, K. Xiang, M. Lin, X. F. Guo and W. P. Ding, Nano Res., 2018, 11, 216–224 CrossRef CAS.
- C. Liu and X. Wu, Mater. Res. Bull., 2018, 103, 55–62 CrossRef CAS.
- L. Xing, Y. D. Dong, F. Hu, X. Wu and A. Umar, Dalton Trans., 2018, 47, 5687–5694 RSC.
- G. M. Li, M. Z. Chen, Y. O. Yang, D. Yao, L. Lu, L. Wang, X. F. Xia, W. Lei, S. M. Chen, M. Daniel and Q. L. Hao, Appl. Surf. Sci., 2019, 469, 941–950 CrossRef CAS.
- H. F. Zhang, C. X. Lu, H. Hou, Y. Y. Ma and S. X. Yuan, J. Alloys Compd., 2019, 797, 970–977 CrossRef CAS.
- M. H. Chen, Q. X. Ge, M. L. Qi, X. Q. Liang, F. Wang and Q. G. Chen, Surf. Coat. Technol., 2019, 360, 73–77 CrossRef CAS.
- Y. Gao, S. Chen, D. Cao, G. Wang and J. Yin, J. Power Sources, 2010, 195, 1757–1760 CrossRef CAS.
- Q. Yang, Z. Y. Lu, Z. Chang, W. Zhu, J. Q. Sun, J. F. Liu, X. M. Sun and X. Duan, RSC Adv., 2012, 2, 1663–1668 RSC.
- P. H. Yang and W. J. Mai, Nano Energy, 2014, 8, 274–290 CrossRef CAS.
- G. P. Xiong, P. G. He, D. N. Wang, Q. Q. Zhang, T. F. Chen and T. S. Fisher, Adv. Funct. Mater., 2016, 26, 5460–5470 CrossRef CAS.
- X. Peng, L. L. Peng, C. Z. Wu and Y. Xie, Chem. Soc. Rev., 2014, 43, 3303–3323 RSC.
- B. T. Zhao, L. Zhang, Q. B. Zhang, D. C. Chen, Y. Cheng, X. Deng, Y. Chen, R. Murphy, X. H. Xiong, B. Song, C. P. Wong, M. S. Wang and M. L. Liu, Adv. Energy Mater., 2018, 8, 1702247–1702257 CrossRef.
- F. Y. Liu, X. Chu, H. T. Zhang, B. B. Zhang, H. Su, L. Jin, Z. X. Wang, H. C. Huang and W. Q. Yang, Electrochim. Acta, 2018, 269, 102–110 CrossRef CAS.
- X. H. Xiong, D. Ding, D. C. Chen, G. Waller, Y. F. Bu, Z. X. Wang and M. L. Liu, Nano Energy, 2015, 11, 154–161 CrossRef CAS.
- H. Wang, H. S. Casalongue, Y. Liang and H. Dai, J. Am. Chem. Soc., 2010, 132, 7472–7477 CrossRef CAS.
- Y. Liu, D. P. Zhao, H. Q. Liu, A. Umar and X. Wu, Chin. Chem. Lett., 2019, 30, 1071–1076 CrossRef.
- G. Q. Zu, J. Shen, Z. H. Zhang, B. Zhou, X. D. Wang, G. M. Wu and Y. W. Zhang, RSC Adv., 2017, 7, 10583–10591 RSC.
- F. Y. Ning, M. F. Shao, C. L. Zhang, S. M. Xu, M. Wei and X. Duan, Nano Energy, 2014, 7, 134–142 CrossRef CAS.
- G. M. Li, M. Z. Chen, Y. Ouyang, D. Yao, L. Lu, L. Wang, X. F. Xia, W. Lei, S. M. Chen, M. Daniel and Q. L. Hao, Appl. Surf. Sci., 2019, 469, 941–950 CrossRef CAS.
- P. Oliva, J. Leonardi and J. F. Laurent, J. Power Sources, 1982, 8, 229–255 CrossRef CAS.
- S. H. Yang, Y. Y. Liu, Y. F. Hao, X. P. Yang, A. Goddard III William, X. L. Zhang and B. Q. Cao, Adv. Sci., 2018, 5, 1700659 CrossRef.
- P. F. Hu, D. P. Zhao, H. Q. Liu, K. F. Chen and X. Wu, CrystEngComm, 2019, 21, 1600–1606 RSC.
- D. M. Xu, H. W. Wang, F. Y. Li, Z. C. Guan, R. Wang, B. B. He, Y. S. Gong and X. L. Hu, Adv. Mater. Interfaces, 2019, 6, 1801506 CrossRef.
- W. Quan, Y. Y. Xu, Y. T. Wang, S. C. Meng, D. L. Jiang and M. Chen, Appl. Surf. Sci., 2019, 488, 639–647 CrossRef CAS.
- H. B. Li, M. H. Yu, F. X. Wang, P. Liu, Y. Liang, J. Xiao, C. X. Wang, Y. X. Tong and G. W. Yang, Nat. Commun., 2013, 4, 1894 CrossRef CAS.
- F. F. Zhu, M. Yan, Y. Liu, H. Shen, Y. Lei and W. D. Shi, J. Mater. Chem. A, 2017, 5, 22782–22789 RSC.
- M. J. Jing, Y. C. Yang, Y. R. Zhu, H. S. Hou, Z. B. Wu and X. B. Ji, Electrochim. Acta, 2014, 141, 234–240 CrossRef CAS.
- X. Wang, K. Song, R. Yang, X. Y. Jing and J. Wang, ChemistrySelect, 2019, 4, 3878–3883 CrossRef CAS.
- B. Kirubasankar, P. Palanisamy, S. Arunachalam, V. Murugadoss and S. Angaiah, Chem. Eng. J., 2019, 355, 881–890 CrossRef CAS.
- T. Liu, L. Y. Zhang, W. You and J. G. Yu, Small, 2018, 14, 1702407 CrossRef.
| This journal is © The Royal Society of Chemistry 2019 |

