
 Open Access Article
 This Open Access Article is licensed under a
 Creative Commons Attribution 3.0 Unported Licence
Retracted Article: Synthesis of xanthone derivatives and anti-hepatocellular carcinoma potency evaluation: induced apoptosis
Jie Liu†
a,
Hui Bao†b,
Huailing Wang†a,
Qiang Luob,
Jianhong Zuoc,
Zhigang Liu ab,
Shuqi Qiu*d,
Xizhuo Sun*a and
Xiaoyu Liu*b
ab,
Shuqi Qiu*d,
Xizhuo Sun*a and
Xiaoyu Liu*b
aThe Third Affiliated Hospital of ShenZhen University, Shenzhen 518020, China. E-mail: lzgszuniversity@sina.com; Tel: +86-0755-86671935
bSchool of Medicine, Shenzhen University, Shenzhen 518060, China. E-mail: 2958317364@qq.com; Tel: +86-0755-86671902
cMedical School, University of South China, Hengyang 421001, China
dLonggang ENT Hospital, Shenzhen ENT Institute, Shenzhen 518172, China. E-mail: 386535643@qq.com; Tel: +86-0755-86671912
First published on 9th December 2019
Abstract
Twenty-one xanthone derivatives (XDs) were synthesized by a microwave-assisted technique. Their in vitro inhibition potency against the growth of four cancer cell lines was evaluated. XD-1 ∼ [6,9,10-trihydroxy-3,3-dimethyl-5-(2-methylbut-3-en-2-yl)-3H,7H-pyrano[2,3-c]xanthen-7-one] was confirmed as the most active agent against HepG2 cell line growth with IC50 of 18.6 ± 2.31 μM. Apoptosis analysis indicated different contributions of early/late apoptosis and necrosis to cell death for XD-1. XD-1 arrested HepG2 cells on the G0/G1 phase, as indicated by the decreased expressions of cyclin D and CDK2 and the increased expressions of p21. Western blot implied that XD-1 regulated p53/MDM2 to a better healthier state. Moreover, XD-1-induced cell apoptosis was mitochondrion-mediated, as evidenced by caspase activation and involved the PI3K/AKT/mTOR signaling pathway. All the evidence supports that XD-1 is a significant anti-cancer agent for HCC.
1 Introduction
Primary hepatic cancer is one of the common causes of cancer-related death.1 About 75–85% of patients with primary liver cancer have hepatocellular carcinoma (HCC).2 The incidence of liver cancer in Asian countries, especially in East and Southeast Asia, remains the highest in the world. Nowadays, surgical resection, orthotopic liver transplantation, and local ablative therapies are considered potentially curative for early-stage HCC patients.3 Sorafenib is the only chemotherapy drug approved by the US Food and Drug Administration for first-line treatment of advanced HCC and remains the only drug approved for the systemic treatment of patients with metastatic HCC.4 However, despite advances in tumor treatments, no effective systemic therapy has been established for advanced HCC. The 5 year survival rate for liver cancer after receiving systemic treatment is still poor,5 and severe side effects limit the clinical applications of the chemotherapy agents in advanced HCC treatment.6 In summary, novel, effective therapeutic agents with low toxicity are urgently needed.Benzo[α]pyrene (BaP) is a polycyclic aromatic hydrocarbon (PAH) that represents a large group of environmental pollutants formed and released after the incomplete combustion of organic materials.7 BaP is also involved in the development of HCC.8 The aryl hydrocarbon receptor (AhR) is a ligand-activated transcription factor that is activated by small molecules provided by pollutants, microorganisms, metabolism and the diet.9 Environmental xenobiotic toxic chemicals (2,3,7,8-tetrachlorodibenzo-p-dioxin, etc.) are involved in a variety of cellular processes such as tumorigenesis, embryogenesis, transformation, and inflammation by activating AhR. AhR is translocated from the cytoplasm to the nucleus following ligand binding and results in changes in target gene transcription (e.g., cytochrome P450, Cyp1A1, Cyp1B1, etc.) and immunotoxicological effects.10 AhR plays an essential role in receptor-mediated carcinogenesis. Also, an increased AhR expression has been noted in hepatocellular carcinomas, and the AhR expression is associated with hepatocellular carcinoma progression, suggesting its potential protumorigenic activity. There are also studies that indicate that AhR may promote the HCC process.11,12 HCCs exhibit an increased and hierarchical pattern of the AHR expression as compared to paired tumor-adjacent tissues, and HCC patients with a high AHR expression show a shorter survival time than that with a low AHR expression.12 Activators and high-affinity ligands for AhR (TCDD, Bap, etc.) mediate its toxicity via the activation of AhR, and AHR bHLH domains dimerize to form a four-helical bundle that can bind to distinct DNA motifs, leading to the transcriptional activation of target genes.13 Bap and xanthones are similar in structures to polycyclic heterocycles. Xanthones may function as competitive inhibitors that bind selectively to the Bap-binding site of the AhR bHLH domains.
The phosphatidylinositol-3-kinase PI3K/AKT/mTOR signaling pathway is involved in the control of cell proliferation and has been shown to be constitutively activated in HCC.14 The PI3K–AKT pathway is inappropriately activated in HCC, and there are several therapeutics that target the PI3K–AKT pathway (dual PI3K–mTOR inhibitors, PI3K inhibitors, AKT inhibitors and mTOR complex catalytic site inhibitors) in clinical development for the treatment of cancer.15
Xanthones are a group of structurally diverse compounds that represent an important class of oxygenated three-membered heterocyclic compounds with a dibenzo-γ-pyrone scaffold.16 Xanthones perform a broad range of pharmacological activities (anti-cancer, anti-malarial, anti-microbial, anti-HIV, anti-convulsant, anti-cholinesterase, anti-oxidant, anti-inflammatory) and can provide a remarkable basis for the discovery of new potential drug candidates.17 DMXAA (5,6-dimethylxanthone-4-acetic acid) as a carboxyxanthone derivative has shown its anti-tumor activity against non-small-cell lung cancer. Unfortunately, in some large-scale phase III clinical trials, the combination of DMXAA with other anti-cancer drugs does not necessarily significantly improve efficacy.18 The current study is concerned with how to improve the anti-cancer efficacy of xanthones.
2 Materials and methods
Reagents and solvents were purchased from commercial sources and were used without any further purification. 1H NMR spectra were recorded on a Bruker 300 or 500 MHz spectrometer. Mass spectral analyses were carried out on a Waters Acquity UPLC H-Class liquid chromatography (LC) system (C18 column) connected with a Waters Acquity QDa mass spectrometer (MS) detector by electrospray ionization (ESI). Both the normal and tumor cell lines were acquired from the Cell Bank of the Chinese Academy of Sciences (Shanghai, China). The reagents 3-(4,5-dimethylthiazol-2-yl)-2,5-diphenyltetrazolium bromide (MTT), 5,5′,6,6′-tetrachloro-1,1′,3,3′-tetraethylbenzimidazolyl-carbocyanine iodide (JC-1) and propidium iodide (PI) were supplied by Beyotime (Beyotime Institute of Biotechnology, Jiangsu, China). Dulbecco's Modified Eagle's Medium (DMEM), fetal bovine serum (FBS) and penicillin–streptomycin were purchased from Gibco BRL (Life Technologies, NY, USA). All antibodies were purchased from Cell Signaling Technology, Inc. (Manchester, NH, USA).2.1 Synthesis of the XDs
As outlined in Scheme 1, the condensation of salicylic acids 1a–u with phloroglucinol derivatives 2a–u, respectively, was successfully carried out according to a previous report,16 with some modifications. Anhydrous zinc chloride (ZnCl2) and phosphorus oxychloride (POCl3) were used as both catalyst and solvent, with the assistance of microwave radiation; yields were 60–85%. The resulting solid was purified by HPLC to obtain the desired compound.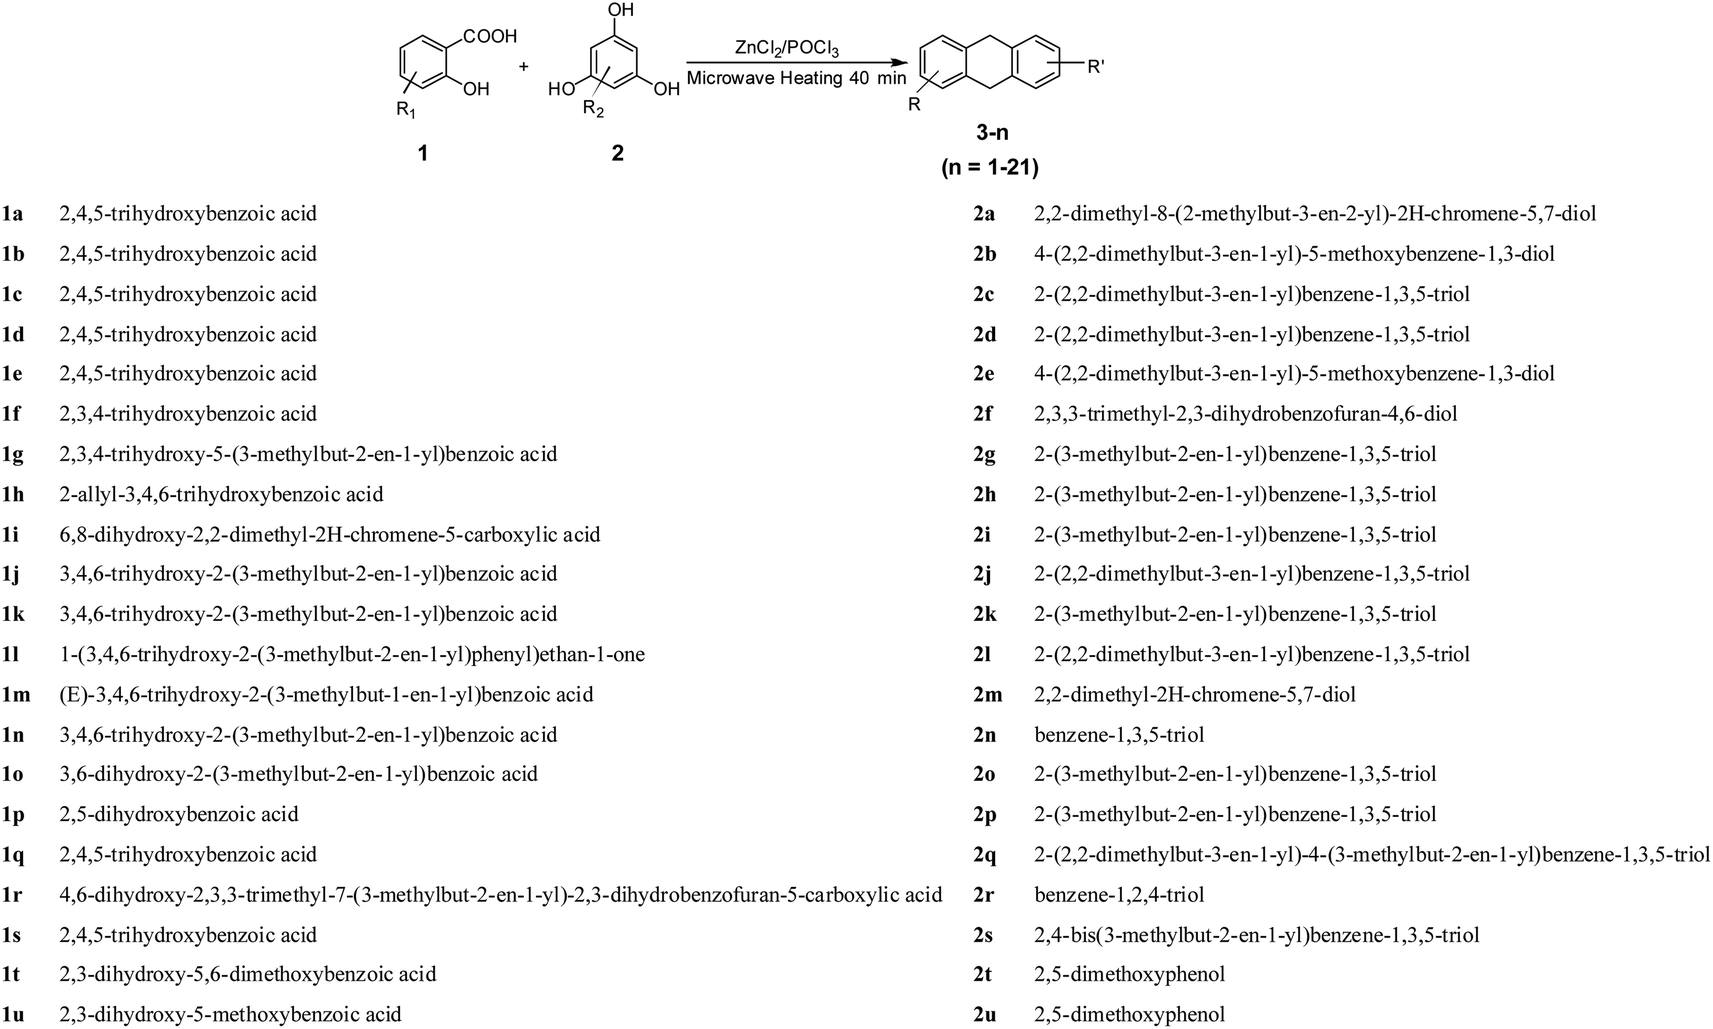 | ||
| Scheme 1 Syntheses of XDs. Conditions and agents: (i) ZnCl2/POCl3, microwave (MW), 40 min; the reaction processes were monitored by Reverse-Phase High-Performance Liquid Chromatography (RP-HPLC). | ||
2.2 Cell culture and cell viability assays
The cancer cells were cultured in an incubator in culture medium with 10% FBS, 100 U mL−1 penicillin, 100 μg mL−1 streptomycin, 2 mM L-glutamine and 5% CO2 in a humidified atmosphere at 37 °C.MTT assay was used to detect the anti-proliferative activity of the XDs. The cancer cells were seeded in 96-well plates and cultured overnight. Different concentrations of XDs were added to each well for 24 h. Next, an MTT solution (5 mg mL−1) was added for an additional 4 h. The absorbance of the converted dye in living cells was measured at 570 nm using a microplate reader (Bio-Rad; Hercules, CA, USA) after the addition of 100 μL DMSO.19 IC50 values were determined by the nonlinear multipurpose curve-fitting program, GraphPad Prism.
2.3 Detection of mitochondrial transmembrane potential (ΔΨm)
HepG2 cells were cultured at 5 × 10⁵ per well in a 6-well plate overnight. Next, they were treated with XD-1 (0, 3.72, 18.6 and 93.0 μM) for 24 h, or 18.6 μM XD-1 for 0, 12, 24, 48 and 60 h. The cells were then collected, washed with cold PBS and incubated with 1 μg mL−1 of JC-1 at 37 °C for 30 min in the dark. The supernatant was removed and the cells were assayed using flow cytometry (BD FACS Calibur, Franklin Lakes, CA, USA).2.4 Apoptosis and cell cycle assays
HepG2 cells were cultured at 5 × 10⁵ per well in a 6-well plate overnight and then exposed to XD-1 (0, 3.72, 18.6 and 93.0 μM) for 24 h. The cells were then collected and incubated with Annexin V-FITC/PI, and the cell status was analyzed using flow cytometry according to the manufacturer's protocol (BD FACS Calibur, Franklin Lakes, CA, USA).After the XD-1 (0, 3.72, 18.6 and 93.0 μM) treatments for 24 h, the cells were collected and fixed in 70% ethanol and stored at −20 °C overnight. Afterwards, the cells were washed with cold PBS and the cell cycle distribution was detected by PI (propidium iodide) staining and analyzed by flow cytometry (BD FACS Calibur; Franklin Lakes, CA, USA).
All the experiments above were performed at least three times.
2.5 Western blot analysis
HepG2 cells (2 × 10⁶ per dish) were cultured in 10.0 cm culture dishes overnight before being incubated with XD-1 for 24 h. Afterwards, the cells were harvested and the total protein was collected and measured with a Bradford protein assay to calculate the quantity of protein. Equal amounts of protein were separated on sodium dodecyl sulfate polyacrylamide gel electrophoresis (SDS-PAGE) and electroblotted onto polyvinylidene difluoride (PVDF) membranes. The immunoblots were blocked with 5% non-fat milk and subsequently incubated with the primary antibody (1:1000) at 4 °C over night, followed by incubation with peroxidase-conjugated second antibody (1:5000) at room temperature for 2 h.18 The protein bands were measured and the β-actin was used as an internal standard for process control. Blot bands densitometry was analyzed with ImageJ software.2.6 Statistical analysis
Data were expressed as means ± SD of three independent experiments. Statistical significance for normally distributed samples was assessed using an independent two-tailed Student's t test or with ANOVA. All analyses were performed with GraphPad Prism version 5.0 software (GraphPad Software, La Jolla, CA). A *p-value < 0.05 was considered statistically significant for all analyses.3 Results
3.1 Synthesis of XDs
The synthesis was conducted according to a procedure described in the literature.16 To a 50 mL flask, 8 mL phosphorus oxychloride (POCl3) and anhydrous zinc chloride (6.8 g, 0.05 mol) were added. The suspension was stirred at 70 °C until ZnCl2 was completely dissolved in POCl3. The mixture was then cooled to room temperature. Afterwards, salicylic acids (1a–u) (1.0 mmol) and phloroglucinol derivatives (2a–u) (1.3 mmol) were added, respectively, and the mixture was heated with a microwave reactor with a programmed procedure of 80 °C for 40 min, where the power was 250 W. The mixture was then cooled to room temperature and placed in ice water with stirring for 30 min. The mixed solution was filtered and washed with cold water. The solid residues were collected and purified by RP-HPLC. The structures and yields are listed in Table 1, and were confirmed by nuclear magnetic resonance (1H NMR) spectroscopy and Liquid Chromatography-Mass Spectrometry (LC-MS) analysis. The colors, LC-MS and 1H NMR spectral data of XDs are given in the following:| Comp. | Structure | Yield (%) | IC50 (μM) | |||
|---|---|---|---|---|---|---|
| HepG2 | Hep3B | SMMC-7721 | Huh7 | |||
| a The MTT assay was carried out to detect the anti-proliferative potency of XDs in the experimental cancer cells. Briefly, after the tumor cells were cultured overnight, the XDs were added and cultured for an additional 24 h, after which the MTT assay was carried out. IC50 values are shown as mean ± standard error of the mean (SD), from at least three independent experiments. | ||||||
| XD-1 | 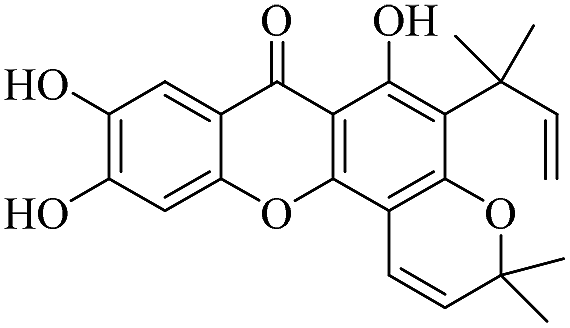 |
63.4 | 18.6 ± 2.31 | 36.5 ± 4.12 | 52.8 ± 6.11 | 69.6 ± 7.15 |
| XD-2 | 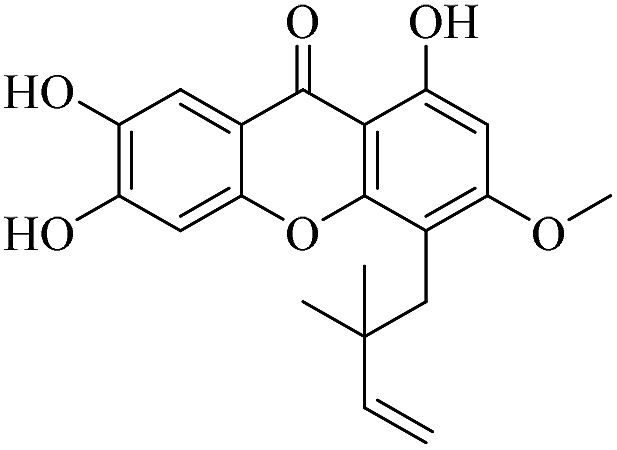 |
71.4 | 82.5 ± 8.66 | 99.8 ± 9.21 | 109 ± 10.3 | 103 ± 10.5 |
| XD-3 |  |
72.3 | 96.5 ± 9.04 | 111 ± 11.7 | 103 ± 10.8 | 138 ± 14.1 |
| XD-4 | 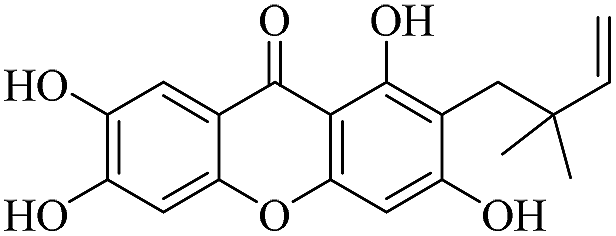 |
63.2 | 99.8 ± 8.04 | 94.6 ± 8.01 | 110 ± 9.21 | 122 ± 11.7 |
| XD-5 | 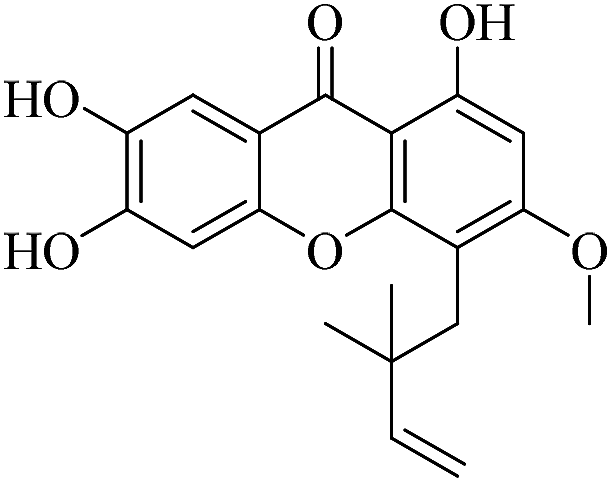 |
63.5 | 86.4 ± 7.51 | 87.2 ± 8.25 | 111 ± 9.94 | 114 ± 11.7 |
| XD-6 | 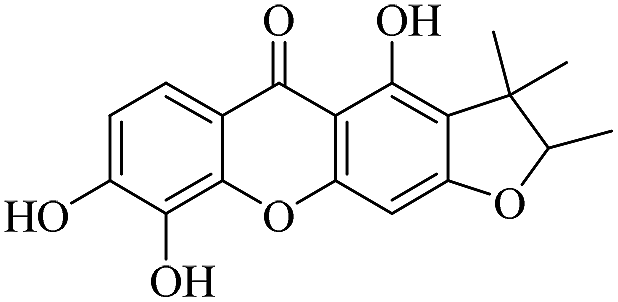 |
62.3 | 32.8 ± 3.94 | 44.5 ± 3.81 | 49.8 ± 5.74 | 67.9 ± 6.44 |
| XD-7 | 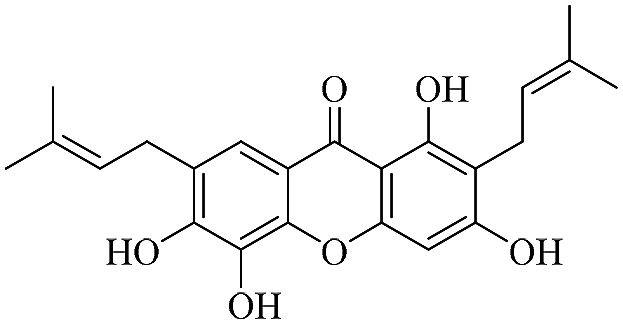 |
61.1 | 72.1 ± 6.87 | 74.8 ± 7.67 | 86.5 ± 8.54 | 89.8 ± 9.03 |
| XD-8 | 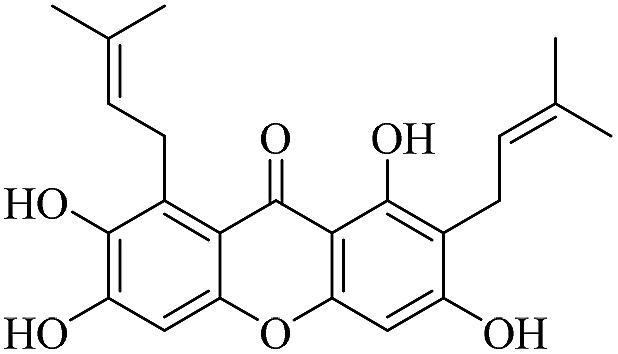 |
65.6 | 72.0 ± 7.36 | 83.2 ± 7.51 | 89.1 ± 12.3 | 105 ± 10.1 |
| XD-9 | 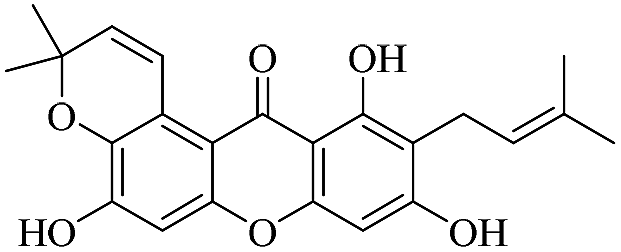 |
68.9 | 30.8 ± 3.26 | 33.2 ± 3.22 | 50.8 ± 5.72 | 65.8 ± 5.88 |
| XD-10 | 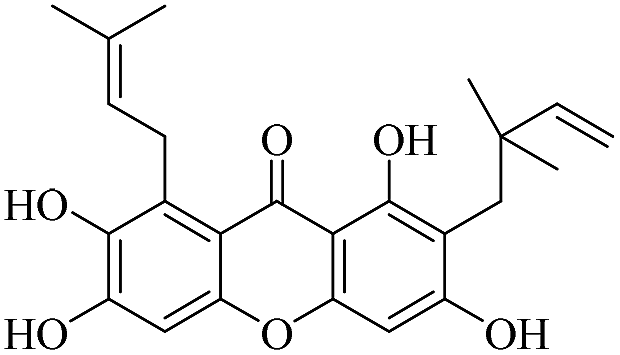 |
69.8 | 67.8 ± 5.58 | 65.6 ± 6.14 | 79.6 ± 6.45 | 91.9 ± 8.57 |
| XD-11 | 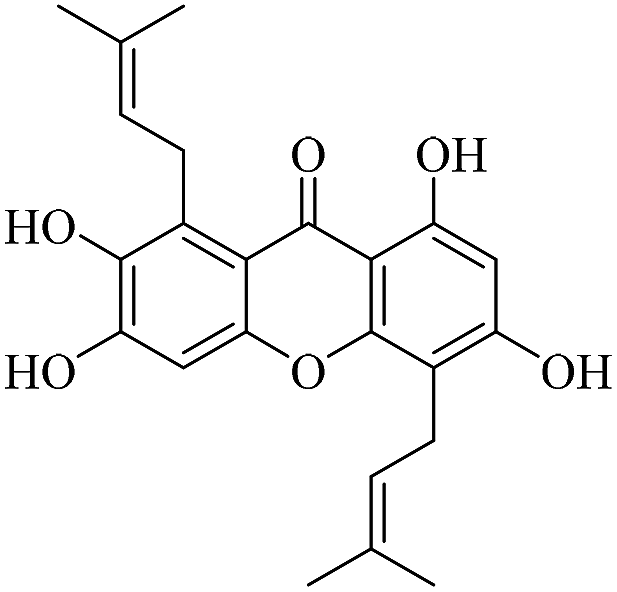 |
70.6 | 73.8 ± 7.70 | 77.5 ± 6.54 | 82.9 ± 8.08 | 101 ± 10.7 |
| XD-12 | 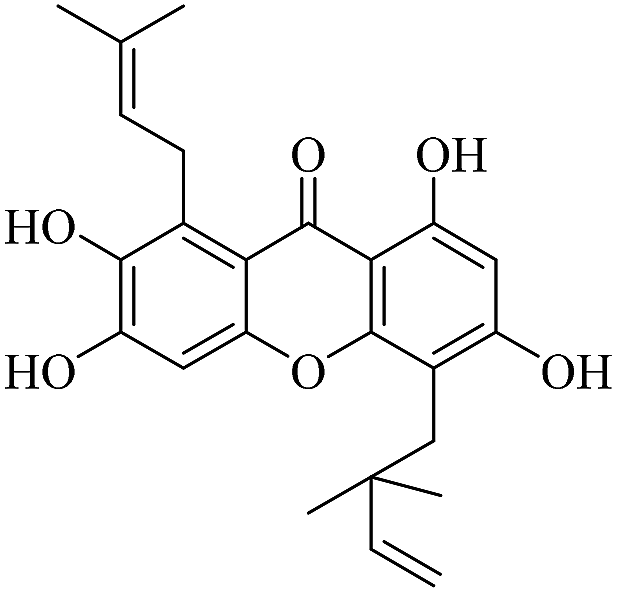 |
68.5 | 62.1 ± 6.88 | 60.3 ± 6.89 | 76.8 ± 8.20 | 82.4 ± 7.78 |
| XD-13 |  |
74.2 | 24.5 ± 3.11 | 33.5 ± 4.05 | 51.7 ± 4.56 | 67.7 ± 5.76 |
| XD-14 |  |
73.4 | 101 ± 13.3 | 132 ± 14.2 | 154 ± 14.5 | 181 ± 19.3 |
| XD-15 |  |
72.3 | 74.8 ± 7.45 | 79.9 ± 7.12 | 84.8 ± 8.25 | 109 ± 11.2 |
| XD-16 | 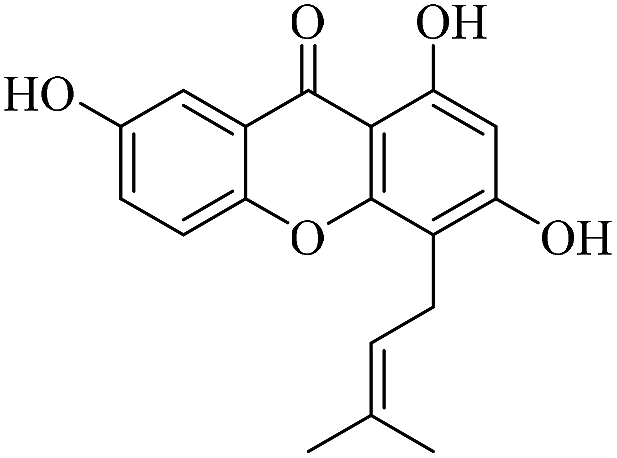 |
76.2 | 130 ± 13.2 | >200 | 178 ± 17.9 | >200 |
| XD-17 | 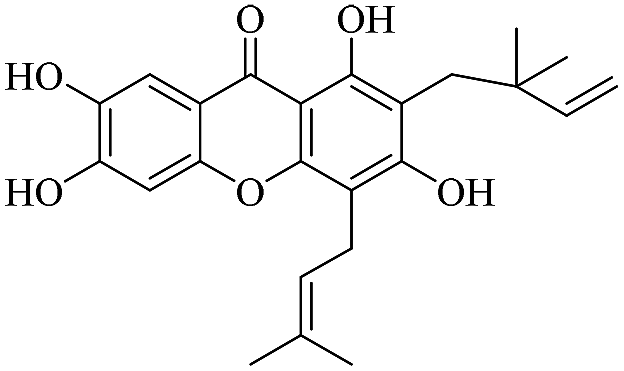 |
71.5 | 64.1 ± 5.57 | 59.8 ± 6.12 | 82.5 ± 7.53 | 107 ± 10.8 |
| XD-18 | 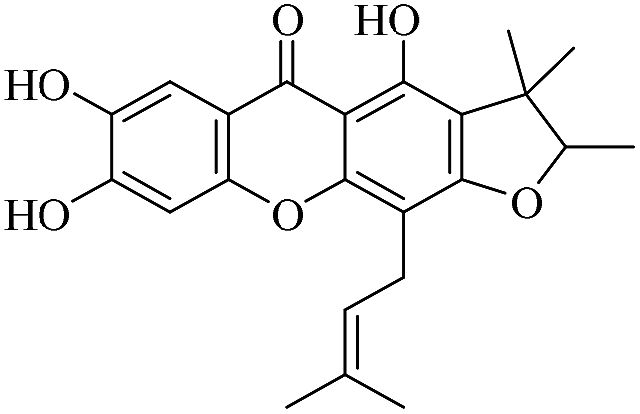 |
70.1 | 36.8 ± 3.44 | 47.6 ± 4.07 | 69.5 ± 7.22 | 81.7 ± 7.82 |
| XD-19 | 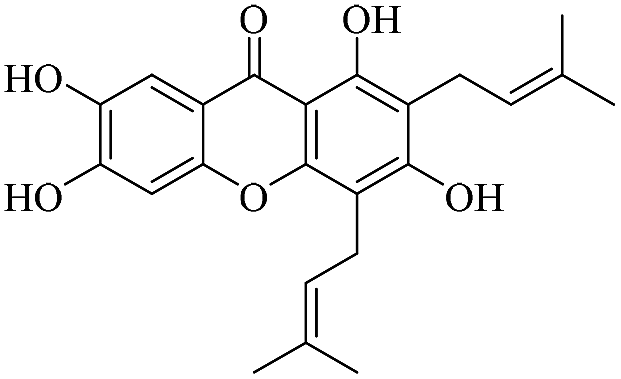 |
62.3 | 51.4 ± 4.55 | 48.1 ± 4.27 | 81.2 ± 6.75 | 79.8 ± 8.24 |
| XD-20 | 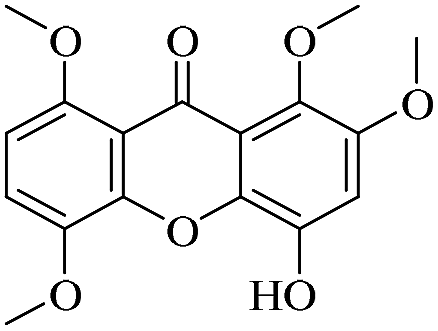 |
81.9 | 171 ± 15.8 | >200 | >200 | >200 |
| XD-21 | 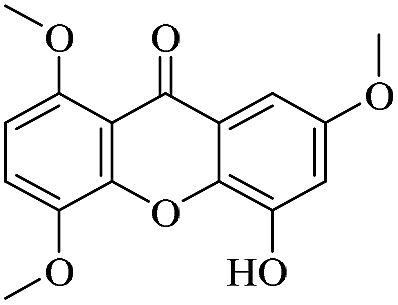 |
83.4 | >200 | 164 ± 15.9 | >200 | >200 |
| Sorafenib | — | — | 16.2 ± 1.66 | 17.8 ± 2.01 | 39.5 ± 2.93 | 6.13 ± 0.55 |
3.2 XDs inhibit growth of hepatic cancer cells in vitro
Finally, twenty-one XDs were synthesized, and the purity was detected by HPLC >97%. The XDs were dissolved in DMSO (8.0 mM) and stored at −20 °C as a stock solution.Liver cancer is a very popular type of cancer and so four liver cancer cell lines were chosen in the current study. MTT assay was applied to determine the effects of XDs on cellular growth inhibition. As shown in Table 1, most of the XDs performed anti-proliferative activity against the four human hepatic cell lines. However, more excitingly, the XDs exhibited significant inhibitory activity enhancement against HepG-2 cells. Interestingly, we found that XDs with 3-methyl-2-butenyl groups (XD-7, XD-8 and XD-11) exhibited significant inhibitory activity enhancement against HepG-2 cells. Further, when 1,3-dihydroxy and 3-methyl-2-butenyl formed a cyclic conjugate system (XD-1, XD-9 and XD-13) apparently enhanced the inhibitory activity. More excitingly, XD-1 potently inhibited the growth of HepG2, Hep3B, SMMC-7721 and Huh7 cells, with IC50 values of 18.6 ± 2.31 μM, 36.5 ± 4.12 μM, 52.8 ± 6.11 μM and 69.6 ± 7.15 μM, respectively.
The current evidence supports that the XD-1 is promising for use in anticancer therapy and therefore, cytotoxicity against normal cell lines from healthy tissues had to be evaluated; the inhibition against the growth of normal cell lines was determined. The testing method is the same as that applied to the cancer cell line. The cytotoxicity of XD-1 in the human liver cell line HL-7702 was at a much higher level as compared to the tumor cell lines, in which the IC50 value was 6.53 ± 0.68 mM to HL-7702 cells. Of note, the cytotoxicity of XD-1 in normal cells was much lower as compared to the tumor cell lines. XD-1 was indicated as significantly enhancing the anti-proliferative activity in HepG2 cancer cells, together with the fact that HCC is one of the most common malignancies. This is the reason we chose HepG2 cells to explore the anti-proliferative potency.
3.3 XD-1 induces caspase-dependent apoptosis
Necrosis is a form of traumatic cell death that results from acute cellular injury, while apoptosis is a highly regulated and controlled process that confers advantages during an organism's lifecycle. Unlike necrosis, apoptosis is a form of programmed cell death that occurs in cellular organisms whose biochemical events lead to characteristic cell morphological changes including cell shrinkage, nuclear fragmentation and chromatin condensation.16 Here, apoptosis was explored and the results are listed in Fig. 1A. Interestingly, XD-1 increased the cell apoptosis from 7.53% to 11.5%, 27.5% and 81.6%, respectively.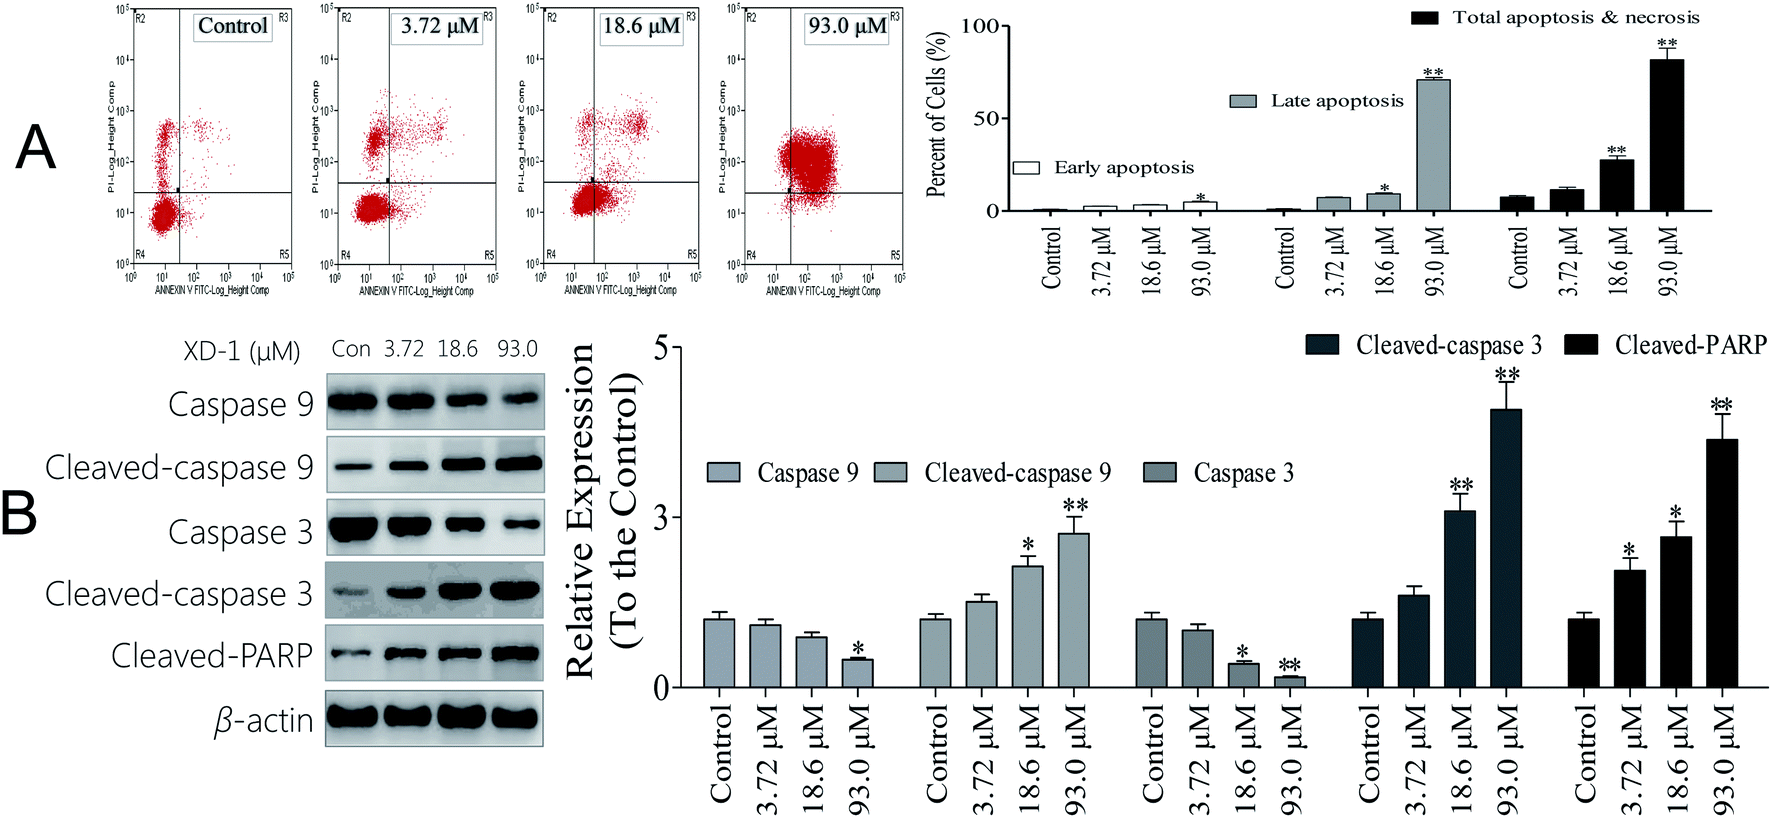 | ||
| Fig. 1 XD-1 induces caspase-dependent apoptosis in HepG2 cells. Representative scatter diagrams. (A) Flow cytometric analysis of XD-1-induced apoptosis in HepG2 cells using Annexin V-FITC/PI staining. Cells in the lower right quadrant (Annexin V+/PI−) represent early apoptotic cells, and those in the upper right quadrant (Annexin V+/PI+) represent late apoptotic cells. (B) XD-1 activates caspase cleavage. Equal amounts of whole-cell extracts were separated by 10% SDS-PAGE, electrotransferred onto PVDF membranes, and analyzed by western blotting. β-Actin was used as a loading control. The data are expressed as the mean ± SD of triple independent experiments. Compared with the control group, *p < 0.05, **p < 0.01. Blots were quantified using ImageJ software. | ||
Caspase activation is considered as a significant hallmark of apoptosis, so we checked whether caspase activation is involved in XD-1 induced apoptosis, and the results are shown in Fig. 1B. The cleaved caspase-9, cleaved caspase-3 and cleaved PARP expressions were significantly up-regulated after the XD-1-treatments. Meanwhile, the expressions of caspase-9 and caspase-3 were strongly attenuated in XD-1-treated cells. Caspase-3 is known to be involved in the apoptotic process, where it is responsible for chromatin condensation and DNA fragmentation. Caspase-9 is an initiator caspase. The initiated caspase-9 will go on to cleave procaspase-3 and procaspase-7. On the other hand, PARP is a family of proteins involved in a number of cellular processes entailing mainly DNA repair and programmed cell death. When PARP is cleaved by enzymes such as caspases or cathepsins, typically the function of PARP is inactivated.20 Therefore, the data support that XD-1 induces cell apoptosis via the adjustment of caspase 3, caspase 9, and PARP, which closely participate in programmed cell death.
3.4 XD-1 induces cell cycle arrest by regulating cell cycle regulatory proteins
To establish whether XD-1 inhibited cell growth by interrupting the cell cycle progress, cellular DNA was analyzed and stained with propidium iodide (PI). The cells were analyzed using flow cytometry. The profiles are shown in Fig. 2A. Obviously, compared with the control group, an increase in the G0/G1 population was observed in HepG-2 cells after the XD-1 treatments. XD-1 blocked the G0/G1 cells from 50.1% (control group) to 54.8%, 59.1% and 70.1%, respectively. To investigate the molecular basis by which XD-1 inhibited the G0/G1 transition in HepG2 cells, we also evaluated the expression of proteins involved in cell cycle regulation, and the results are listed in Fig. 2B. We found that XD-1 suppressed cyclin D and CDK2 expressions and increased the p21 expression in HepG2 cells. This suggests that the cell cycle arrest is one of the primary mechanisms responsible for the anticancer activities of XD-1.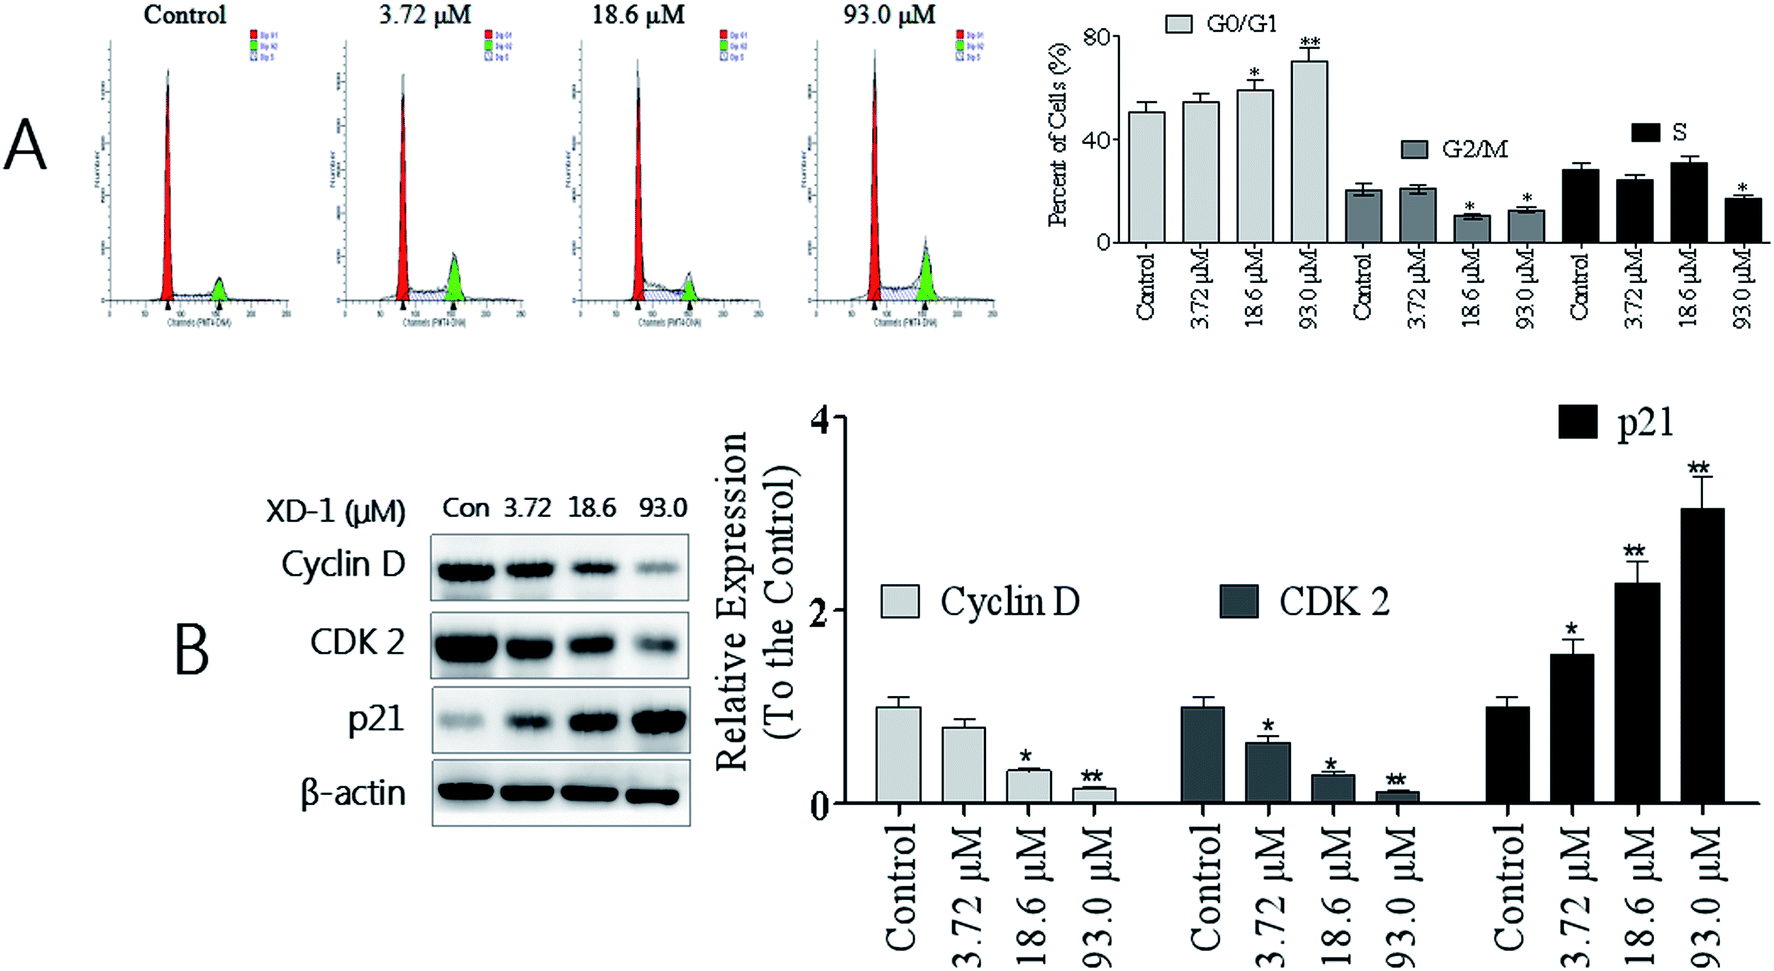 | ||
| Fig. 2 XD-1 induces G0/G1 cell cycle arrest in HepG2 cells. (A) Cell cycle profiles were measured by flow cytometry following XD-1 treatments for 24 h. (B) HepG2 cells were treated with XD-1 as experimental design. Western blotting was performed to detect p21, cyclin D and CDK2. β-Actin was used as a loading control. The data are expressed as the mean ± SD of triple independent experiments. Compared with the control group, *p < 0.05, **p < 0.01. Blots were quantified using ImageJ software. | ||
3.5 XD-1 induces apoptosis through mitochondrial pathways
The mitochondrion-dependent pathway is one of the most common apoptotic pathways in tumor cells.20 To investigate the mechanism underlying XD-1-induced HepG2 cell apoptosis, we detected the decline of mitochondrial transmembrane potential (ΔΨm) and the results are shown in Fig. 3A. After XD-1 treatments for 24 h, the cells with ΔΨm decline increased from 4.21% (control group) to 6.51%, 19.6% and 36.2%, suggesting that XD-1 induced ΔΨm decline in HepG2 cells in a concentration-dependent manner. Further, XD-1 also induced a ΔΨm collapse in a time-dependent manner (Fig. 3A).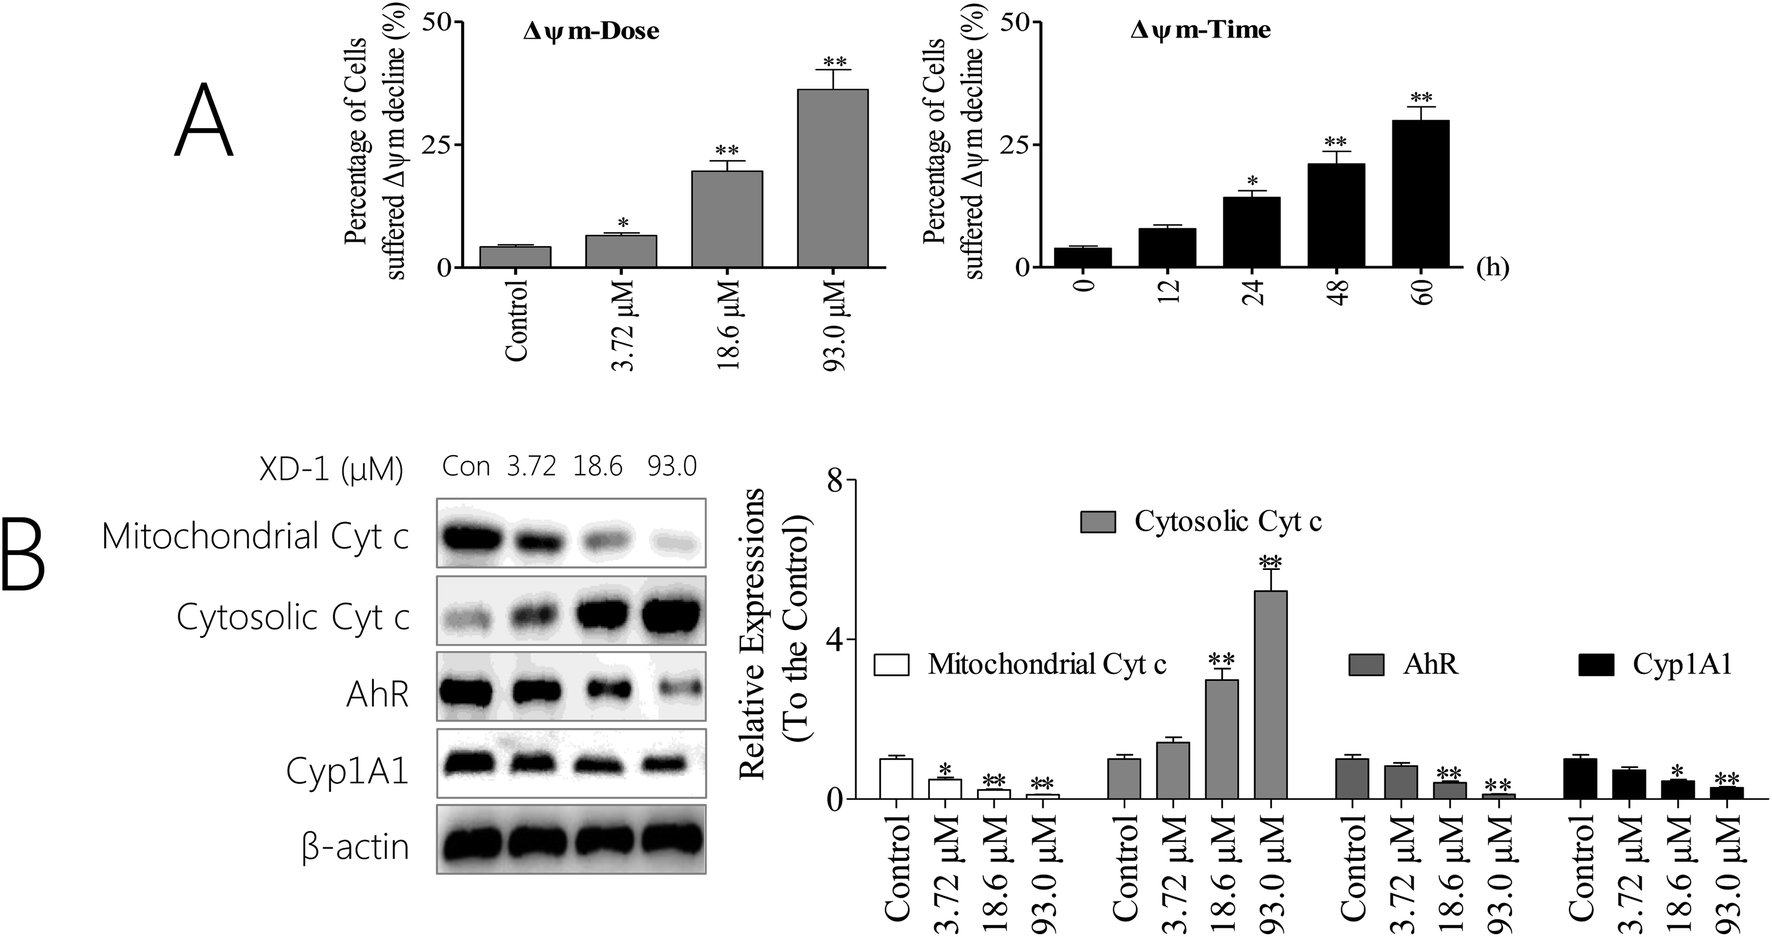 | ||
| Fig. 3 XD-1 induces apoptosis via the mitochondrial pathway. (A) XD-1 induces mitochondrial potential decline. After the XD-1 treatments, the cells were stained with JC-1 for 15 min and analyzed by flow cytometry. (B) HepG2 cells were treated with XD-1. Western blotting was performed to detect cytosolic and mitochondrial levels of the pro-apoptotic proteins Cyt c, Cyp1A1 and AhR. The data are expressed as the mean ± SD of triple independent experiments. Compared with the control group, *p < 0.05, **p < 0.01. Blots were quantified using ImageJ software. | ||
Mitochondrial dysfunction, as indicated by the dissipation of ΔΨm, could subsequently cause the release of cytochrome c (Cyt c) from mitochondria into the cytosol.21 Hence, we detected the cytosolic and mitochondrial Cyt c levels by western blotting. The results showed that XD-1 treatments caused a striking increase in cytosolic Cyt c and a decrease in mitochondrial Cyt c as compared with the control groups (Fig. 3B). Further, we investigated the expressions of AhR and its major downstream Cyp1A1. The results also revealed that the expressions of AhR and Cyp1A1 were significantly attenuated (Fig. 3B).
3.6 XD-1 regulates the p53/MDM2 status and inhibits PI3K/AKT/mTOR in HepG2 cells
p53 is a tumor suppressor that plays a pivotal role in inducing cell cycle arrest, DNA repair, senescence, and apoptosis. MDM2 (murine double minute 2) is the main endogenous negative regulator of p53. This oncoprotein, MDM2, binds p53 and negatively regulates p53 activity by the direct inhibition of p53 transcriptional activity and the enhancement of p53 degradation via the ubiquitin proteasome pathway.22 An appealing therapeutic strategy for many wild-type p53 tumors with over-expressed MDM2 is to restore p53 activity via inhibiting the p53/MDM2 interaction.23 As such, we were interested in whether the XD-1 can regulate the p53/MDM2 interaction. As expected, XD-1 up-regulated p53 expression; however, it attenuated MDM2 expression (Fig. 4A). Treatment with 93.0 μM XD-1 increased the p53/MDM2 ratio from 0.08 (control group) to 15.9. This positive effect might be the key mechanism of how XD-1 induces cancer cell death. It might be concluded, based on this evidence, that the regulation of p53/MDM2 to a better, healthier state is probably the main function of the XD-1.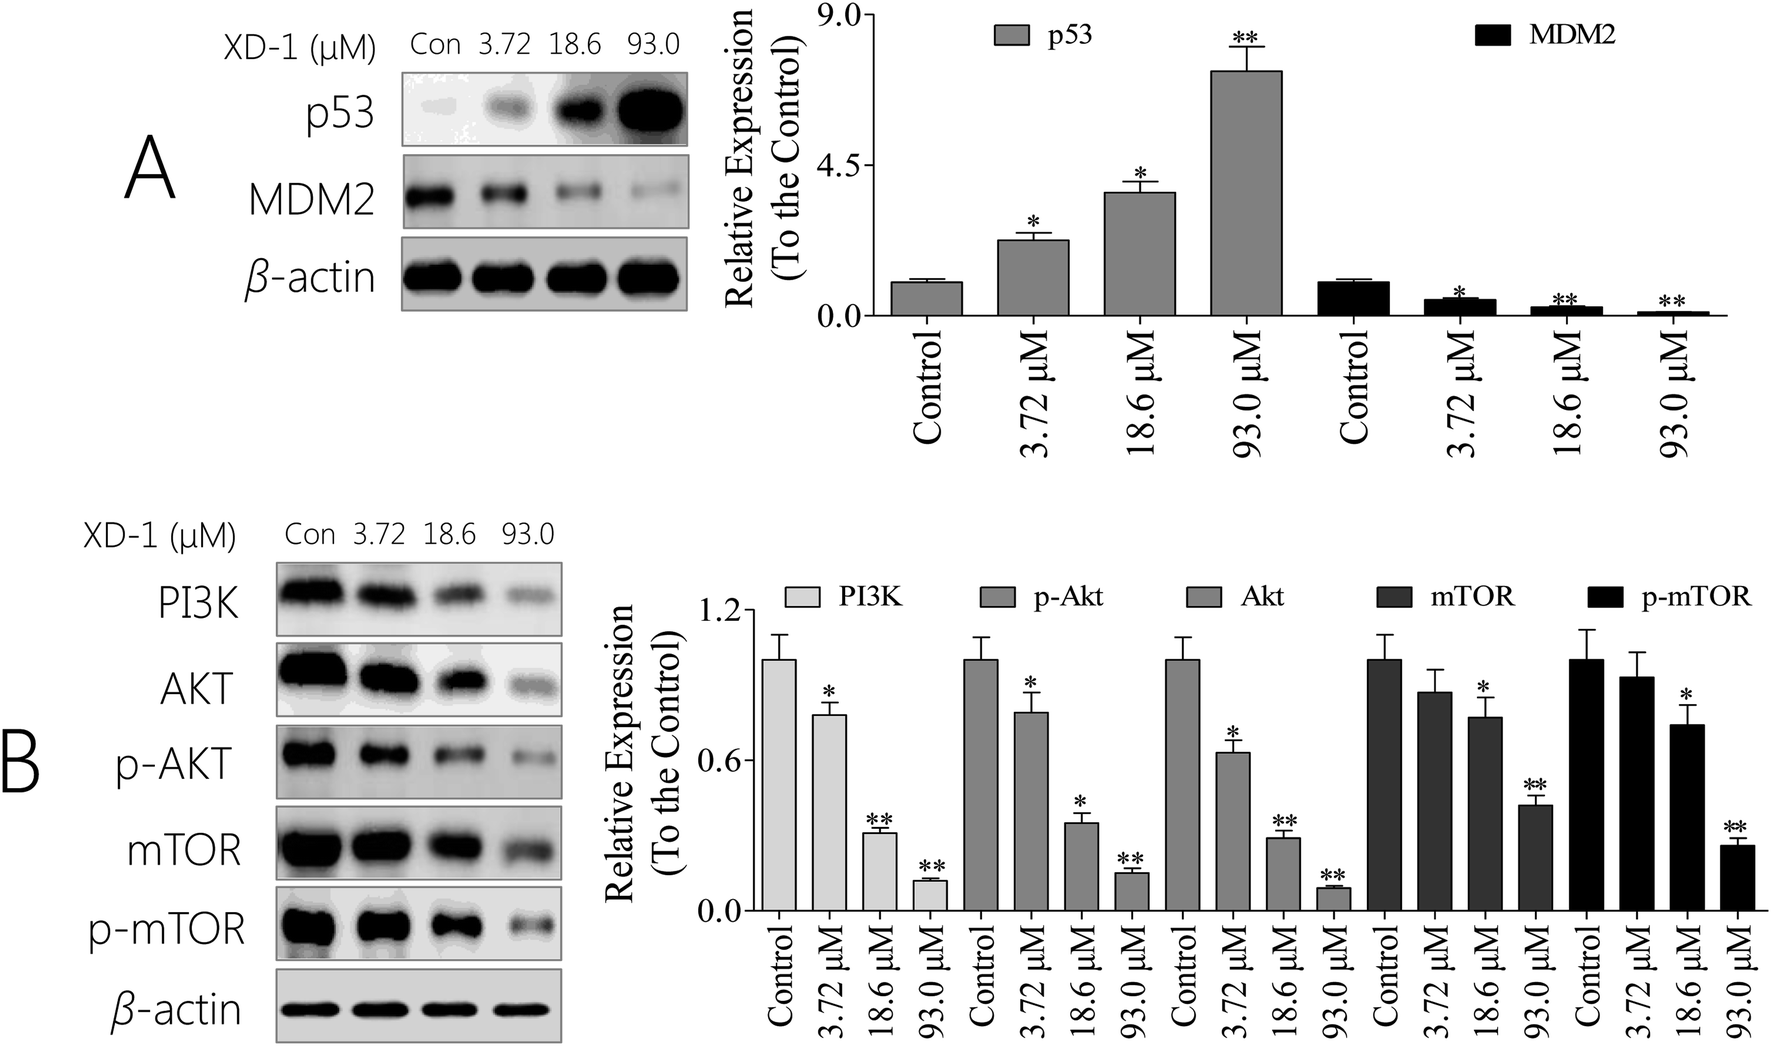 | ||
| Fig. 4 XD-1 induces apoptosis through PI3K/AKT/mTOR and regulates the p53/MDM2 state. (A) Total cell lysates were prepared and subjected to SDS-PAGE followed by western blot analysis to measure the protein levels of p53 and of MDM2. (B) Total cell lysates were prepared and subjected to SDS-PAGE followed by western blotting analysis to measure the protein levels. β-Actin was used as the protein loading control. The data are expressed as the mean ± SD of 3 independent experiments. Compared with the control group, *p < 0.05, **p < 0.01. Blots were quantified using ImageJ software. | ||
Given the pivotal role of the PI3K/AKT/mTOR pathway in controlling cell apoptosis, we explored whether XD-1 inhibits the PI3K/AKT/mTOR pathway. Of interest, XD-1 treatments down-regulated the expression of PI3K, AKT, p-AKT, mTOR and p-mTOR in a concentration-dependent manner (Fig. 4B). Of note, the PI3K/AKT/mTOR pathway also plays a pivotal role in XD-1-mediated cell apoptosis.
4 Discussion and conclusion
Because liver cancer is a very popular cancer type, the biological screening was focused on this field. The interesting scaffold and pharmacological importance of xanthones have been intriguing scientists, leading to the search for novel xanthones. For example, DMXAA, a low-molecular-weight xanthone derivative (XD), has a striking anti-vascular and in some cases curative effect in experimental cancer. Its action on vascular endothelial cells seems to involve a cascade of events leading to the induction of haemorrhagic tumour necrosis. Further, a xanthone derivative, 7-bromo-1,3-dihydroxy-9H-xanthen-9-one demonstrated the most potent inhibitory activity against MDA-MB-231 cells by caspase activation and P53/MDM2 state regulation.16,24 The primary results showed that XD-1 significantly suppressed the growth of HepG2 cells. As shown in Table 1, XD-1 was the most active compound against HepG2 cancer cells with an IC50 value of 18.6 ± 2.31 μM.It is known that the deregulation of cell cycle progression is a common feature of tumors; therefore, targeting the regulatory components of the cell cycle machinery has been proposed as an important strategy for human malignancies.25 We found that XD-1-mediated G0/G1 cell cycle arrest contributed to the inhibition of proliferation in HepG2 cells. The cell cycle is regulated by multifaceted proteins that primarily include two classes of molecules: the cyclin-dependent kinases (CDKs), and the cyclin binding partners.26 Cyclin D and cyclin E (along with CDK2, and CDK6) play pivotal roles in the G0/G1 phase of the cell cycle.27 Of interest, XD-1 induced cell cycle arrest by down-regulating the expressions of cyclin D and CDK2, suggesting that these proteins are involved in cell cycle progression in HepG2 cells. The p21 and p27 are potent cyclin-dependent kinase inhibitors that bind to and inhibit the activities of CDKs; thus, increased levels of these proteins indicate the induction of G0/G1 cell cycle arrest.28 As expected, the p21 expression was increased in XD-1 treated HepG2 cells, indicating that XD-1 is related to p21-dependent cell cycle arrest. It is worth noting that these results indicate that XD-1 modulates G0/G1 phase proteins, resulting in the arrest of HepG2 cells.
Caspase activation is usually accompanied by the activation of PARP, which indicates the activation of the DNA repair mechanism. Mitochondria play an essential role in cell death signal transduction.29 The XD-1 induced activation of caspases in HepG2 cells suggests that mitochondria are responsible for the apoptotic potential of XD-1. Mitochondrial involvement was confirmed by the decline in the ΔΨm in XD-1-treated HepG2 cells. Mitochondrial involvement was further confirmed by the mitochondrial Cyt c expression in the decrease in HepG2 cells.
Increasing evidence indicates that the cross-talk between autophagy and apoptosis is made especially complicated by the fact that they share many common regulatory molecules, such as p53 and the PI3K/AKT/mTOR signaling pathway. It is well known that the PI3K/AKT/mTOR pathway plays an important role in cell growth, survival, differentiation and metabolism.30 Inhibition of the PI3K/AKT/mTOR signaling pathway causes cell death associated with apoptosis and/or autophagy.31 We demonstrated that the treatment of HepG2 cells with XD-1 resulted in the inhibition of the PI3K/AKT/mTOR signaling pathway, so we inferred that XD-1-induced apoptosis may be attributed to PI3K/AKT/mTOR signaling pathway inactivation.
In conclusion, we revealed that XD-1 induced HepG2 cell apoptosis through the caspase-dependent mitochondrial pathway and cell cycle block by regulating G0/G1 checkpoint proteins. Additionally, XD-1 induced caspase-dependent apoptosis in part by inhibiting the PI3K/AKT/mTOR signaling pathway. We also found that XD-1 significantly regulated the status of p53/MDM2. However, further studies are required to identify the specific molecular targets and the signaling pathways by XD-1 treatment. In addition, whether XD-1 exhibits similar effects on other cellular systems still remains to be further investigated. Nevertheless, our results shed some light on the mechanisms behind the effect of XD-1 on HCC and suggest that XD-1 could be a potential candidate for the development of novel treatment strategies for HCC.
Conflicts of interest
The authors declare that they have no conflicts of interest concerning.Acknowledgements
We thank Professor Chen for technical assistance as well as critical editing of the manuscript. The present study was supported by grants of Shenzhen Science and Technology Peacock Team Project: No. KQTD201703311453160; Basic Research Subject Layout Project of Shenzhen Science and Technology Plan: No. JCYJ20160328144536436; Basic Research Projects of Shenzhen Science and Technology Plan: No. JCYJ 20160429114659119, JCYJ 20170307162947583 and JCYJ 201703071636362.References
- Y. Yu, M. Pei and L. Li, Baicalin induces apoptosis in hepatic cancer cells in vitro and suppresses tumor growth in vivo, Int. J. Clin. Exp. Med., 2015, 8(6), 8958 CAS.
- N. Taura, et al., Relationship of α-fetoprotein levels and development of hepatocellular carcinoma in hepatitis C patients with liver cirrhosis, Exp. Ther. Med., 2012, 4(6), 972–976 CrossRef CAS.
- J. H. Kao and D. S. Chen, Changing disease burden of hepatocellular carcinoma in the Far East and Southeast Asia, Liver Int., 2010, 25(4), 696–703 CrossRef.
- L. Lang, FDA approves sorafenib for patients with inoperable liver cancer, Gastroenterology, 2008, 134(2), 379 Search PubMed.
- X. Han, et al., The occurrence and survival condition of primary liver cancer among residents in Yangpu district of Shanghai between year 2002 and 2010, Zhonghua Yufang Yixue Zazhi, 2012, 46(2), 119 Search PubMed.
- T. Torimura, et al., Metronomic Chemotherapy: Possible Clinical Application in Advanced Hepatocellular Carcinoma 1, Translational Oncology, 2013, 6(5), 511–519 CrossRef.
- M. K. Song, et al., Gene expression analysis identifies DNA damage-related markers of benzo[a]pyrene exposure in HepG2 human hepatocytes, J. Toxicol. Environ. Health Sci., 2012, 4(1), 19–29 CrossRef.
- S. F. Darlingreed, et al., Inhibition of benzo(a)pyrene induced DNA strand breaks by organosulfur compounds (diallyl sulfide, diallyl disulfide and dially trisulfide) in MCF-10A cells, Cancer Res., 2006, 66 Search PubMed.
- C. Gutiérrez-Vázquez and F. J. Quintana, Regulation of the Immune Response by the Aryl Hydrocarbon Receptor, Semin. Immunopathol., 2013, 35(6), 613 CrossRef.
- T. H. Rushmore and A. N. Kong, Pharmacogenomics, regulation and signaling pathways of phase I and II drug metabolizing enzymes, Curr. Drug Metab., 2002, 3(5), 481–510 CrossRef CAS.
- Z. Liu, et al., AhR expression is increased in hepatocellular carcinoma, J. Mol. Histol., 2013, 44(4), 455–461 CrossRef CAS.
- S. H. Hsu, et al., Aryl hydrocarbon receptor promotes hepatocellular carcinoma tumorigenesis by targeting intestine-specific homeobox expression, Mol. Carcinog., 2017, 56(10), 2167 CrossRef CAS.
- A. K. Ehrlich, et al., TCDD, FICZ, and other high affinity AhR ligands dose-dependently determine the fate of CD4+ T cell differentiation, Toxicol. Sci., 2018, 161(2), 310–320 CrossRef CAS.
- J. T. Beck, A. Ismail and C. Tolomeo, Targeting the phosphatidylinositol 3-kinase (PI3K)/AKT/mammalian target of rapamycin (mTOR) pathway: an emerging treatment strategy for squamous cell lung carcinoma, Cancer Treat. Rev., 2014, 40(8), 980–989 CrossRef CAS.
- H. A. B. Iii, Overcoming acquired resistance to anticancer therapy: focus on the PI3K/AKT/mTOR pathway, Cancer Chemother. Pharmacol., 2013, 71(4), 829–842 CrossRef.
- J. Liu, et al., Synthesis of xanthone derivatives and studies on the inhibition against cancer cells growth and synergistic combinations of them, Eur. J. Med. Chem., 2017, 133, 50 CrossRef CAS.
- J. F. F. Weber, et al., Synthesis and SAR Study of Prenylated Xanthone Analogues as HeLa and MDA-MB-231 Cancer Cell Inhibitors, Lett. Drug Des. Discovery, 2011, 8(6), 523–528 CrossRef.
- J. Liu, et al., DMXAA-pyranoxanthone hybrids enhance inhibition activities against human cancer cells with multi-target functions, Eur. J. Med. Chem., 2017, 143, 1768 CrossRef.
- J. Liu, et al., Incorporation of nitric oxide donor into 1,3-dioxyxanthones leads to synergistic anticancer activity, Eur. J. Med. Chem., 2018, 151, 158–172 CrossRef CAS.
- A. Inoue-Yamauchi and H. Oda, Depletion of mitochondrial fission factor DRP1 causes increased apoptosis in human colon cancer cells, Biochem. Biophys. Res. Commun., 2012, 421(1), 81–85 CrossRef CAS.
- V. Borutaite, et al., Inhibition of mitochondrial permeability transition prevents mitochondrial dysfunction, cytochrome c release and apoptosis induced by heart ischemia, J. Mol. Cell. Cardiol., 2003, 35(4), 357–366 CrossRef CAS.
- S. S. Suh, A. Rocci, C. Taccioli, R. Santhanam, W. Zhou and D. M. Benson, et al., Downregulation of p53-inducible microRNAs 192, 194, and 215 impairs the p53/MDM2 autoregulatory loop in multiple myeloma development, Cancer Cell, 2016, 18(4), 367–381 Search PubMed.
- M. Dan and M. Oren, The p53–Mdm2 module and the ubiquitin system, Semin. Cancer Biol., 2003, 13(1), 49–58 CrossRef.
- B. C. Baguley, Antivascular therapy of cancer: DMXAA, Lancet Oncol., 2003, 4(3), 141–148 CrossRef CAS.
- M. Malumbres and A. Carnero, Cell cycle deregulation: a common motif in cancer, Prog. Cell Cycle Res., 2003, 5, 5 Search PubMed.
- J. S. Foster, et al., Multifaceted Regulation of Cell Cycle Progression by Estrogen: Regulation of Cdk Inhibitors and Cdc25A Independent of Cyclin D1-Cdk4 Function, Mol. Cell. Biol., 2001, 21(3), 794–810 CrossRef CAS.
- B. A. Scaglionesewell, et al., A vitamin D3 analog induces a G1-phase arrest in CaCo-2 cells by inhibiting cdk2 and cdk6: roles of cyclin E, p21Waf1, and p27Kip1, Endocrinology, 2000, 141(11), 3931–3939 CrossRef CAS.
- M. Cheng, et al., The p21Cip1 and p27Kip1 CDK ‘inhibitors’ are essential activators of cyclin D-dependent kinases in murine fibroblasts, EMBO J., 2014, 18(6), 1571–1583 CrossRef.
- S. Ohta, A Multi-Functional Organelle Mitochondrion is Involved in Cell Death, Proliferation and Disease, Curr. Med. Chem., 2003, 10(23), 2485–2494 CrossRef CAS.
- L. Yuan, et al., Isoorientin Induces Apoptosis and Autophagy Simultaneously by Reactive Oxygen Species (ROS)-Related p53, PI3K/Akt, JNK, and p38 Signaling Pathways in HepG2 Cancer Cells, J. Agric. Food Chem., 2014, 62(23), 5390–5400 CrossRef CAS.
- Z. Li, et al., Honokiol induces autophagy and apoptosis of osteosarcoma through PI3K/Akt/mTOR signaling pathway, Mol. Med. Rep., 2018, 17(2), 2719 CAS.
Footnote |
| † Contributed equally to this work. |
| This journal is © The Royal Society of Chemistry 2019 |