
 Open Access Article
 This Open Access Article is licensed under a Creative Commons Attribution-Non Commercial 3.0 Unported Licence
The photocatalytic degradation of chloramphenicol with electrospun Bi2O2CO3-poly(ethylene oxide) nanofibers: the synthesis of crosslinked polymer, degradation kinetics, mechanism and cytotoxicity†
Qin Xu‡
a,
Zijuan Song‡a,
Shuting Jia,
Gang Xu a,
Wenyan Shi*a and
Longxiang Shen*b
a,
Wenyan Shi*a and
Longxiang Shen*b
aSchool of Environmental and Chemical Engineering, Shanghai University, Shanghai 200444, PR China. E-mail: wyshi1981@shu.edu.cn; Fax: +86 21 6613 7787; Tel: +86 21 6613 5127
bDepartment of Orthopedic Surgery, Shanghai Jiao Tong University Affiliated Sixth People's Hospital, Shanghai 200233, PR China. E-mail: 18930172617@163.com; Fax: +86 21 2405 8009; Tel: +86 21 2405 8121
First published on 23rd September 2019
Abstract
Insoluble poly(ethylene oxide) (PEO) nanofibers were synthesized by adding pentaerythrotol triacrylate (PETA) into precursor solutions prior to electrospinning, and then the obtained fibers were exposed to an electron beam (EB) irradiation. Bi2O2CO3 was incorporated into these fibers to extend their photocatalytic properties. Studies confirmed that EB irradiation induced characteristic changes in PEO and led to the formation of a crosslinked structure, from which we optimized the irradiation dose of fibers as 210 kGy. The optimum PEO/Bi2O2CO3 membranes achieved 99.5% CPL degradation within 60 min, and we also proposed the possible degradation pathways of CPL in this study. Besides, all the water samples and extracts of nanomaterials showed no cytotoxicity on L-929 cells. The subtle variations in the cell viability of treated and untreated water samples could be due to the toxic intermediates arising from the photocatalytic process. Therefore, this photocatalyst-polymer membrane can be considered as a biocompatible composite system that can change the solubility of a polymer and also act as a highly efficient photocatalyst for organic wastewater treatments.
1. Introduction
The contamination of aqueous systems by antibiotics is emerging as a worldwide environmental problem.1 As one of the low-cost antibiotics that is widely used,2,3 chloramphenicol (CPL) exhibits excellent antibacterial properties when used in treating diseases in both human and animals.4,5 The widespread use of CPL has passed them into the environment, which led to the emergence of drug resistant bacteria and various side effects to human.6,7 Moreover, the great antibacterial property of CPL also hinders the conventional biological removal of it.4,8 Therefore, it is of great importance to develop an effective method to achieve the elimination of CPL in an aqueous system.Photocatalytic technology could decrease the toxicity of antibiotics,8–10 and meanwhile degrade antibiotics to small molecules.11 Considering the potential application in solar-energy utilization, semiconductor-based photocatalysis has emerged with inestimable superiority, such as economic, effective and renewable benefits.12–14 Most of the photocatalysts exhibit photocatalytic performance via their redox ability.15,16 Bi2O2CO3, as an n-type semiconductor with a wide band gap, has enhanced charge separation efficiency due to its unique structure with alternating Bi2O22+ and CO32− layers.17–20 Many researchers have synthesized Bi2O2CO3 in different morphologies under harsh conditions,21–23 while Chen et al. reported a simple and low-cost method conducted via hydrothermal processes at room temperature using cetyltrimethylammonium bromide (CTAB) as the template. So far, the great photocatalytic activity of Bi2O2CO3 particles has been reported, but the problem is that suspended semiconductor particles are easy to disperse in treated water and thus are difficult to recycle. Therefore, in order to ensure that the photocatalyst has excellent photocatalytic activity and recyclability at the same time, electrospinning method could be introduced into the experiment.
Electrospinning is a method of preparing nanoscale to microscale fibers using high electric fields,24,25 which make electrospun fibers ideal substrate materials. Many reports on the construction of a composite system using electrospinning technology,26–28 or introducing photocatalyst into polymers to form photocatalyst-polymer composites29–32 provide a good approach for solving the problem of photocatalyst aggregation and loss. Poly(ethylene oxide) (PEO) is a unique class of biocompatible, low toxicity and water soluble polymer, which has attracted increasing interest due to its potential applications.33,34 PEO is soluble in a variety of solvents to form precursor solution, and therefore could be widely used in electrospinning technology to prepare ultra-fine nanofibers35–37 and prevent the adhesion of organic pollutants.38 Since the high solubility of PEO would restrict its application in some aqueous systems, several effective modification methods have been used to crosslink PEO. For example, Lee et al.39 prepared pure PEO gel via γ-ray irradiation, which formed a type of polymer network structure and exhibited typical hydrogel properties. Smita Ghosh et al. added oxime into PEO solution to create PEO hydrogels with excellent adhesive and non-cytotoxic properties.40 Moreover, Jurkin et al. studied the factors influencing the crosslinking of PEO powders under irradiation via different measurement techniques.41 For maintaining the basic morphology of electrospun PEO fibers, some researchers prepared UV-initiated crosslinked electrospun PEO nanofibers by adding a crosslinking agent into precursor solutions.42,43 However, the production of crosslinked elecrospun PEO fibers under an electron beam (EB) irradiation is rarely reported in previous studies.
Herein, we successfully prepared crosslinked PEO fibers in the presence of PETA and an EB irradiation. A wide variety of EB irradiation dose was investigated to determine the appropriate dose for the preparation of fibers with desired properties. Based on the optimized method, we prepared insoluble electrospun PEO/Bi2O2CO3 membranes, which exhibited excellent photocatalysis properties to CPL in water. The possible decomposition pathways of CPL and the cytotoxicity of water samples and obtained nanomaterials have been discussed. This study might be useful in the synthesis of PEO/Bi2O2CO3 and the degradation of CPL for future applications in environmental pollution and control.
2. Experimental
2.1 Materials
Poly(ethylene oxide) (PEO, Mn = 100![[thin space (1/6-em)]](https://www.rsc.org/images/entities/char_2009.gif) 000), sodium carbonate (Na2CO3), hexadecyl trimethyl ammonium bromide (CTAB) and bismuth nitrate pentahydrate (Bi(NO3)3·5H2O) were purchased from Anpel Laboratory Technologies (Shanghai, China). Pentaerythrotol triacrylate (PETA) was purchased from Yuanye Biological Inc (Shanghai, China). Dichloromethane (DCM, HPLC), methanol (AR) and N,N-dimethylformamide (DMF, AR) were purchased from Sinopharm Chemical Reagent Co., Ltd (Shanghai, China). The above-mentioned reagents were used as provided by the manufacturer without further purification. Ultrapure water produced from a Milli-Q device (18.2 MΩ cm−1) was used throughout the experiments. L-929 fibroblast cells, Dulbecco's modified Eagle medium (DMEM), fetal bovine serum (FBS) and cell Counting Kit-8 (CCK8) were purchased from Shanghai Fanmeng Biotechnology Co., Ltd (Shanghai, China).
000), sodium carbonate (Na2CO3), hexadecyl trimethyl ammonium bromide (CTAB) and bismuth nitrate pentahydrate (Bi(NO3)3·5H2O) were purchased from Anpel Laboratory Technologies (Shanghai, China). Pentaerythrotol triacrylate (PETA) was purchased from Yuanye Biological Inc (Shanghai, China). Dichloromethane (DCM, HPLC), methanol (AR) and N,N-dimethylformamide (DMF, AR) were purchased from Sinopharm Chemical Reagent Co., Ltd (Shanghai, China). The above-mentioned reagents were used as provided by the manufacturer without further purification. Ultrapure water produced from a Milli-Q device (18.2 MΩ cm−1) was used throughout the experiments. L-929 fibroblast cells, Dulbecco's modified Eagle medium (DMEM), fetal bovine serum (FBS) and cell Counting Kit-8 (CCK8) were purchased from Shanghai Fanmeng Biotechnology Co., Ltd (Shanghai, China).
2.2 Synthesis
:1(v/v)) added to 20 wt% of PETA solution was stirred till the polymer completely dissolved. The PEO solution was loaded into a 5 mL syringe with a stainless needle (with a diameter of 0.33 mm), which was connected to a positive voltage power supply. The electrospun PEO nanofibers were collected on an aluminum foil that was placed at a distance of 12 cm from the needle. The syringe pump was set to deliver the solution at a rate of 0.14 mm min−1 (0.02 mL h−1) and high voltage (12 kV) was applied. Electrospinning process was performed at room temperature. The above films were well-sealed, isolating oxygen by N2 and irradiated by electron beams (dose energy: 2 meV, dose rate: 10 kGy per pass) under different irradiation doses.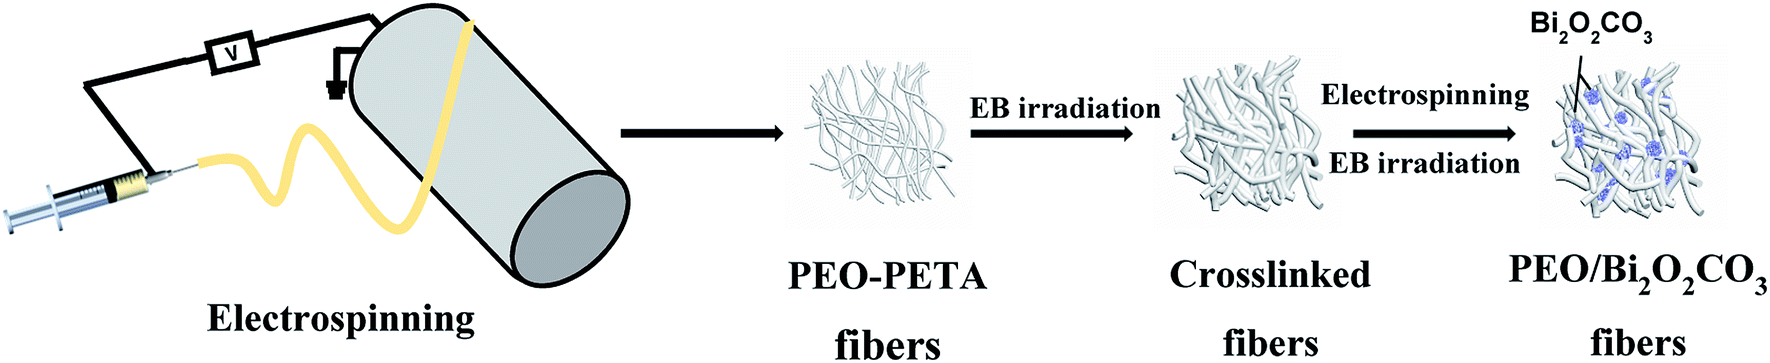 | ||
| Fig. 1 Schematic of the processing steps for the production polymer-inorganic nanofibers. | ||
| No. | Polymer blending | Bi2O2CO3 concentration in solution (wt%) | Sample name |
|---|---|---|---|
| 1 | PEO-PETA | 0 | PP |
| 2 | 2 | PPB2 | |
| 3 | 6 | PPB6 | |
| 4 | 8 | PPB8 |
2.3 Membrane characterization
Scanning electron microscopy (SEM, JSM-7500F) was performed to observe the morphologies. Powder X-ray diffraction (XRD) patterns were recorded on a Rigaku Ultima IV diffractometer equipped with Cu-Kα radiation. The contact angle of the crosslinked samples was measured by the contact angle measuring instrument (JY-82B). Fourier transform infrared spectroscopy (FT-IR) was performed using a Nicolet iS10 FT-IR Spectrometer (Thermo Scientific, USA) in the range of 600 cm−1 to 4000 cm−1. Differential scanning calorimetry (DSC) was performed using a TA Instrument (DSC, 200 PC, Netzsch, Germany) programmed from 50 °C to 170 °C at a heating rate of 10 °C min−1.2.4 Photocatalytic experiments
The photocatalytic activity experiments were performed under a 300W Xe lamp equipped with a 420 nm cut off filter. Chloramphenicol (CPL) was used as the target pollutant, and the as-prepared fiber was cut into a square sample of 4 × 4 cm2, and added into solution (50 mL, 15 mg L−1). Typically, the solution was stirred in dark for 30 min to achieve the adsorption equilibrium between the organic molecules and the catalyst surface. At designed time intervals, 1 mL of the reacted solutions was taken out and filtered through a 0.22 μm filter for further analysis.2.5 Analysis
The concentration of CPL was analyzed by a high-performance liquid chromatograph (HPLC, Agilent 1200LC), using a Zorbax Eclipse XDB-C18 column (4.6 mm × 150 mm, 5 μm) and a UV/Vis detector at 277 nm, with methanol and water (60/40, v/v) as an effluent at a flow rate of 1.0 mL min−1. The sample injection volume was set as 20 μL, and chromatographic column temperature was set as 40 °C.The intermediates formed from the photocatalytic degradation of CPL were analyzed using an Agilent 1260 Infinity II HPLC that was coupled to an Agilent 6545 Q-TOF mass spectrometer using an electronspray ionization (ESI) source. An Agilent Zorbax RRHD Eclipse Plus C18 (2.1 × 50 mm) column, 1.8 μm particle size (Agilent) was used with 40 °C of column temperature. A mobile phase of formic acid 0.1 vol% (A) and methanol (B), with a UV detector wavelength of 278 nm was employed for the CPL analysis. The gradient program was as follows: 0–2.0 min 0–60% A, 2.0–4.5 min 60–40% A, and 4.5–6.0 min 40–60% A. The scanning acquisition mass-to-charge ratio (m/z) range was set at 50–500. The value of capillary voltage, nebulizer pressure, nozzle voltage, drying gas flow rate and temperature was 3500 V, 35 psi, 1000 V, 8 L min−1 and 320 °C, respectively.
2.6 Cytotoxicity
To evaluate the biocompatibility of nanomaterials (PPB0, PPB2, PPB6 and PPB8), the ISO 10993-5 standard test method though CCK-8 assay was used. Before the experiment, the samples were sterilized with a UV lamp, immersed in complete medium (90% DMEM, 10% FBS for tissue culturing) and incubated 5% CO2 at 37 °C for 24 h. The extraction media from tissue culture plate was added into the medium in a 96-well plate which have contained 100 μL of L929 (mouse fibroblast) cell suspension and incubated for 24 h.The cytotoxicity of the treated and untreated CPL solutions were also determined by a CCK-8 assay. CPL solution was set as the positive control (concentration of 15 mg L−1). In a typical procedure, the L929 (mouse fibroblast) cell suspension (100 μL) was seeded in the medium in a 96-well plate supplemented with obtained water samples (10 μL) and incubated at 37 °C for 24 h.
All the samples had six parallel wells. Further, 10 μL of CCK-8 solution was added into the wells (including materials and water samples) and incubated for another 4 h at 37 °C in dark. The absorbance was determined at 450 nm using a plate reader (Tecan Spark, Switzerland). The cell viability was calculated according to the following equation:
| Cell viability (%) = Abstest/Abscontrol × 100 |
3. Results and discussion
3.1 Effect of EB irradiation doses
In order to determine the optimal irradiation dose of crosslinked membranes, the properties of PEO-PETA fibers exposed to different EB irradiation doses were investigated by XRD, FTIR and DSC.The chemical composition and phase structure of the as-synthesized samples were determined by XRD. As shown in Fig. 2, the characteristic diffraction peaks of pristine PEO fibers and PP fibers are well matched with the standard XRD patterns of PEO 6000 (JCPDS no. 49-2109). Most synthetic samples exhibited characteristic peaks at 2θ = 19.06°, 23.2° and 26.8°, which demonstrate the (120) (112) and (131) planes of PEO, respectively. The results show that the characteristic peak strength of PEO is inversely proportional to the EB irradiation dosed applied by the sample, and the decrease in the characteristic peak strength also means the decrease in crystallinity. A wide weak peak appears in the XRD curve of PP300, which means that the sample gets converted to amorphous at this point of time.44
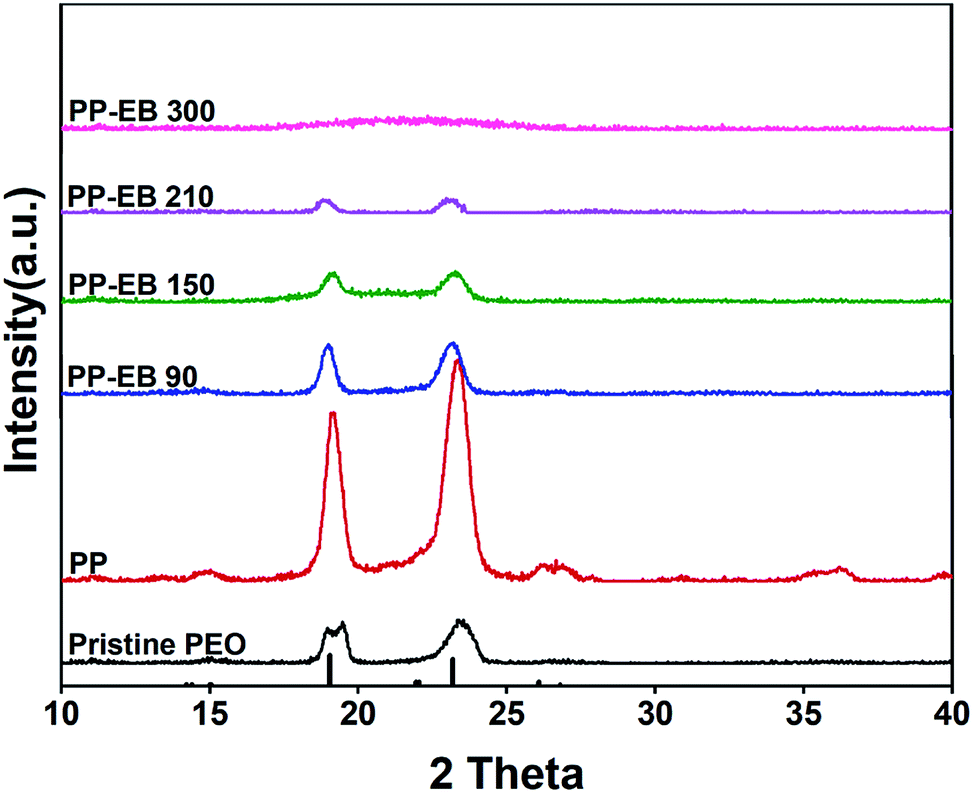 | ||
| Fig. 2 XRD patterns of the electrospun PEO and PEO–PETA nanofibers at different electron beam irradiation doses. | ||
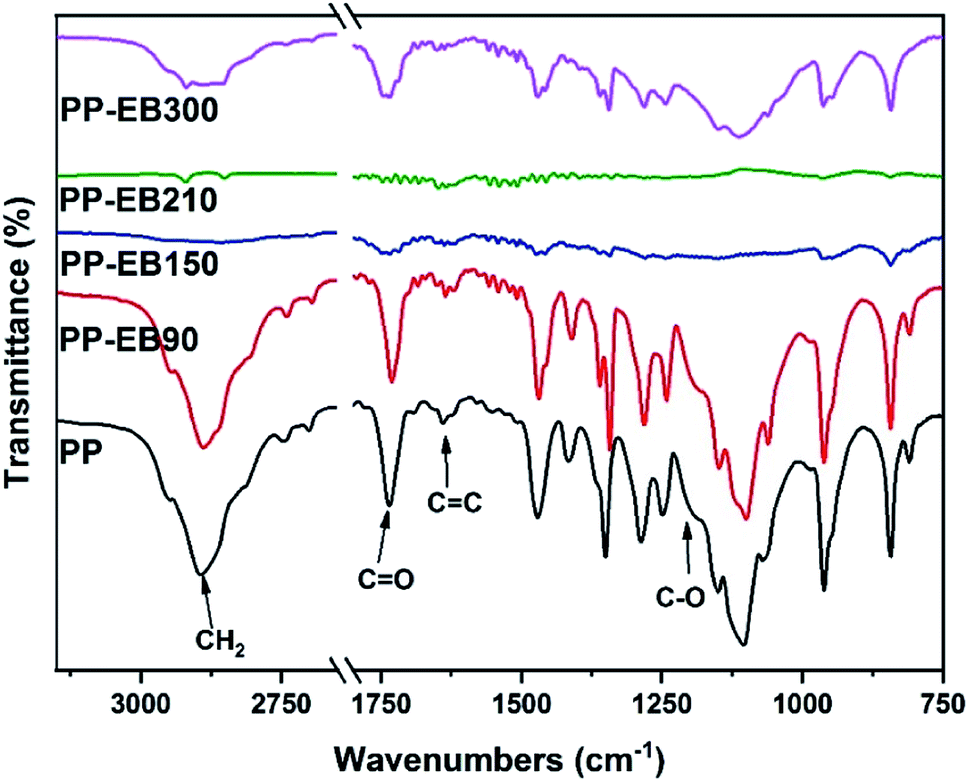
The FT-IR spectra of a series of PEO–PETA polymers irradiated by different EB irradiation doses are given in Fig. 3. Typical characteristic peaks of PEO observed at 2889 cm−1 and 1102 cm−1 are attributed to the CH2 stretching and C–O stretching respectively.45 Three additional peaks presented in Fig. 3, at 1731 cm−1 (C![[double bond, length as m-dash]](https://www.rsc.org/images/entities/char_e001.gif) O), 1635 cm−1 (CC) and 1201 cm−1 (C–O) can be related to PETA,42 indicating that PETA was grafted onto the PEO backbone.46
O), 1635 cm−1 (CC) and 1201 cm−1 (C–O) can be related to PETA,42 indicating that PETA was grafted onto the PEO backbone.46
 | ||
| Fig. 3 FTIR spectra of the electrospun PEO and PEO–PETA nanofibers at different electron beam irradiation doses. | ||
In a possible crosslinking mechanism (Fig. 4), with the increase in the EB irradiation doses, the intensities of the CH2 peaks of PEO and the three characteristic absorbance peaks of PETA mentioned above decrease first and increase subsequently. When the amount of EB irradiation increases to 210 kGy, radiation promotes the formation of PEO radicals and stimulates the PETA to produce a triplet state that can attract protons from a PEO chain to form free radicals.42 According to the principle of minimum energy and the principle of proximity, free radicals could combine with their neighbouring radicals to form an intricate three-dimensional network structure of PEO and PETA,47,48 thus increasing the crosslinking degree of PEO and reducing its crystallinity. The fact that the absorption intensities of the PEO crystalline spectra (CH2 stretching at 2889 cm−1) decrease significantly after irradiation (0-210 kGy) can also prove this point. Excessive energy could open crosslinked chains and accelerate the movement of free radicals, which makes scission become the main reaction instead of crosslinking,48 and so the intensity of the characteristic peaks increases after further increase in the irradiation dose.
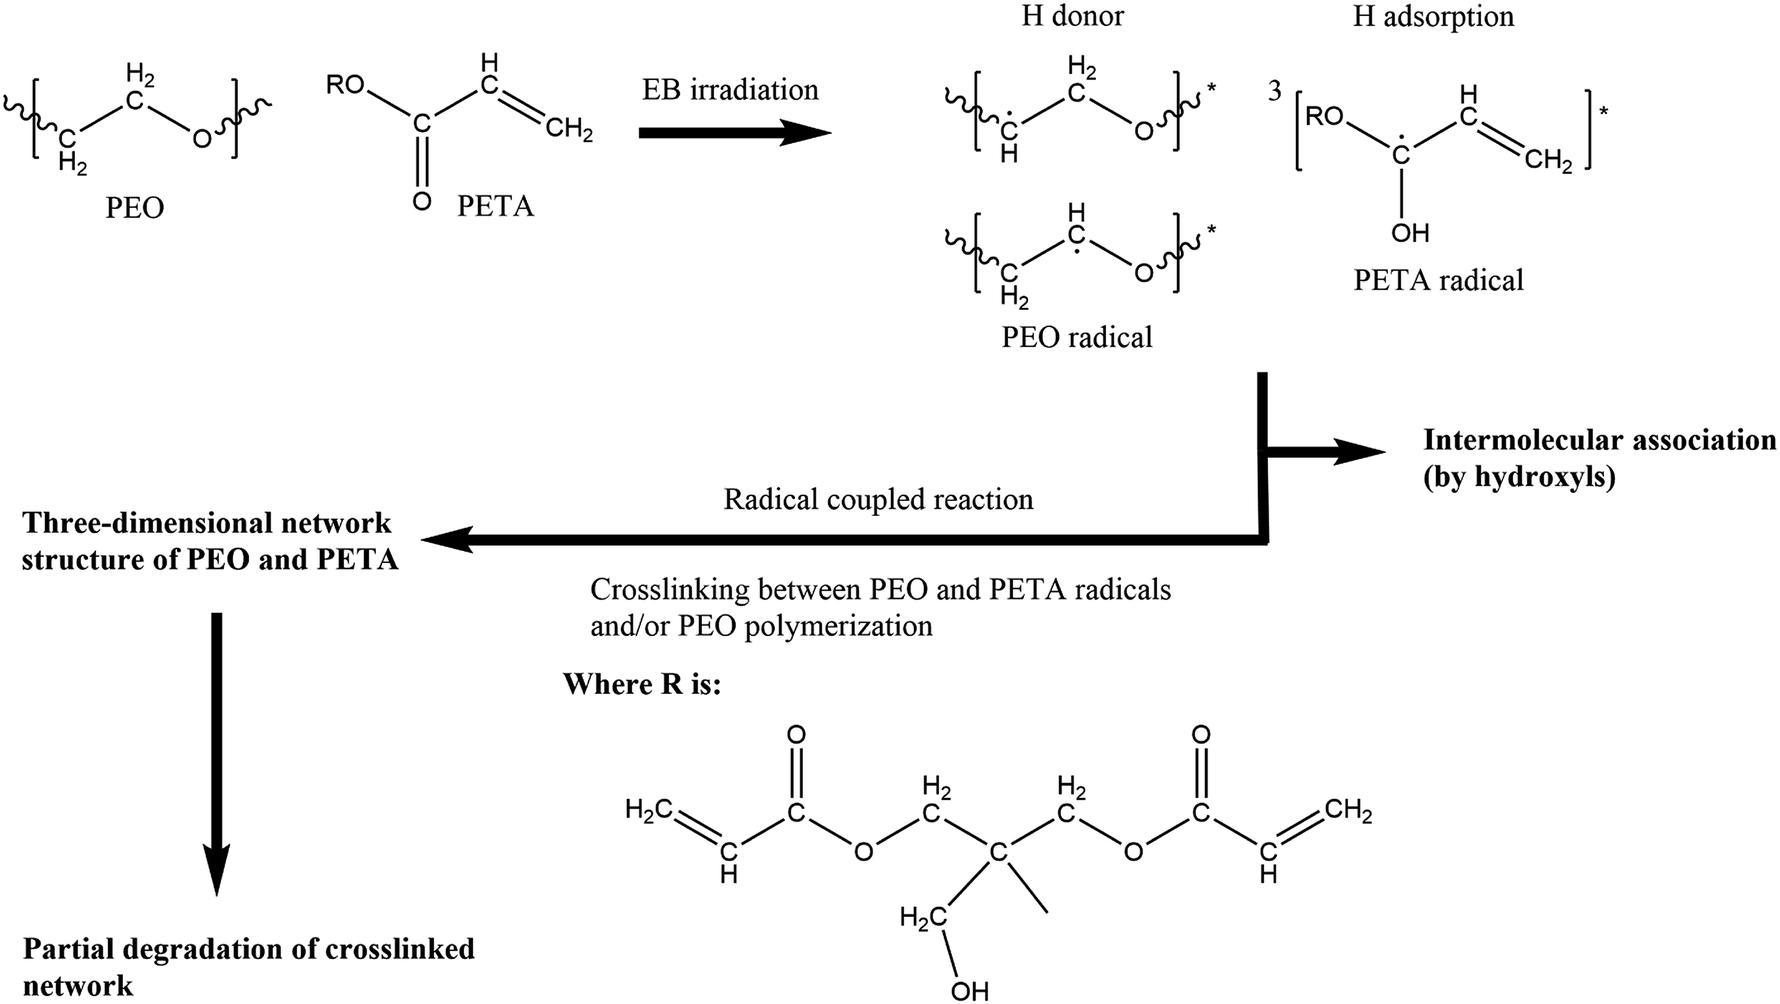 | ||
| Fig. 4 The possible crosslinking mechanism of PEO and PETA with the increase in the EB irradiation intensity. | ||
The DSC curves of the irradiated and non-irradiated PEO–PETA fibers are given in Fig. 5. From the DSC curves of irradiated and non-irradiated PEO-PETA nanofibers, the crystalline melting temperatures (Tm), enthalpy of fusion (ΔHm), and the corresponding crystallinities ( , the degree of crystallinity of the PEO in the composites) were calculated, which are shown in Table 2. The crystallization ability of the miscible blend could be limited compared to the corresponding pure components.49,50 It can be seen that in the presence of PETA, the melting temperature of PP gradually decreases lower than 61.0°, which is related to the formation of a three-dimensional crosslinking network under irradiation, which can hinder the crystallization process51 and the addition of the fragments of PETA chains in PEO would reduce Tm. Thus, the PEO crystallization in composites is quite different or imperfect from it in the original PEO. The results also demonstrate that fibers irradiated by a 210 kGy EB dose has the lowest crystallinity, which is consistent with the conclusion of the above FTIR results.
 | ||
| Fig. 5 DSC curves of the electrospun PEO and PEO–PETA nanofibers at different electron beam irradiation doses. | ||
| Sample | Sample name | Tm (°C) | ΔHm (J g−1) |
|
|---|---|---|---|---|
a  was calculated using equation was calculated using equation  , where ΔHO = 205 J g−1 is the enthalpy of the fusion of 100% crystalline PEO, and CPEO is the weight fraction of the PEO matrix in the composite. , where ΔHO = 205 J g−1 is the enthalpy of the fusion of 100% crystalline PEO, and CPEO is the weight fraction of the PEO matrix in the composite. |
||||
| Pristine PEO-PETA | PP | 61.0 | 20.0 | 97.6 |
| PEO-PETA-EB90 | PP-EB90 | 55.1 | 12.6 | 61.5 |
| PEO-PETA-EB150 | PP-EB150 | 40.3 | 5.1 | 24.9 |
| PEO-PETA-EB210 | PP-EB210 | 45.2 | 3.9 | 19.0 |
| PEO-PETA-EB300 | PP-EB300 | 39.8 | 7.6 | 37.1 |

The morphology of irradiated and non-irradiated electrospun PEO–PETA fibers are shown in Fig. 6. It can be found that the EB irradiation has a significant effect on the morphology of the surface nanofibers of PEO. The electrospun fibers without irradiation are 247 ± 158 nm in diameter with a cylindrical shape and slightly beaded surface morphology, while the diameter of irradiated fibers is almost twice that of unirradiated ones. In addition, the surface of fibers became rough with more shrinkage after irradiation,52,53 but their structural integrity were retained.
 | ||
| Fig. 6 SEM images of non-irradiated (a and b) and irradiated (c and d) the PEO-PETA fibers at a 210 kGy EB irradiation dose. | ||
It is shown in Fig. 7 that insoluble PEO membranes exhibited hydrophilic properties were successfully prepared. The hydrophilic surface of the membrane could be related to membrane fouling.54–57 Increasing the hydrophilicity of the membrane is beneficial to reduce the hydrophobic binding of the membrane surface to organic contaminants, thereby preventing the adsorption of contaminants between the membrane and water and prolonging the service life of the membrane. The functional groups can be considered as the main factor affecting the hydrophilicity of the materials.58,59 Different dissociation energies of the hydrogen-bonded complexes result in different hydrophilic properties of functional groups. The decrease in the contact angles of the nanofibers (from 30 to 210 kGy) was mainly due to the increase in the hydroxyl (3446 cm−1) content, decrease in the methylene (2889 cm−1) content and somehow corresponding to the surface roughness of the materials.60 With the further increase in the EB irradiation intensity, the contact angle decreases from 8.5° for PP210 to 23.5° after EB irradiation of 300 kGy, which indicates the decrease in hydrophilicity of the membrane and could be directly related to the decrease of hydroxyl.
 | ||
| Fig. 7 Contact angles of the as-prepared samples in different EB irradiation. | ||
3.2 Photocatalytic degradation of CPL
The photocatalytic activity of the PEO/Bi2O2CO3 fibers was evaluated by photodegrading the CPL under a visible light irradiation. As we can see in Fig. 8(a), the adsorption capacities (irradiation time −30–0 min) of PP, PPB2, PPB6 and PPB8 are 14.4%, 14.8%, 11.0% and 15.2%, respectively, which indicate that the adsorption effect did not play a primary role in the whole CPL removal process. Moreover, the photocatalysis of CPL can be neglected in the absence of Bi2O2CO3 particles (Pristine PEO), suggesting that the degradation CPL is induced by photocatalysis. | ||
| Fig. 8 Photocatalytic activities of the as-prepared samples for CPL (a) degradation under visible-light (λ > 420 nm); the pseudo-first-order kinetic model for the photodegradation of CPL (b). | ||
After 1 h visible light irradiation, CPL can be almost decomposed (99.5% and 98.7%, respectively) by PPB6 and PPB8. The order of the photocatalytic activities of these fibers can be summarized as PPB6 > PPB8 > PPB2 > pristine PEO. It can be seen that the introduction of Bi2O2CO3 effectively improves the photocatalytic activity of PEO. PPB6 shows the best photocatalytic activity under visible light.
The rate of photocatalytic degradation follows a pseudo first order kinetics based on the Langmuir–Hinshelwood model:
| ln(C0/Ct) = kt |
Thus, it can be seen that Bi2O2CO3 particles are advanced photocatalysts, whose contents could directly affect the photocatalytic performance of composites. In this study, composite exhibited the best photocatalytic activity when added with 6% of Bi2O2CO3. The above results indicated that the photocatalytic activity of PPB can be enhanced by introducing a suitable amount of Bi2O2CO3. However, the active sites on the surface of fibers would be covered by the further loading of catalysts as discussed in many studies,61–63 resulting in the reduction of photocatalytic performance (Fig. S1†).
3.3 Identification of intermediates formed by the PEO/Bi2O2CO3 composite nanofibers
To further elucidate the degradation pathways of CPL, unknown by-products were identified by LC-Q-TOF using samples obtained during the photocatalytic reaction. The intermediates formed during the photocatalytic degradation of CPL by PPB6 at 30 min, 60 min, 90 min, 120 min and 180 min were analysed. Fig. S2† provides the ESI mass spectra of the photocatalytic degradation of CPL at different reaction times in different ESI modes (ESI− and ESI+). The intermediates are identified using the information of mass-to-charge ratio (m/z) of the generated fragment ion, and each intermediate produced at different reaction time is listed in Table S1.† According to the results, the characteristic peaks of CPL were detected at 0, 30 and 60 min and disappeared after 90 min, which is consistent with the HPLC results. On the basis of above data and referring to previous studies,64–68 the possible photocatalytic degradation pathways of CPL on PPB6 within 180 min are proposed in Fig. 9.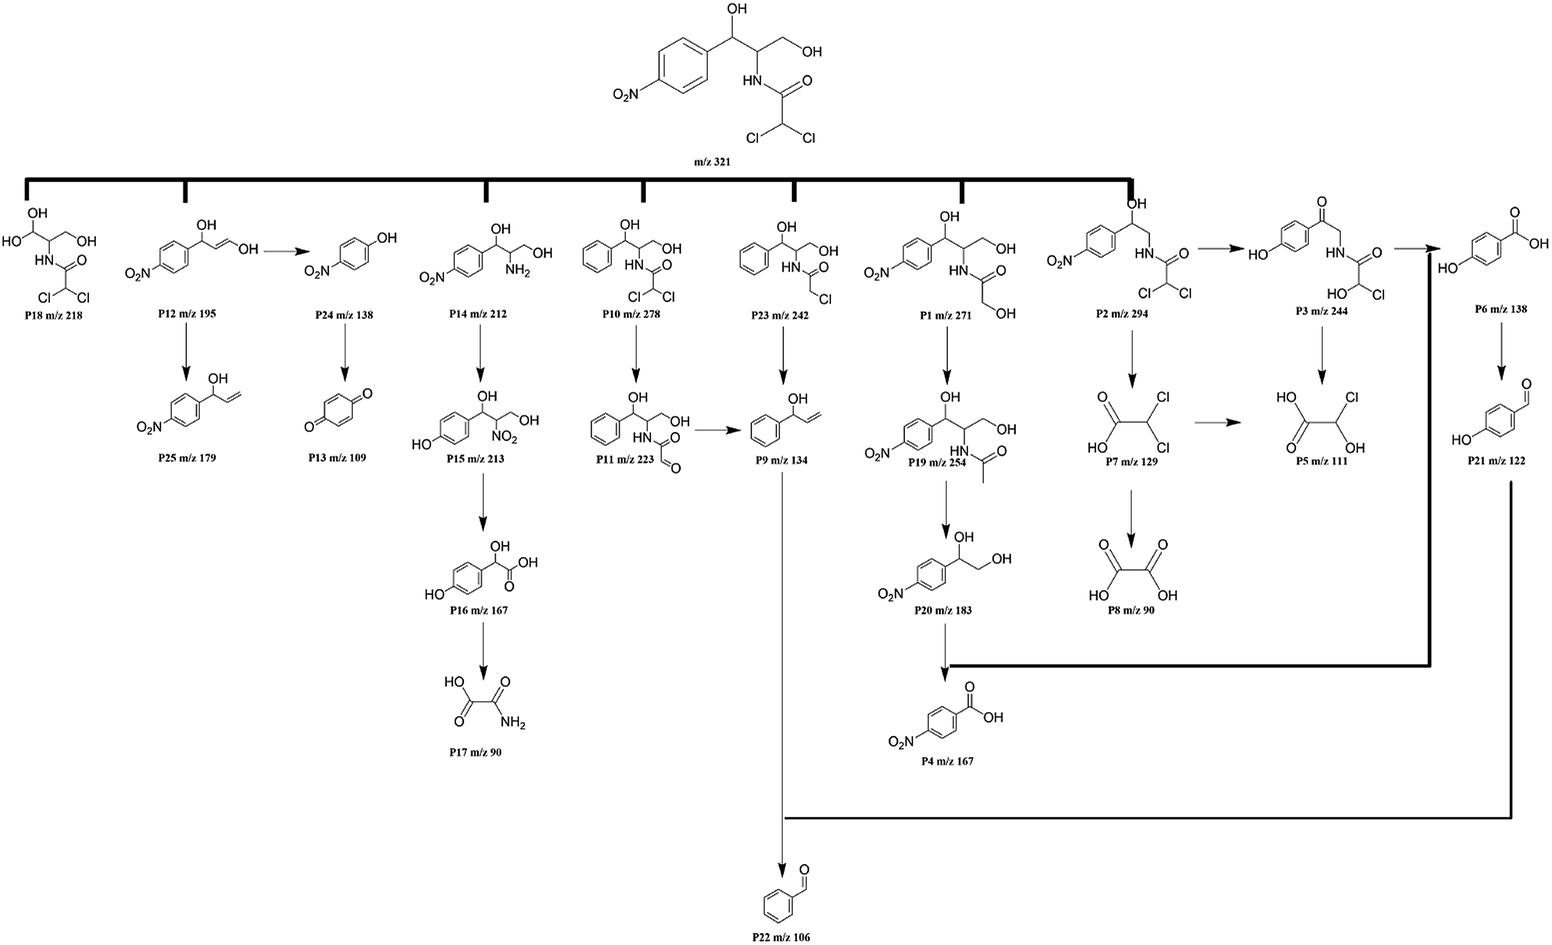 | ||
| Fig. 9 Proposed photodegradation mechanism of the CPL. | ||
According to the bond dissociation energy (BDE) theory, the bonds of phenyl-nitryl, O–H and C–Cl and C–N are easily cleaved than the other bonds of CPL. The degradation is initiated by the denitration or deprivation of methanol from the branch chain of CPL, yielding intermediate with m/z 278 (P10) and 294 (P2) after 30 min reaction, which further forms a series of products (P11, P9, P22 and P3) by dechloridation, dehydration and denitration. The characteristic peak of CPL weakens after 1 h and subsequently decomposes to intermediates P1, P23, P12 and P14. P1 degrades into P19 by branched-chain dehydration, which is further degraded to P20 through the hydroxyl radical attack. The subsequent denitration or deprivation of methanol leads to the production of P4, which soon degrades gradually into P6, P21 and P22. Moreover, product 12 was formed by the cleavage of CAN bond and losing of the dichloroacetamide of CPL, while P14 is formed by the breakage of the lateral chain of CPL. After 180 min reaction, the above intermediates are further converted into products P25, P24, P13, P15, P16 and P17. In addition, the benzenic ring of the obtained products would further be opened by radicals and gradually become harmless.64
3.4 Cytotoxicity
The in vitro cytotoxicity test of CPL solutions before and after photocatalysis was tested via the cell viability of L-929 mouse fibroblast cells after exposure to the solution samples collected during photocatalytic experiments using the cell counting kit-8 (CCK-8) assay. Fig. 10(a) shows the cell viability after 24 h of incubation with CPL solutions treated in different times. We found that exposing L-929 cells to test solutions for 24 h has little effect on cell viability, so all samples show no cytotoxic effect on the cells, as shown in Fig. 10(a). Water sample with the minimal cell viability (81.0 ± 3.1%) was collected at the photocatalysis process time of 150 min by PPB6, while some samples even promoted the cell growth with the viability exceeding 100%.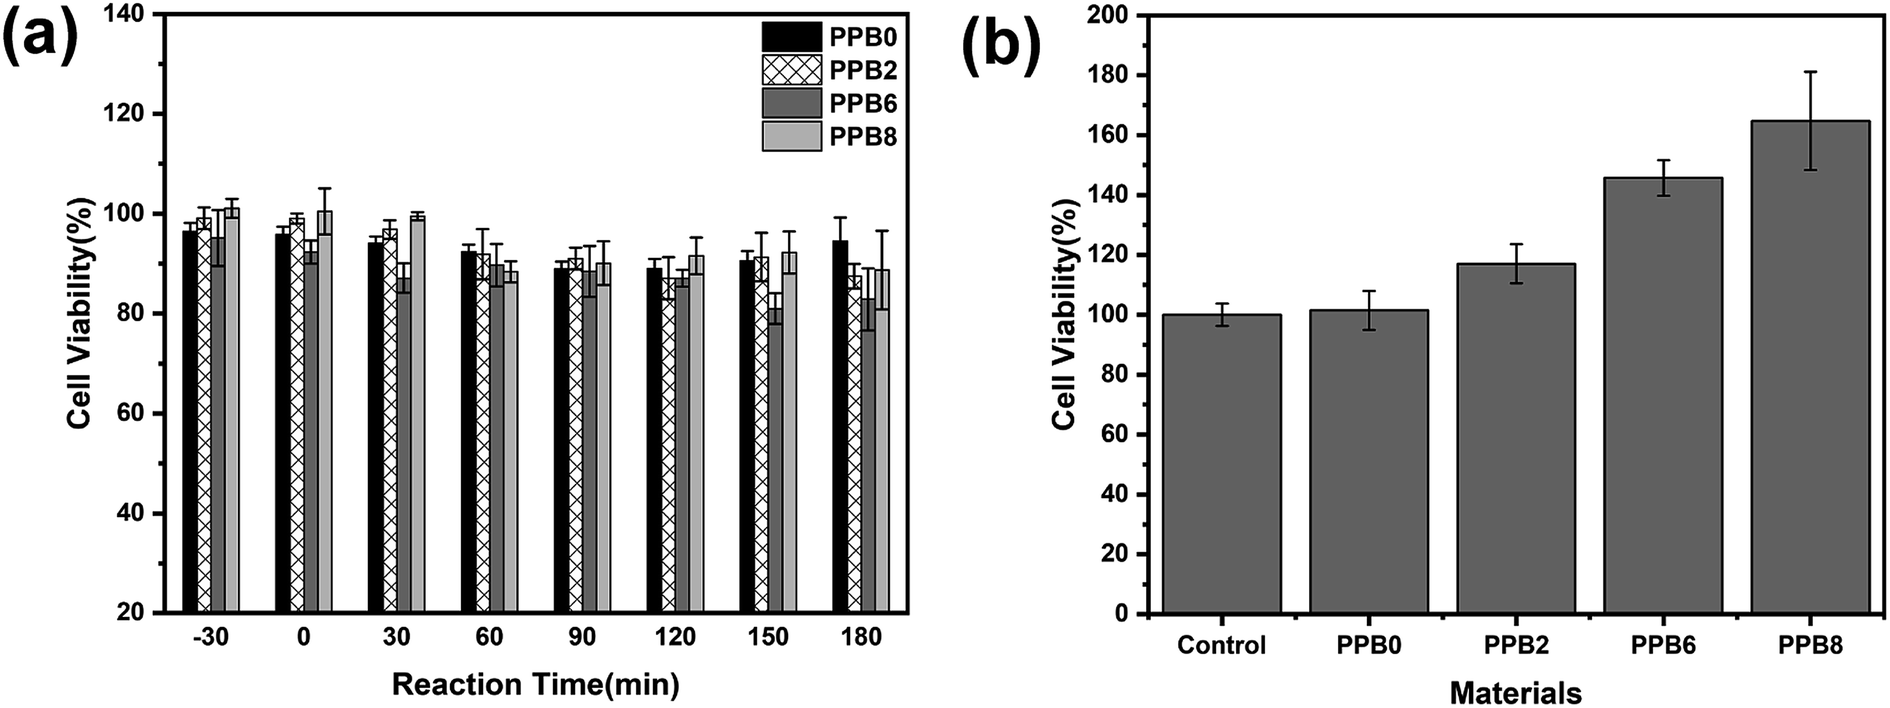 | ||
| Fig. 10 Cytotoxicity of the L-929 cells in contact with CPL solutions collected during photocatalytic degradation at different times (a) and the as-prepared extraction media exposed with the different PPB samples (b). | ||
CPL is an inhibitor of mitochondrial protein synthesis.69 However, the low dose CPL solution could be used in mammalian cell cultures for the elimination of light contaminating microorganisms without inhibiting the growth and metabolism of the cells.70 Previous studies have shown that CPL must be metabolized to perform its biological effects. It has been found that NAPD (P14) and HAP (P1) (metabolites of CPL),71–73 consistent with our studies, are slightly toxic to cells at very high doses and so have very limited effect on cell viability in these two products, given the low concentration in our degradation process.
In order to be suitable for large-scale applications, photocatalytic materials should exhibit good biocompatibility. PEO is a biocompatible polymer and Bi2O2CO3 only has the antibacterial activity against certain bacteria74 with no cytotoxicity to cells.75 Fig. 10(b) reveals that PP and PP composites are not cytotoxic (cell viability > 100%) for the concentrations used in this study and also displays a dose–dependent cytotoxic effect to Bi2O2CO3. These results show that the semiconductors are wrapped by the biocompatible polymer and that electrospun PP and PP composite fibers exhibit a great potential for practical applications.
4. Conclusion
In summary, we have successfully prepared crosslinked PEO nanofibers by adding PETA into precursor solutions prior to electrospinning. Exposure of the obtained fibers to EB irradiation and introduction of Bi2O2CO3 into the nanofibers to expand their application in photocatalysis were also done. It is found that EB irradiation has complicated impacts on the properties of the as-prepared materials, which involves various changes in crystallinity, morphology, solubility and so on. Through CPL degradation, the as-synthesized PEO/Bi2O2CO3 nanofibers show good recyclability and excellent photocatalytic activities under visible light irradiation, and thereby can be considered to be a great substrate in photocatalytic applications. Besides, we have proposed the possible degradation pathways of CPL and demonstrated the biocompatibility of our composite in this study. This study provides simple methods for the modification of PEO and the synthesis of photocatalyst-polymer composites, which has broad application prospects in purification water systems.Conflicts of interest
There are no conflicts to declare.Acknowledgements
This work was supported by the National Natural Science Foundation of China [grant numbers 11775138, 11675098 and 41473089], Innovation Program of Shanghai Municipal Education Commission [grant number 13YZ017] and Program for Changjiang Scholars and Innovative Research Team in University [grant number IRT13078].References
- V. Homem and L. Santos, J. Environ. Manage., 2011, 92, 2304–2347 CrossRef CAS PubMed.
- S. Zhang, Z. Liu, X. Guo, L. Cheng, Z. Wang and J. Shen, J. Chromatogr. B: Anal. Technol. Biomed. Life Sci., 2008, 875, 399–404 CrossRef CAS PubMed.
- V. Gaudin and P. Maris, Food Agric. Immunol., 2010, 13, 77–86 CrossRef.
- M. Nie, Y. Yang, Z. Zhang, C. Yan, X. Wang, H. Li and W. Dong, Chem. Eng. J., 2014, 246, 373–382 CrossRef CAS.
- K. Podzelinska, R. Latimer, A. Bhattacharya, L. C. Vining, D. L. Zechel and Z. Jia, J. Mol. Biol., 2010, 397, 316–331 CrossRef CAS PubMed.
- S. Kim and D. S. Aga, J. Toxicol. Environ. Health, Part B, 2007, 10, 559–573 CAS.
- F. Baquero, J. L. Martinez and R. Canton, Curr. Opin. Biotechnol., 2008, 19, 260–265 CrossRef CAS PubMed.
- B. Czech, I. Josko and P. Oleszczuk, Ecotoxicol. Environ. Saf., 2014, 104, 247–253 CrossRef CAS PubMed.
- G. Lofrano, G. Libralato, R. Adinolfi, A. Siciliano, P. Iannece, M. Guida, M. Giugni, A. Volpi Ghirardini and M. Carotenuto, Ecotoxicol. Environ. Saf., 2016, 123, 65–71 CrossRef CAS PubMed.
- J. Niu, S. Ding, L. Zhang, J. Zhao and C. Feng, Chemosphere, 2013, 93, 1–8 CrossRef CAS PubMed.
- M. N. Abellán, J. Giménez and S. Esplugas, Catal. Today, 2009, 144, 131–136 CrossRef.
- W. Zhu, Z. Li, C. He, S. Faqian and Y. Zhou, J. Alloys Compd., 2018, 754, 153–162 CrossRef CAS.
- S. Cao, J. Low, J. Yu and M. Jaroniec, Adv. Mater., 2015, 27, 2150–2176 CrossRef CAS PubMed.
- L. Wang, P. Jin, S. Duan, J. Huang, H. She, Q. Wang and T. An, Environ. Sci.: Nano, 2019, 6, 2652–2661 RSC.
- Y. Lan, Z. Liu, Z. Guo, M. Ruan, X. Li and Y. Zhao, Chem. Commun., 2019, 55, 10468–10471 RSC.
- S. Zhou, P. Yue, J. Huang, L. Wang, H. She and Q. Wang, Chem. Eng. J., 2019, 371, 885–892 CrossRef CAS.
- Y. Zheng, F. Duan, M. Chen and Y. Xie, J. Mol. Catal. A: Chem., 2010, 317, 34–40 CrossRef CAS.
- P. Madhusudan, J. Ran, J. Zhang, J. Yu and G. Liu, Appl. Catal., B, 2011, 110, 286–295 CrossRef CAS.
- C. Greaves and S. Blower, Mater. Res. Bull., 1988, 23, 1001–1008 CrossRef CAS.
- L. Zhang, C. Hu and H. Ji, Appl. Catal., B, 2017, 205, 34–41 CrossRef CAS.
- H. Y. Liang, Y. X. Yang, J. C. Tang and M. Ge, Mater. Sci. Semicond. Process., 2013, 16, 1650–1654 CrossRef CAS.
- L. Yang, Q. Han, J. Zhu and X. Wang, Mater. Lett., 2015, 138, 235–237 CrossRef CAS.
- S. Liu, Y. Tu and G. Dai, Ceram. Int., 2014, 40, 2343–2348 CrossRef CAS.
- A. Greiner and J. H. Wendorff, Angew. Chem., Int. Ed. Engl., 2007, 46, 5670–5703 CrossRef CAS PubMed.
- J. Doshi and D. H. Reneker, J. Electrost., 1995, 35, 151–160 CrossRef CAS.
- S. Wei, J. Sampathi, Z. Guo, N. Anumandla, D. Rutman, A. Kucknoor, L. James and A. Wang, Polymer, 2011, 52, 5817–5829 CrossRef CAS.
- C. Zhou, R. Chu, R. Wu and Q. Wu, Biomacromolecules, 2011, 12, 2617–2625 CrossRef CAS PubMed.
- Q. Ma, W. Yu, X. Dong, J. Wang, G. Liu and J. Xu, J. Nanopart. Res., 2012, 14 CAS.
- N. A. Almeida, P. M. Martins, S. Teixeira, J. A. Lopes da Silva, V. Sencadas, K. Kühn, G. Cuniberti, S. Lanceros-Mendez and P. A. A. P. Marques, J. Mater. Sci., 2016, 51, 6974–6986 CrossRef CAS.
- N. T. B. Linh, K.-H. Lee and B.-T. Lee, J. Mater. Sci., 2011, 46, 5615–5620 CrossRef.
- C. Prahsarn, W. Klinsukhon and N. Roungpaisan, Mater. Lett., 2011, 65, 2498–2501 CrossRef CAS.
- F. Kayaci, C. Ozgit-Akgun, I. Donmez, N. Biyikli and T. Uyar, ACS Appl. Mater. Interfaces, 2012, 4, 6185–6194 CrossRef CAS PubMed.
- S. Zivanovic, J. Li, P. M. Davidson and K. Kit, Biomacromolecules, 2007, 8, 1505–1510 CrossRef CAS PubMed.
- F. Cheng, J. Gao, L. Wang and X. Hu, J. Appl. Polym. Sci., 2015, 132 DOI:10.1002/app.42060.
- J. M. Deitzel, J. Kleinmeyer, J. Hirvonen and N. B. Tan, Polymer, 2001, 42, 8163–8170 CrossRef CAS.
- Y.-Q. Wan, J.-H. He, J.-Y. Yu and Y. Wu, J. Appl. Polym. Sci., 2007, 103, 3840–3843 CrossRef CAS.
- W. K. Son, J. H. Youk, T. S. Lee and W. H. Park, Polymer, 2004, 45, 2959–2966 CrossRef CAS.
- A. Bera, R. M. Gol, S. Chatterjee and S. K. Jewrajka, Desalination, 2015, 360, 108–117 CrossRef CAS.
- H. Lee, J. Ryu, J. R. Kim, M. Kim, I. S. Kim and D. Sohn, Polymer, 2017, 129, 221–227 CrossRef CAS.
- S. Ghosh, J. D. Cabral, L. R. Hanton and S. C. Moratti, Acta Biomater., 2016, 29, 206–214 CrossRef CAS PubMed.
- T. Jurkin and I. Pucić, Radiat. Phys. Chem., 2012, 81, 1303–1308 CrossRef CAS.
- C. Zhou, Q. Wang and Q. Wu, Carbohydr. Polym., 2012, 87, 1779–1786 CrossRef CAS.
- M. Şimşek, S. Çakmak and M. Gümüşderelioğlu, J. Polym. Res., 2016, 23, 236 CrossRef.
- C. Deeley, D. Kline, J. Sauer and A. Woodward, J. Polym. Sci., 1958, 28, 109–120 CrossRef CAS.
- C. Zhou, Q. Wu, Y. Yue and Q. Zhang, J. Colloid Interface Sci., 2011, 353, 116–123 CrossRef CAS PubMed.
- J. Tian, W. Yu and C. Zhou, Polymer, 2006, 47, 7962–7969 CrossRef CAS.
- R. Clough, Nucl. Instrum. Methods Phys. Res., Sect. B, 2001, 185, 8–33 CrossRef CAS.
- A. Bhattacharya, Prog. Polym. Sci., 2000, 25, 371–401 CrossRef CAS.
- J.-B. Zeng, Q.-Y. Zhu, Y.-D. Li, Z.-C. Qiu and Y.-Z. Wang, J. Phys. Chem. B, 2010, 114, 14827–14833 CrossRef CAS PubMed.
- M. Avella, E. Martuscelli and P. Greco, Polymer, 1991, 32, 1647–1653 CrossRef CAS.
- S. Wang, M. J. Yaszemski, A. M. Knight, J. A. Gruetzmacher, A. J. Windebank and L. Lu, Acta Biomater., 2009, 5, 1531–1542 CrossRef CAS PubMed.
- H. Kupfer and G. Wolf, Nucl. Instrum. Methods Phys. Res., Sect. B, 2000, 166, 722–731 CrossRef.
- O. Güven, A. Alacakir and E. Tan, Radiat. Phys. Chem., 1997, 50, 165–170 CrossRef.
- E. Dražević, K. Košutić, V. Dananić and D. M. Pavlović, Sep. Purif. Technol., 2013, 118, 530–539 CrossRef.
- A. Nabe, E. Staude and G. Belfort, J. Membr. Sci., 1997, 133, 57–72 CrossRef.
- C. Y. Tang, Y.-N. Kwon and J. O. Leckie, J. Membr. Sci., 2007, 290, 86–94 CrossRef CAS.
- A. Sarkar, P. I. Carver, T. Zhang, A. Merrington, K. J. Bruza, J. L. Rousseau, S. E. Keinath and P. R. Dvornic, J. Membr. Sci., 2010, 349, 421–428 CrossRef CAS.
- J.-H. Kim, P.-K. Park, C.-H. Lee and H.-H. Kwon, J. Membr. Sci., 2008, 321, 190–198 CrossRef CAS.
- F. Yan, H. Chen, Y. Lü, Z. Lü, S. Yu, M. Liu and C. Gao, J. Membr. Sci., 2016, 513, 108–116 CrossRef CAS.
- K. T. Hong, H. Imadojemu and R. Webb, Exp. Therm. Fluid Sci., 1994, 8, 279–285 CrossRef CAS.
- Q. Wang, T. Niu, L. Wang, C. Yan, J. Huang, J. He, H. She, B. Su and Y. Bi, Chem. Eng. J., 2018, 337, 506–514 CrossRef CAS.
- L. Wang, P. Jin, S. Duan, H. She, J. Huang and Q. Wang, Sci. Bull., 2019, 64, 926–933 CrossRef.
- Q. Wang, L. Zheng, Y. Chen, J. Fan, H. Huang and B. Su, J. Alloys Compd., 2015, 637, 127–132 CrossRef CAS.
- J. Chen, Y. Xia and Q. Dai, Electrochim. Acta, 2015, 165, 277–287 CrossRef CAS.
- B. Gao, S. Dong, J. Liu, L. Liu, Q. Feng, N. Tan, T. Liu, L. Bo and L. Wang, Chem. Eng. J., 2016, 304, 826–840 CrossRef CAS.
- H.-P. Lin, C.-C. Chen, W. W. Lee, Y.-Y. Lai, J.-Y. Chen, Y.-Q. Chen and J.-Y. Fu, RSC Adv., 2016, 6, 2323–2336 RSC.
- K. Zhou, X.-D. Xie and C.-T. Chang, Appl. Surf. Sci., 2017, 416, 248–258 CrossRef CAS.
- Y. Zhang, Y. Shao, N. Gao, Y. Gao, W. Chu, S. Li, Y. Wang and S. Xu, Chem. Eng. J., 2018, 333, 85–91 CrossRef CAS.
- L. A. Autilio, S. H. Appel, P. Pettis and P. L. Gambetti, Biochemistry, 1968, 7, 2615–2622 CrossRef CAS PubMed.
- D. Perlman, in Methods in enzymology, Elsevier, 1979, vol. 58, pp. 110–116 Search PubMed.
- C. Lafarge-Frayssinet, S. Robbana-Barnat, C. Frayssinet, L. Toucas and F. Decloitre, Mutat. Res. Genet. Toxicol., 1994, 320, 207–215 CrossRef CAS.
- S. Robbana-Barnat, F. Decloitre, C. Frayssinet, J. Seigneurin, L. Toucas and C. Lafarge-Frayssinet, Drug Chem. Toxicol., 1997, 20, 239–253 CrossRef CAS PubMed.
- J. J. Jimenez, J. G. Jimenez, D. Daghistani and A. A. Yunis, Am. J. Med. Sci., 1990, 300, 350–353 CrossRef CAS PubMed.
- R. Chen, G. Cheng, M. H. So, J. Wu, Z. Lu, C.-M. Che and H. Sun, Mater. Res. Bull., 2010, 45, 654–658 CrossRef CAS.
- Y. Huang, D. Zhu, Q. Zhang, Y. Zhang, J.-j. Cao, Z. Shen, W. Ho and S. C. Lee, Appl. Catal., B, 2018, 234, 70–78 CrossRef CAS.
Footnotes |
| † Electronic supplementary information (ESI) available. See DOI: 10.1039/c9ra06346c |
| ‡ These authors contributed equally. |
| This journal is © The Royal Society of Chemistry 2019 |