 Open Access Article
Facile synthesis of mesoporous carbon microspheres/graphene composites in situ for application in supercapacitors
Jing
Chen†
a,
Youliang
Cheng†
a,
Qingling
Zhang
a,
Changqing
Fang
 *a,
Linlin
Wu
a,
Mengsha
Bai
a and
Yongtao
Yao
b
aXi'an University of Technology, Xi'an 710048, P. R. China. E-mail: fcqxaut@163.com; Fax: +86 29 82312512; Tel: +86 29 82312038
bNational Key Laboratory of Science and Technology on Advanced Composites in Special Environments, Harbin Institute of Technology, Harbin 150001, P. R. China
First published on 10th October 2019
Abstract
Mesoporous carbon/graphene composites (MCG) have exhibited good electrochemical performances; however, the fixed mesoporous carbon, the low specific surface area, and porosity are the main obstacles in their application in supercapacitors. In this paper, mesoporous carbon microspheres/graphene composites (MCMG) were synthesized in situ via a soft template method and subsequent thermal reduction by using cetyltrimethylammonium bromide (CTAB) as the structure-directing agent, and aqueous mesophase pitch (AMP) and graphene oxide (GO) as the carbon sources. The strong electrostatic interaction between GO/CTAB and AMP promoted the self-assembly of CTAB and AMP to form the MCMG precursor. The results showed that the CTAB concentration and aging temperature have an important effect on the morphology and pore structure of the synthesized MCMG. The high aging temperature promoted the formation of mesoporous carbon spheres and its diameter increased with the increase in the concentration of CTAB. The as-prepared MCMG at the aging temperature of 140 °C had obvious spherical and layered carbon materials after carbonization at 900 °C. When the concentration of CTAB was 10.6 g L−1, the formed mesoporous carbon spheres with the diameter of 30–40 nm were uniformly dispersed among the layered graphenes in MCMG-140-0.2 (the aging temperature of 140 °C and the CTAB content of 0.2 g). In addition, its specific surface area was 1150.5 m2 g−1 and the mesopore size was centered at 4.3 nm, 7.9 nm, and 17.1 nm. Compared with the MCMG precursor, the ordered degree of the mesopores for MCMG was reduced due to the high temperature carbonization. Importantly, the specific capacitance of MCMG-140-0.2 at the current density of 0.1 A g−1 was as high as 356.3 F g−1. Moreover, the specific capacitance of MCMG-140-0.2 at 1 A g−1 remained at 278.5 F g−1, the capacitance retention was 92.1% after 6000 cycles, and the coulombic efficiency was over 98% at a high current density of 2 A g−1. Therefore, the as-prepared MCMG can be an excellent candidate for electrode materials in supercapacitors.
1. Introduction
Supercapacitors are one of the most promising energy storage devices, which mainly include carbon-based double-layer capacitors and metal-based pseudocapacitors.1 For the former, many researchers have focused on developing high-performance graphene-based composites as electrode materials by inserting nanoparticles (such as MnO2 nanowires,2 RuO2 nanoparticles,3 Fe3O4 nanoparticles,4 Co3O4 nanoparticles,5 carbon black,6 carbon nanotubes,7 and fullerenes8) into the sheets of graphene. In addition, N-doping of graphene sheets also is an effect strategy for improving its electrochemical performance.9 Recently, mesoporous carbon microspheres/graphene composites (MCMG) consisting of graphene and mesoporous carbon microspheres (MCMs) have found extremely important applications in supercapacitors,10,11 lithium ion batteries,12,13 fuel cells,14 solar cells,15 biosensors,16 catalyst carriers,17 and adsorption separation technology.18 Furthermore, non-spherical mesoporous carbon/graphene composites (MCG) have also attracted researchers' attentions. Lei and co-workers prepared surface functionalized CMK-5 using polydiallyl dimethyl ammonium chloride and assembled them into the layers of oxide graphene (GO) to synthesize the CMK-5/graphene composite, which exhibited excellent electrochemical properties.19 Tu and co-workers used a similar method to insert S-doped CMK-3 into graphene sheets.20 Due to the hydrophobic effect of S, the cycling stability of the CMK-3/graphene composite was improved. Besides, MCG also can be obtained by directly carbonizing the mixture of polymer and GO.21,22 Some researchers have mixed oxidized petroleum pitch and coal tar pitch with GO, and then activated the mixture by KOH to prepare the graphene-based composites rich in mesopores.23,24 Moreover, mesoporous carbon materials derived from petroleum pitch and coal tar pitch also showed excellent electrochemical performances.25,26Recently, Zhao and co-workers incorporated the functionalized mesoporous silica spheres (MSS) with GO and then fabricated 3D MCMG with a specific surface area as high as 1496 m2 g−1 by the CVD method using MSS/GO as the template.27 The MCG with disordered pores can be obtained by using cetyltrimethylammonium chloride (CTACl) or cetyltrimethylammonium bromide (CTAB) as the structure-directing agent and tetraethoxysilane (TEOS) as the silicon source.28,29 When mesoporous silica/GO composites obtained by the triblock copolymer PEO20PPO70PEO20 (P123) were used as the hard template, MCG with different pores and morphologies were prepared.30 In addition, MCG also can be constructed after synthesizing the silica/carbon/GO composites using the triblock copolymer PEO106PPO70PEO106 (F127) as the structure-directing agent.31 The above mentioned studies usually concern the removal of the silica template, which may destroy some pore channels.
Instead, the soft templates for synthesizing mesoporous carbon materials are easily removed during the subsequent carbonization process. Moreover, different mesoporous pores are feasibly achieved by changing the templates. Therefore, the soft template method has been applied in the synthesis of MCMG and MCG.32 Jin and co-workers prepared cylindrical MCG with the specific surface area of 400 m2 g−1 by using F127 as the template and phenolic resin as the carbon source, which can be applied in fuel batteries.33 The precursor was constructed by depending on the strong hydrogen bonds between F127, GO, and the phenolic resin, and then MCG with high specific surface area and excellent conductivity was obtained by subsequent thermal reduction.34 After stripping GO by an ultrasonic method, MCG with a specific surface area of 545.8 m2 g−1 was synthesized by the soft template method, exhibiting a specific capacitance of 242 F g−1 in 6 M KOH as the electrolyte.35
Due to the limitation of template concentration and the type of carbon source, mesoporous carbon in the composites synthesized via a soft template method showed flaky or irregular shapes in the previous reports.32–35 It was required to synthesize MCM or MSS before constructing MCMG,27,34,36 and then the morphology of mesoporous carbon and the mesoporous structure was quite difficult to control in situ. To resolve the above problems, the MCMG precursors were synthesized in situ using CTAB as the structure-directing agent and aqueous mesophase pitch (AMP) as the carbon source in the GO dispersion in this work. Then, MCMG were obtained by removing CTAB via subsequent high-temperature carbonization. The effects of aging temperature and CTAB concentration on the morphology and microstructure of the MCMG were investigated. When the aging temperature was 140 °C and the CTAB concentration was 10.6 g L−1, the as-prepared MCMG sample rich in mesopores had the specific surface area as high as 1150.5 m2 g−1 and the diameter of the formed mesoporous carbon spheres was in the range of 30–40 nm. Furthermore, they exhibited excellent electrochemical performances when used as electrode materials in supercapacitors.
2. Experimental
2.1. Materials
Natural graphite was purchased from Sinopharm Chemical Reagent Co. Ltd. Coal tar pitch was purchased from Wuhan Iron and Steel Co. Ltd. Concentrated H2SO4 (98%), concentrated HNO3 (68%), concentrated HCl (36%), and NaOH were purchased from Xi'an Chemical Reagent Factory. KMnO4, NaNO3, H2O2 (30%), CTAB, and KBr were purchased from Tianjin Chemical Reagent Co. Ltd. Deionized water was used throughout the experiments and all the chemicals were used without any further purification.2.2. Preparation of AMP
AMP was prepared by oxidizing coal tar pitch, alkali re-dissolution, and subsequent acid precipitation process.37 Typically, 5 g of coal tar pitch was added into 100 mL of the mixed acid (the volume ratio of concentrated HNO3 and concentrated H2SO4 was 3![[thin space (1/6-em)]](https://www.rsc.org/images/entities/char_2009.gif) :
:![[thin space (1/6-em)]](https://www.rsc.org/images/entities/char_2009.gif) 7) with stirring at 80 °C. After keeping for 1 h in a water bath, the obtained black product was poured into a 1000 mL beaker with 500 mL of deionized water and was left undisturbed for 6 h. The supernatant was decanted and the filtrated materials were washed with deionized water until the filtrate became neutral. The obtained product was dissolved in 1 M NaOH solution so that the pH of the system was above 12 and stirred at 80 °C for 1 h. Subsequently, the above solution was filtrated and then 1 M HCl was added dropwise into the filtrate until the pH of the solution was below 2. After leaving undisturbed for 12 h, the precipitate was collected by centrifugation and washed with deionized water 3 times to remove the acid, followed by drying at 100 °C in a vacuum oven to obtain the AMP product.
7) with stirring at 80 °C. After keeping for 1 h in a water bath, the obtained black product was poured into a 1000 mL beaker with 500 mL of deionized water and was left undisturbed for 6 h. The supernatant was decanted and the filtrated materials were washed with deionized water until the filtrate became neutral. The obtained product was dissolved in 1 M NaOH solution so that the pH of the system was above 12 and stirred at 80 °C for 1 h. Subsequently, the above solution was filtrated and then 1 M HCl was added dropwise into the filtrate until the pH of the solution was below 2. After leaving undisturbed for 12 h, the precipitate was collected by centrifugation and washed with deionized water 3 times to remove the acid, followed by drying at 100 °C in a vacuum oven to obtain the AMP product.
2.3. Synthesis of MCMG
The GO used in this work was prepared by modified Hummer's method.38 A certain amount of GO was added into NaOH solution (pH = 12) and sonicated for 1 h to obtain 0.6 mg mL−1 GO solution. The appropriate amount of CTAB was added into the above GO solution with stirring until CTAB was completely dissolved to obtain GO/CTAB dispersion. Subsequently, 0.3 g of AMP was added into 190 mL of GO/CTAB dispersion with stirring for 1 h at 30 °C in a water bath. The above mixture was transferred to a 200 mL hydrothermal reactor with Teflon lining and then aged at the setting temperature for 48 h. The obtained mixture was filtrated and washed with deionized water, then dried to get the MCMG precursor. The content of CTAB was set as 0.06 g, 0.1 g, 0.15 g, 0.2 g, 0.24 g, and 0.3 g (the concentration was 3.1 g L−1, 5.3 g L−1, 7.9 g L−1, 10.6 g L−1, 12.6 g L−1, and 15.8 g L−1, respectively). The mass ratio of AMP to CTAB was 5![[thin space (1/6-em)]](https://www.rsc.org/images/entities/char_2009.gif) :
:![[thin space (1/6-em)]](https://www.rsc.org/images/entities/char_2009.gif) 1, 3
1, 3![[thin space (1/6-em)]](https://www.rsc.org/images/entities/char_2009.gif) :
:![[thin space (1/6-em)]](https://www.rsc.org/images/entities/char_2009.gif) 1, 2
1, 2![[thin space (1/6-em)]](https://www.rsc.org/images/entities/char_2009.gif) :
:![[thin space (1/6-em)]](https://www.rsc.org/images/entities/char_2009.gif) 1, 3
1, 3![[thin space (1/6-em)]](https://www.rsc.org/images/entities/char_2009.gif) :
:![[thin space (1/6-em)]](https://www.rsc.org/images/entities/char_2009.gif) 2, 5
2, 5![[thin space (1/6-em)]](https://www.rsc.org/images/entities/char_2009.gif) :
:![[thin space (1/6-em)]](https://www.rsc.org/images/entities/char_2009.gif) 4, and 1
4, and 1![[thin space (1/6-em)]](https://www.rsc.org/images/entities/char_2009.gif) :
:![[thin space (1/6-em)]](https://www.rsc.org/images/entities/char_2009.gif) 1, respectively. The aging temperature was set as 130 °C and 140 °C, respectively. The carbonization process of the MCMG precursors under N2 atmosphere was as follows: the heating rate was set as 1 °C min−1 in the range of 25–220 °C, 2 °C min−1 in the range of 220–450 °C, and 3 °C min−1 in the range of 450–900 °C. In addition, the soaking time at 450 °C and 900 °C was 2 h. Finally, the reaction system was naturally cooled to room temperature and MCMG was obtained. The as-prepared MCMG samples under the conditions of different CTAB concentrations and aging temperatures were labeled as MCMG-x-y, where “x” was the aging temperature and “y” was the CTAB mass.
1, respectively. The aging temperature was set as 130 °C and 140 °C, respectively. The carbonization process of the MCMG precursors under N2 atmosphere was as follows: the heating rate was set as 1 °C min−1 in the range of 25–220 °C, 2 °C min−1 in the range of 220–450 °C, and 3 °C min−1 in the range of 450–900 °C. In addition, the soaking time at 450 °C and 900 °C was 2 h. Finally, the reaction system was naturally cooled to room temperature and MCMG was obtained. The as-prepared MCMG samples under the conditions of different CTAB concentrations and aging temperatures were labeled as MCMG-x-y, where “x” was the aging temperature and “y” was the CTAB mass.
2.4. Characterization
The morphology and structure of samples were investigated by high resolution transmission electron microscopy (TEM, JEOL-3010) and scanning electron microscopy (SEM, SU-8000). Small angle X-ray diffraction (SAXRD) patterns were obtained by using an X-ray diffractometer (XRD Shimadzu Limited XRD-700) with a Cu Kα radiation source (λ ≈ 1.54 Å) in the range of 0.5–5.5°. The elemental analysis was performed on an X-ray photoelectron spectroscopy instrument (XPS AXIS Ultra Kratos Analytical Ltd). The BET specific surface area (SBET) and Barrett–Joyner–Halenda (BJH) pore size distribution were measured on a NOVA4200e surface area analyzer by using the N2 gas adsorption/desorption isotherm. Fourier transform infrared (FTIR) spectra were recorded by a FTIR-8400S spectrometer. The samples and KBr were pressed to form thin plates (the mass of KBr and the as-prepared sample was about 200 mg and 2 mg, respectively) for obtaining the FTIR spectra. Thermogravimetric analysis (TGA) was carried out using a F2009 TG analyzer in the range of 25–900 °C at a heating rate of 10 °C min−1 under N2 flow. The zeta potential of the samples was measured by using a Zetasizer ZEN 3500 potentiometer in the pH range of 7–13.2.5. Electrochemical measurements
The cyclic voltammetry (CV) curves and the electrochemical impedance spectra (EIS) of the MCMG samples were measured by a CHI660C electrochemical workstation using the two-electrode method. The working electrodes were fabricated by mixing the prepared powders with acetylene black and polyvinylidene fluoride (PVDF) binder and the mass ratio was 8![[thin space (1/6-em)]](https://www.rsc.org/images/entities/char_2009.gif) :
:![[thin space (1/6-em)]](https://www.rsc.org/images/entities/char_2009.gif) 1
1![[thin space (1/6-em)]](https://www.rsc.org/images/entities/char_2009.gif) :
:![[thin space (1/6-em)]](https://www.rsc.org/images/entities/char_2009.gif) 1. The appropriate amount of N-methylpyrrolidone (NMP) was added into the mixture to form a paste. Subsequently, the mixture was pressed onto a nickel foam and dried at 100 °C for 12 h in a vacuum oven. The active area of the electrode was about 1 cm2, the mass loading of the active materials was about 5 mg, and 4 M KOH solution was used as the electrolyte. According to the symmetric supercapacitor, two carbon-based electrodes with substantially equal mass were assembled into a button cell. The potential for CV was in the range of 0–0.8 V at the scanning rate of 10–200 mV s−1. The EIS was tested in the frequency range of 10−2–105 Hz. The galvanostatic charge–discharge (GCD) and cycle measurements were performed on the LANDdt V7 test system. The current density was in the range of 0.1–2 A g−1 and the potential was in the range of 0–1 V during the GCD measurements.
1. The appropriate amount of N-methylpyrrolidone (NMP) was added into the mixture to form a paste. Subsequently, the mixture was pressed onto a nickel foam and dried at 100 °C for 12 h in a vacuum oven. The active area of the electrode was about 1 cm2, the mass loading of the active materials was about 5 mg, and 4 M KOH solution was used as the electrolyte. According to the symmetric supercapacitor, two carbon-based electrodes with substantially equal mass were assembled into a button cell. The potential for CV was in the range of 0–0.8 V at the scanning rate of 10–200 mV s−1. The EIS was tested in the frequency range of 10−2–105 Hz. The galvanostatic charge–discharge (GCD) and cycle measurements were performed on the LANDdt V7 test system. The current density was in the range of 0.1–2 A g−1 and the potential was in the range of 0–1 V during the GCD measurements.
3. Results and discussion
3.1. Morphologies of the as-prepared composites
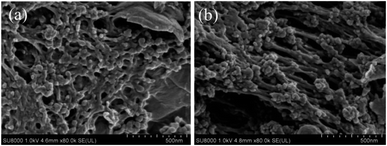
The SEM images of the MCMG precursors obtained at different aging temperatures are shown in Fig. 1. Obviously, there are a large number of carbon particles with the diameter of about 30–40 nm on the surface of the MCMG precursors, which are cross-linked with each other similar to lamella depending on the GO surface and assembled to form interconnected macropores in the MCMG precursors.19,27 Furthermore, the size of the particles in the MCMG-140-0.2 precursor is smaller than that in the MCMG-130-0.2 precursor. Therefore, the morphologies of the MCMG precursors illustrate that the introduction of GO plays a guiding role in the formation of the lamella.The SEM images of the as-prepared MCMG obtained with different CTAB concentrations at the aging temperature of 140 °C are shown in Fig. 2. It can be observed that the MCMG samples incorporated the layered and spherical materials. The wrinkled layered portion in the samples represents the reduced graphene formed via the high-temperature carbonization (as shown in Fig. 2(a–c)). Among these samples, the quasi-spherical materials on the surface of the MCMG is because the mesoporous carbon spheres are not formed when the concentration of CTAB was low (the concentration was 3.1 g L−1, 5.3 g L−1, and 7.9 g L−1). Nevertheless, the spherical materials on the surface of the MCMG samples were significantly observed when the concentration of CTAB was high (as shown in Fig. 2(d–f)). When the concentration of CTAB was 10.6 g L−1, the spherical particles with uniform distribution have the diameter of about 30–40 nm. There are inhomogeneous particles with the diameter of about 20–300 nm in the sample of MCMG-140-0.24 (the CTAB concentration was 12.6 g L−1). When the mass of the added CTAB increased to 0.3 g (the concentration was 15.8 g L−1), the surface of the obtained MCMG-140-0.3 was covered with uneven spherical particles with a large diameter of 200–800 nm. The increase in the diameter of the carbon spheres is due to strong electrostatic interactions between CTAB and AMP with a higher concentration of CTAB, which is similar to the previous report.39
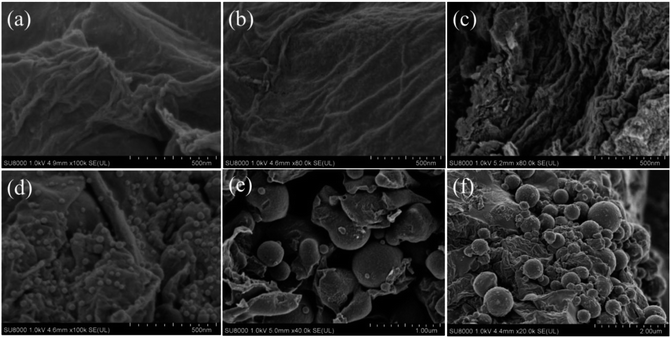 | ||
| Fig. 2 SEM images of (a) MCMG-140-0.06, (b) MCMG-140-0.1, (c) MCMG-140-0.15, (d) MCMG-140-0.2, (e) MCMG-140-0.24, and (f) MCMG-140-0.3. | ||
The TEM images of the as-prepared MCMG samples are shown in Fig. 3. The surface of MCMG-130-0.2 has lamellar structures and irregular mesopores (as shown in Fig. 3(a and f)), which is due to the collapse of the precursor structure via carbonization at 900 °C. In addition, these irregular and disordered mesopores were derived from the precursor formed by CTAB and AMP. The MCMG-140-0.2 has carbon spheres among the graphenes (as shown in Fig. 3(c)), which constructed the sandwich composites with layered graphenes. Furthermore, the microsphere consists of many worm-like and partially ordered mesopores (as shown in Fig. 3(g)). According to the high-resolution images of MCMG-130-0.2 and MCMG-140-0.2, it is further proved that the MCMG samples obtained at the aging temperature of 130 °C and 140 °C have many mesopores. The MCMG-140-0.2 synthesized via self-assembly at the aging temperature of 140 °C shows a sandwich structure constructed by the mesoporous carbon spheres and graphenes. However, there are no obvious microspheres in the sample obtained at the aging temperature of 130 °C. The particles in MCMG-140-0.1 and MCMG-140-0.15 are more agglomerated and the graphenes are stacked unevenly (as shown in Fig. 3(b and c)). When the concentration of CTAB was in the range of 10.6–12.6 g L−1, the carbon spheres with different diameters (as shown in Fig. 3(d and e)) are uniformly distributed among the layered graphenes, indicating that MCMG with sandwich structure have been successfully synthesized. However, the sample of MCMG-140-0.24 contains a few carbon microspheres with the diameter of several hundred nanometers. The TEM results are in accordance with the SEM analysis.
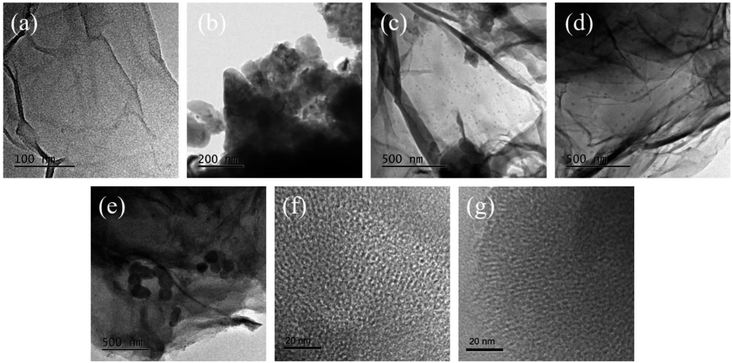 | ||
| Fig. 3 TEM images of (a) MCMG-130-0.2, (b) MCMG-140-0.1, (c) MCMG-140-0.15, (d) MCMG-140-0.2, (e) MCMG-140-0.24, the high resolution TEM images of (f) MCMG-130-0.2 and (g) MCMG-140-0.2. | ||
3.2. Pore structure and microstructure of the MCMG precursor and MCMG
The nitrogen adsorption–desorption isotherms and pore size distribution curves of the MCMG-140-0.2 precursor and MCMG-140-0.2 are shown in Fig. 4. Both of the isotherms exhibit type IV adsorption curve and H2 type hysteresis loop (as shown in Fig. 4(a)), indicating that the two samples have a large amount of mesopores with a slit shape.35,39 This is consistent with the TEM result for MCMG-140-0.2 in Fig. 3(g). In the relative pressure region of 0.3–0.9, the MCMG-140-0.2 precursor shows a bigger loop, indicating that more mesopores exist in this MCMG sample. Moreover, some macropores exist in the MCMG precursor and the MCMG sample, according to the curve in the high pressure region (P/P0 > 0.9). The SBET and pore volume for the MCMG-140-0.2 precursor and MCMG-140-0.2 are 463.4 m2 g−1, 0.51 cm3 g−1 and 1150.5 m2 g−1, 0.86 cm3 g−1, respectively. The higher SBET and larger pore volume of MCMG-140-0.2 suggest the formation of more mesopores and micropores in the MCMG sample during the carbonization of the MCMG precursor. According to the BJH pore size distribution curve (as shown in Fig. 4(b)), the pore size of the MCMG-140-0.2 precursor is centered at 3.8 nm, 5.5 nm, and 11.9 nm. In addition, the pore size of MCMG-140-0.2 is centered at 4.3 nm, 7.9 nm, and 17.1 nm. Compared with the results, the carbon skeleton shrinks during carbonizing but the pore size increases a little due to the elimination of light components such as CO2, NH3, NO2, small molecular alkenes and alkanes. However, it is very difficult to observe large mesopores (such as 17.1 nm), according to the TEM images for the MCMG samples.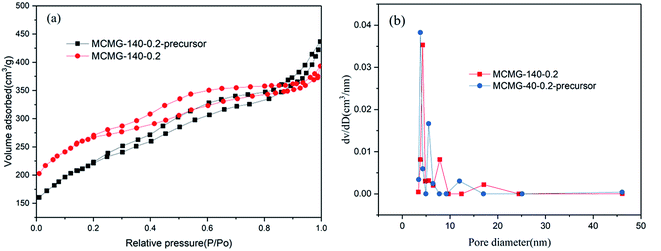 | ||
| Fig. 4 (a) N2 adsorption–desorption isotherms and (b) the pore size distribution of the MCMG-140-0.2 precursor and MCMG-140-0.2. | ||
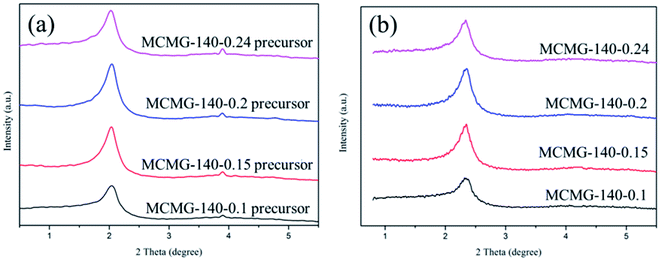
The SAXRD patterns of the as-prepared samples are shown in Fig. 5. The samples of the MCMG precursors show an obvious diffraction peak at around 2° (as shown in Fig. 5(a)) that can be indexed as the (210) reflection of the cubic structure, suggesting that they contain long-range ordered lyotropic liquid crystals.29,40 In addition, these samples show a weak diffraction peak at around 3.9°, indicating that the short-range ordered mesopores may exist in the MCMG precursors. The intensity of the diffraction peak increases with an increase in the CTAB content, indicating that the ordered degree of the mesopores is improved due to the sufficient self-assembly between the AMP and CTAB molecules. Nevertheless, the diffraction peaks of the MCMG samples shift to a higher angle (about 2.3°) and the intensity is weakened (as shown in Fig. 5(b)), which is due to the shrinkage of the carbon skeleton and the collapse of the partial pore channels during carbonization at 900 °C. Therefore, the ordered degree of the mesopores in the MCMG reduces. When the mass ratios of AMP to CTAB were 3![[thin space (1/6-em)]](https://www.rsc.org/images/entities/char_2009.gif) :
:![[thin space (1/6-em)]](https://www.rsc.org/images/entities/char_2009.gif) 2 and 5
2 and 5![[thin space (1/6-em)]](https://www.rsc.org/images/entities/char_2009.gif) :
:![[thin space (1/6-em)]](https://www.rsc.org/images/entities/char_2009.gif) 4, the diffraction peak for the synthesized MCMG samples at 2.3° is sharp. Therefore, the CTAB concentration in the range of 10.6–12.6 g L−1 is favorable for forming the mesoporous structure in MCMG.
4, the diffraction peak for the synthesized MCMG samples at 2.3° is sharp. Therefore, the CTAB concentration in the range of 10.6–12.6 g L−1 is favorable for forming the mesoporous structure in MCMG.
The XPS spectra of MCMG-140-0.1 and MCMG-140-0.2 are shown in Fig. 6. The full XPS spectra for MCMG-140-0.1 and MCMG-140-0.2 are almost the same (as shown in Fig. 6(a)), and the characteristic peaks at around 283 and 530 eV represent C 1s and O 1s, respectively. Furthermore, three fitting peaks for C 1s at 284.6, 286.3, and 289.3 eV in the fitting curves (as shown in Fig. 6(b and c)) correspond to C–C, C–O, and C![[double bond, length as m-dash]](https://www.rsc.org/images/entities/char_e001.gif) O, respectively.41 In addition, the oxygen content for MCMG-140-0.1 and MCMG-140-0.2 is 5.4 at% and 4.9 at%, respectively. Therefore, the compositions of the as-prepared MCMG samples have no obvious differences except for the different contents of oxygen.
O, respectively.41 In addition, the oxygen content for MCMG-140-0.1 and MCMG-140-0.2 is 5.4 at% and 4.9 at%, respectively. Therefore, the compositions of the as-prepared MCMG samples have no obvious differences except for the different contents of oxygen.
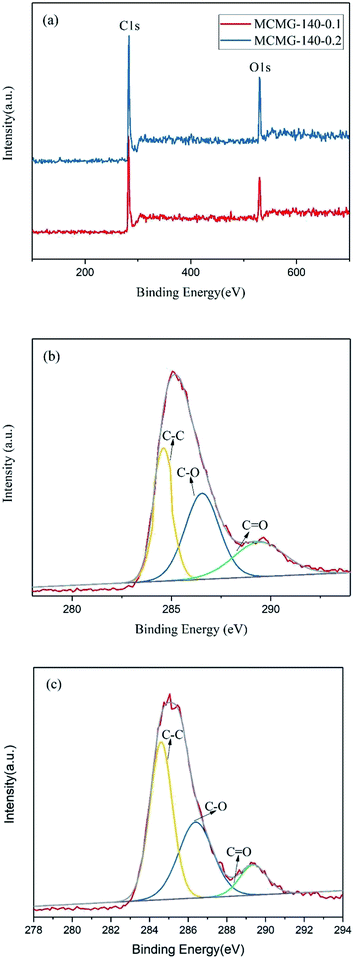 | ||
| Fig. 6 (a) XPS spectra of MCMG-140-0.1 and MCMG-140-0.2, (b) C 1s spectra of MCMG-140-0.1, (c) C 1s spectra of MCMG-140-0.2. | ||
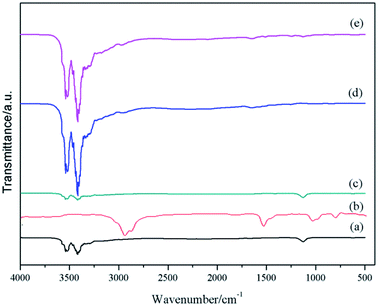
The FTIR spectra of the raw materials, MCMG-140-0.2 precursor, and MCMG-140-0.2 are shown in Fig. 7. According to the spectrum of the MCMG-140-0.2 precursor, the absorption bands at 2850–3000 cm−1 are ascribed to the stretching vibration of methyl and methylene, which are the characteristic absorption peaks of CTAB.42 In addition, the absorption peak at about 1123 cm−1 is ascribed to the stretching vibration of carbonyl in AMP and GO.39,43 The absorption bands at 3000–3522 cm−1 in the spectra of GO and MCMG-140-0.2 are ascribed to the stretching vibration of hydroxyl and hydrogen bonds. The FTIR spectrum of AMP is similar to that of the MCMG-140-0.2 precursor. Compared with the MCMG-140-0.2 precursor, the absorption peak of MCMG-140-0.2 at 2900 cm−1 disappears but the weak absorption peaks in the range of 3000–3500 cm−1 remain, indicating that the structure-directing agent CTAB has been removed via the carbonization process.
3.3. Thermal analysis of the samples
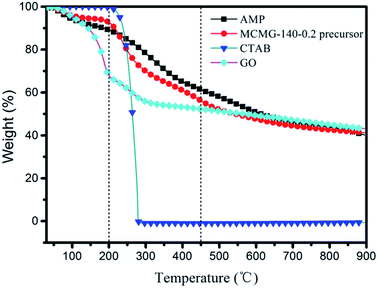
As shown in Fig. 8, TGA of GO, CTAB, AMP, and MCMG-140-0.2 precursors was carried out in the temperature range of 25–900 °C at a heating rate of 10 °C min−1 under N2 flow. CTAB exhibits 100 wt% weight loss in the range of 200–285 °C, indicating that the structure-directing agent is decomposed completely before 300 °C. In the range of 25–230 °C, the weight loss of AMP, GO, and the MCMG-140-0.2 precursor is mainly ascribed to the removal of adsorbed H2O. Compared with AMP, the weight loss of the MCMG-140-0.2 precursor is lower before 230 °C, which may be ascribed to the restriction of porous structure to H2O. In the range of 230–500 °C, some small molecules are removed and partial oxygen-containing functional groups begin to decompose in AMP (29.8 wt% weight loss).39 Importantly, in the range of 230–285 °C, the weight loss of MCMG-140-0.2 is higher than that of AMP due to the decomposition of CTAB. Compared with GO, the weight loss of the MCMG-140-0.2 precursor is lower before 500 °C, which may be due to the strong electrostatic interactions between the AMP molecules and the GO/CTAB composites. When the temperature exceeded 600 °C, GO, AMP, and the MCMG-140-0.2 precursor underwent slow weight loss, mainly corresponding to the removal of heteroatoms.44 The results of TGA show that CTAB can be effectively removed by carbonization at 900 °C and the open pores in MCMG are thus obtained. Furthermore, the TGA results are in accordance with the FTIR analysis.3.4. Electrochemical performances of the MCMG samples
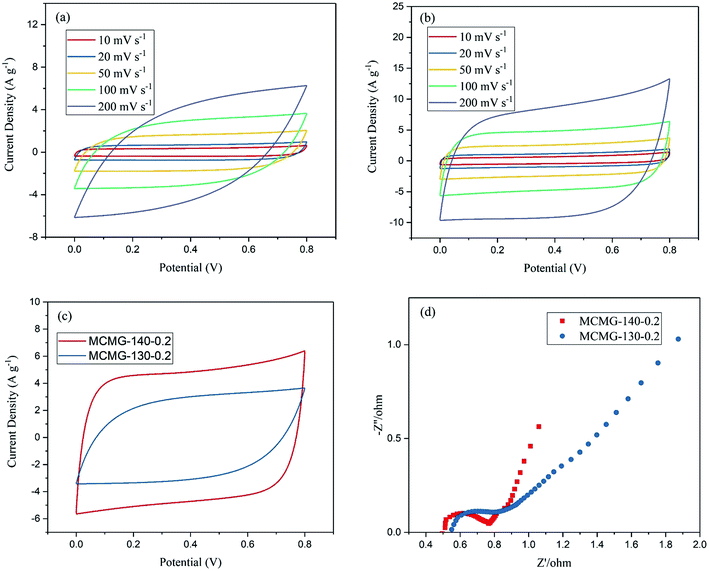
Fig. 9 shows the CV curves and EIS plots of MCMG-130-0.2 and MCMG-140-0.2 using 4 M KOH solution as the electrolyte. We find that all of the CV curves for the two samples remain quasi-rectangular in shape in the potential range of 0–0.8 V at the scanning rate of 10–200 mV s−1 and the electrolyte shows no dissociation, according to the CV curves (as shown in Fig. 9(a and b)), suggesting an excellent capacitive behavior and a high stability for the electrodes. To distinguish the electrochemical performance of MCMG-140-0.2 and MCMG-130-0.2, the CV curves of the two samples at 100 mV s−1 are shown in Fig. 9(c). We found that the CV curve area for MCMG-140-0.2 is larger than that for MCMG-130-0.2, confirming that the former possesses a higher specific capacitance. According to the results of TEM and nitrogen adsorption–desorption isotherms, the formed mesoporous carbon microspheres separate the graphene layers well for the MCMG-140-0.2 sample, providing a high specific surface area and abundant mesopores, which is beneficial for the improvement of specific capacitance for the sample.The EIS plots of MCMG-130-0.2 and MCMG-140-0.2 are shown in Fig. 9(d). It is noted that the high slope and the line morphology imply that the as-prepared samples with many pores are good for use as electrode materials in supercapacitors.45 We found that the slopes for MCMG-130-0.2 and MCMG-140-0.2 in the low frequency region show obvious differences, and the line for the latter is closer to the imaginary axis, indicating that the MCMG-140-0.2 sample will have a better electrochemical performance. The equivalent series resistance (Rs) is the sum of the resistance of the electrolyte and the intrinsic resistance of the active materials, and the interfacial contact resistance between the active materials and the current collector;46 the intersection on the real axis in the high frequency region represents the value of Rs. In addition, the diameter of the semicircle in the high frequency region represents the value of interface resistance (Rct). The Rs of MCMG-140-0.2 and MCMG-130-0.2 is 0.51 Ω and 0.55 Ω, respectively, and we find that the former is lower than that for many carbon materials used in the supercapacitors. Moreover, the Rct of MCMG-140-0.2 and MCMG-130-0.2 is about 0.26 Ω and 0.29 Ω, respectively, both of which are small.
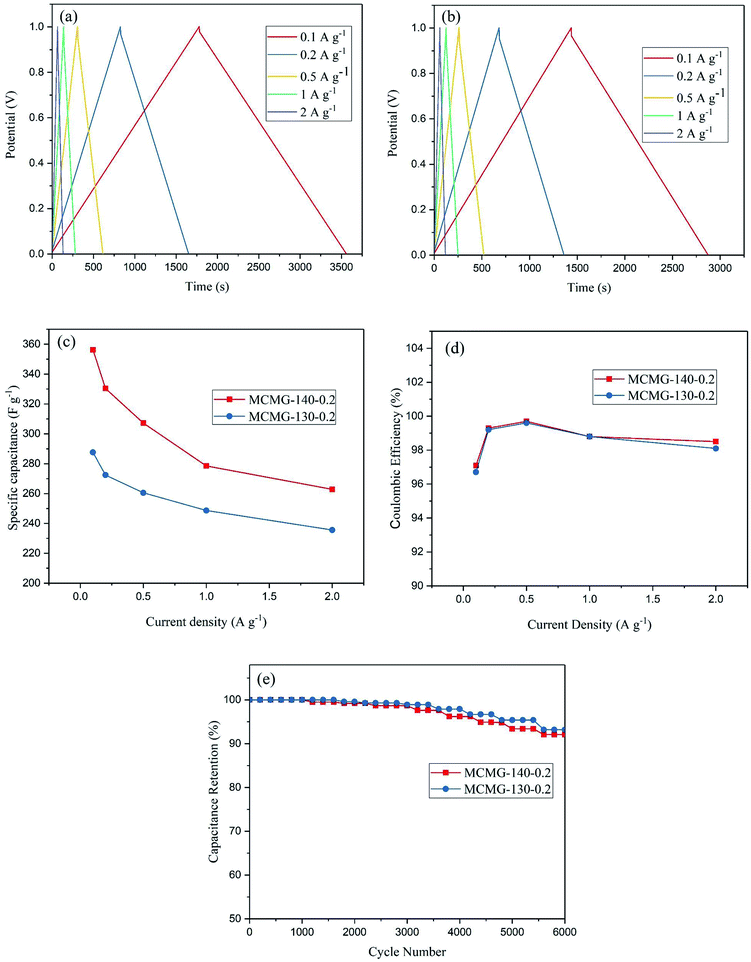
The GCD curves for the two samples at the current density of 0.1–2 A g−1 are shown in Fig. 10(a and b). These curves show symmetric consistency at different current densities, indicating that as-prepared MCMG samples have excellent stability and reversibility of electrochemical performance for supercapacitors. The specific capacitances at the current densities were calculated according to eqn (1) in our previous reports:47,48
 | (1) |
To investigate the cycling stability of the as-prepared MCMG samples, the charge–discharge cycling of MCMG-140-0.2 and MCMG-130-0.2 were tested at the current density of 1 A g−1, and the capacitance retention of the two samples during the cycling is shown in Fig. 10(e). The capacitance retention of MCMG-140-0.2 and MCMG-130-0.2 after 6000 cycles was 92.1% and 93.2%, respectively. The comparison of the specific capacitance in this work with other materials in previous reports is shown in Table 1. We found that the specific capacitance for MCMG is higher than that for most carbon based electrode materials in previous studies and the retention is comparable with that for the mesoporous carbon/graphene composites. Moreover, the high retention after charge–discharge cycling and the high specific capacitance at a high current density are ascribed to the synergy between the graphenes and the mesoporous carbon spheres, indicating that the MCMG-140-0.2 sample possesses excellent cycling stability and rate capability.
| Electrode materials | S BET (m2 g−1) | Specific capacitance | Capacitance retention |
|---|---|---|---|
| NiMn oxide@MnO2 (ref. 1) | — | 801 F g−1 at 1 A g−1 | 96% after 10![[thin space (1/6-em)]](https://www.rsc.org/images/entities/char_2009.gif) 000 cycles 000 cycles |
| Graphene nanosheet/carbon black6 | 586 | 175 F g−1 at 10 mV s−1 | 90.9% after 6000 cycles |
| N-doping of graphene nanoflakes9 | 1000 | 180 F g−1 at 5 mV s−1 | — |
| Mesoporous carbon microspheres10 | 1010 | 171 F g−1 at 1 A g−1 | — |
| Mesoporous carbon/graphene aerogels11 | — | 120 F g−1 at 0.5 A g−1 | — |
| Graphene–CMK-5 (ref. 19) | 1370 | 144 F g−1 at 0.2 A g−1 | 90% after 2000 cycles |
| S-doped micro/mesoporous carbon–graphene21 | 545 | 104 F g−1 at 0.1 A g−1 | 80% after 2000 cycles |
| Microporous carbon/graphene23 | 2164 | 278 F g−1 at 0.05 A g−1 | 93% after 10![[thin space (1/6-em)]](https://www.rsc.org/images/entities/char_2009.gif) 000 cycles 000 cycles |
| Pitch oxide/graphene oxide24 | 2196 | 296 F g−1 at 0.1 A g−1 | |
| Mesoporous carbon spheres/graphene sheets27 | 1496 | 36.4 F g−1 at 0.1 A g−1 | 94% after 1000 cycles |
| Graphene/N-doped ordered mesoporous carbon nanosheet31 | 1569 | 377 F g−1 at 0.2 A g−1 | 95% after 10![[thin space (1/6-em)]](https://www.rsc.org/images/entities/char_2009.gif) 000 cycles 000 cycles |
| Mesoporous carbon/graphene aerogel32 | 254 | 197 F g−1 at 0.5 A g−1 | 93% after 1000 cycles |
| Mesoporous carbon/graphene35 | 549 | 242 F g−1 at 0.5 A g−1 | 105% after 1000 cycles |
| N-doped porous carbon derived from walnut shells41 | 2635 | 462 F g−1 at 1 A g−1 | 94% after 5000 cycles |
| MCMG-140-0.2 (this work) | 1150.5 | 356.3 F g−1 at 0.1 A g−1 | |
| 278.5 F g−1 at 1 A g−1 | 92.1% after 6000 cycles |
It is noted that the ordered mesopores in electrode materials can not only increase their specific surface area but are also beneficial for providing channels for the rapid transport of ions in supercapacitors.49,50 Moreover, small mesopores (2–4 nm) have long diffusion paths for ions, which has negative effects on the electrochemical performances of the electrode materials. Therefore, ordered mesorpores with appropriate pore size in electrode materials are desired for supercapacitors. In this paper, the as-prepared MCMG samples have many mesopores; however, the mesopores in MCMG-130-0.2 are irregular and disordered and that in MCMG-140-0.2 are partially ordered, according to the TEM images. Furthermore, the pore sizes of MCMG-140-0.2 are appropriate and centered at 4.3 nm, 7.9 nm, and 17.1 nm, according to the nitrogen adsorption–desorption isotherm. According to the CV and GCD curves of MCMG-140-0.2, a quasi rectangle and symmetric isosceles triangle with an increase in the scan rate and current density is maintained, indicating that the partially ordered mesopores in MCMG-140-0.2 are beneficial for maintaining the double electrode layer characteristic. In addition, the Rct of MCMG-130-0.2 is higher than that for MCMG-140-0.2. This is because poor regularity and many defects in the mesopores in MCMG-130-0.2 increase the interface resistance. Therefore, partially ordered mesopores with appropriate pore size in the MCMG samples have important effects on improving their electrochemical performances.
3.5. Formation mechanism of MCMG
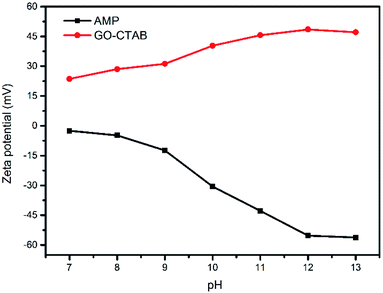
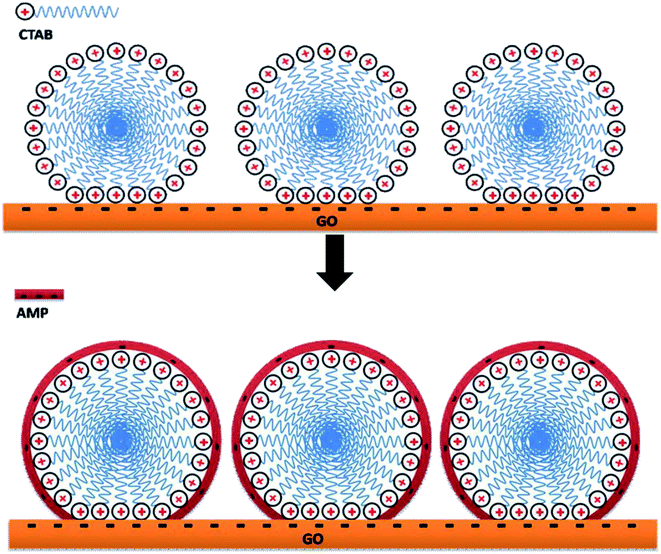
The GO dispersion was negatively charged over a wide pH range due to the ionization of carboxylic acid and hydroxyl groups on the GO surface.51 The pH is beyond 7 because AMP can only be dissolved in an alkaline solution. After the addition of CTAB, the GO/CTAB dispersion was inversed to be completely positively charged in the pH range studied in this work (as shown in Fig. 11) due to the adsorption of CTAB on the GO surface. The zeta potential of the GO/CTAB dispersion changed with the variation in the pH value. The zeta potential of AMP was negatively charged, which is similar to that of the GO dispersion.27,51 The absolute value of the zeta potential of the samples first increases and then decreases with increasing pH. The very high zeta potential of the positively charged GO/CTAB is +48.5 mV at pH = 12 when the concentration of the GO solution was 0.6 mg mL−1 and the concentration of CTAB was 10.6 g L−1 (the CTAB content was 0.2 g). In addition, the very low zeta potential of the AMP dispersion was −55.3 mV at pH = 12 (the AMP content was 0.3 g). Therefore, a strong electrostatic interaction between the GO/CTAB composites and the AMP molecules at pH = 12 (in accordance with the conditions of the experiment in this work) can promote the latter to attach firmly on the surface of GO/CTAB by self-assembly. Then, the CTAB/AMP micelles with spherical shape are formed between the GO sheets, according to the surface energy minimum principle. The MCMG precursors are obtained via subsequent gelling and crosslinking process. The schematic diagram of the self-assembly among GO, CTAB, and AMP is shown in Fig. 12. Finally, the MCMG composites will be synthesized by carbonizing the MCMG precursors.It is noted that the structure-directing agent can form a spherical micelle when its concentration is appropriate.39 When the concentration of CTAB is low, the size of the spherical micelle of CTAB/AMP is small, and the morphology of the obtained mesoporous carbon microspheres in MCMG is difficult to maintain and easily aggregates, according to the TEM images. The diameter of the mesoporous carbon microspheres increases and they can maintain the spherical shape with increasing the concentration of CTAB. When the concentration of CTAB is high, the diameter of the mesoporous carbon microspheres can reach several hundred nanometers. In addition, the concentration of CTAB may have an effect on the pore structure of the obtained mesoporous carbon microspheres. Therefore, the concentration of CTAB has an important role in the morphology of MCMG besides the zeta potential of GO/CTAB.
4. Conclusions
In this work, CTAB was used as the structure-directing agent, and AMP and GO were used as the carbon sources to prepare MCMG via a soft template method. At the aging temperature of 130 °C, no spherical particles were obtained in the composites. Nevertheless, mesoporous carbon spheres obtained at 140 °C combine with the graphene layers to form MCMG with a sandwich structure after carbonization at 900 °C. When the concentration of CTAB was less than 10.6 g L−1, the synthesized composites easily agglomerated and the carbon nanoparticles were dispersed disorderedly on the graphene surface. When the concentration of CTAB was in the range of 10.6–12.6 g L−1, the mesoporous carbon spheres were uniformly dispersed among the layered graphenes. When the concentration of CTAB was very high, unevenly distributed mesoporous carbon spheres with a large diameter were observed in MCMG. Due to the introduction of graphene and the formation of mesoporous carbon spheres, the composites with many mesopores had a significantly large specific surface area. Furthermore, the as-prepared MCMG composites possessed high specific capacitance, and exhibited excellent cycling stability and rate capability, indicating that the electrochemical performances of the composites can be improved by the synergy of graphenes and mesoporous carbon spheres with a small diameter.Conflicts of interest
There are no conflicts to declare.Acknowledgements
This work is supported by the National Natural Science Foundation of China (Grant No. 51772243) and the China Postdoctoral Science Foundation Funded Project (Grant No. 2016M592824).References
- X. L. Guo, T. Wang, T. X. Zheng, C. H. Xu, J. T. Zhang, Y. X. Zhang, X. Y. Liu and F. Dong, J. Mater. Chem. A, 2018, 6, 24717 RSC.
- Z. S. Wu, W. C. Ren, D. W. Wang, F. Li, B. L. Liu and H. M. Cheng, ACS Nano, 2010, 4, 5835 CrossRef CAS PubMed.
- X. Guo, P. Liu, J. Han, Y. Ito, A. Hirata, T. Fujita and M. Chen, Adv. Mater., 2015, 27, 6137 CrossRef CAS.
- H. He and C. Gao, ACS Appl. Mater. Interfaces, 2010, 2, 3201 CrossRef CAS.
- Q. Liao, N. Li, S. Jin, G. Yang and C. Wang, ACS Nano, 2015, 9, 5310 CrossRef CAS.
- J. Yan, T. Wei, B. Shao, F. Q. Ma, Z. J. Fan, M. L. Zhang, C. Zheng, Y. C. Shang, W. Z. Qian and F. Wei, Carbon, 2010, 48, 1731 CrossRef CAS.
- U. N. Maiti, W. J. Lee, J. M. Lee, Y. Oh, J. Y. Kim, J. E. Kim, J. Shim, T. H. Han and S. O. Kim, Adv. Mater., 2014, 26, 40 CrossRef CAS.
- S. Grimme, M. A. Christian and J. Antony, J. Phys. Chem. C, 2007, 111, 11199 CrossRef CAS.
- E. A. Arkhipova, A. S. Ivanov, S. V. Savilov, K. I. Maslakov, S. A. Chernyak, Y. A. Tambovtseva and V. V. Lunin, Funct. Mater. Lett., 2018, 11, 184005 CrossRef.
- W. Xiong, M. X. Liu, L. H. Gan, Y. K. Lv, Y. Li, L. Yang, Z. J. Xu, Z. X. Hao, H. L. Liu and L. W. Chen, J. Power Sources, 2011, 196, 10461 CrossRef CAS.
- N. Chandrasekaran, V. Premkumar, S. M. S. Kumar and R. Ram, New J. Chem., 2018, 42, 7371 RSC.
- J. Qian, M. Zhou, Y. Cao, X. Ai and H. Yang, J. Phys. Chem. C, 2010, 114, 3477 CrossRef CAS.
- Z. Z. Li and Y. B. Tan, ChemistrySelect, 2018, 3, 4319 CrossRef CAS.
- R. P. Zheng and S. J. Liao, Surf. Technol., 2015, 5, 25 Search PubMed.
- L. L. Shao, M. Chen, T. Z. Ren and Z. Y. Yuan, J. Power Sources, 2015, 274, 791 CrossRef CAS.
- K. Zhou, Y. Zhu, X. Yang and C. Li, Electroanalysis, 2011, 23, 862 CrossRef CAS.
- L. Kong, X. Lu, X. Bian, W. Zhang and C. Wang, ACS Appl. Mater. Interfaces, 2010, 3, 35 CrossRef.
- L. M. Cui, Y. G. Wang, L. Gao, L. H. Hu, L. G. Yan, Q. Wei and B. Du, Chem. Eng. J., 2015, 281, 1 CrossRef CAS.
- Z. B. Lei, Z. H. Liu, H. J. Wang, X. X. Sun, L. Lu and X. S. Zhao, J. Mater. Chem. A, 2013, 1, 2313 RSC.
- X. Y. Zhao, J. P. Tu, Y. Lu, J. B. Cai, Y. J. Zhang, X. L. Wang and C. D. Gu, Electrochim. Acta, 2013, 113, 256 CrossRef CAS.
- M. Seredych and T. J. Bandosz, J. Mater. Chem. A, 2013, 1, 11717 RSC.
- Y. Corre, M. Seredych and T. J. Bandosz, Carbon, 2013, 55, 176 CrossRef CAS.
- X. J. He, J. X. Wang, G. H. Xu, M. X. Yu and M. B. Wu, Diamond Relat. Mater., 2016, 66, 119 CrossRef CAS.
- Y. Ma, C. Ma, J. Sheng, H. X. Zhang, R. R. Wang, Z. Y. Xie and J. L. Shi, J. Colloid Interface Sci., 2016, 461, 96 CrossRef CAS.
- X. L. Zhang, S. Y. Luo, Q. L. Lin, Y. M. Wang, X. D. Huang and L. Xiong, J. Anal. Appl. Pyrolysis, 2017, 124, 73 CrossRef CAS.
- X. L. Zhang, C. H. Zhong, Q. L. Lin, S. Y. Luo, X. Q. Zhang and C. Q. Fang, J. Anal. Appl. Pyrolysis, 2017, 126, 154 CrossRef CAS.
- Z. B. Lei, N. Christov and X. S. Zhao, Energy Environ. Sci., 2011, 4, 1866 RSC.
- Z. M. Wang, W. D. Wang, N. Coombs, N. Soheilnia and G. A. Ozin, ACS Nano, 2010, 4, 7437 CrossRef CAS.
- S. B. Yang, X. L. Feng, L. Wang, K. Tang, J. Maier and K. Müllen, Angew. Chem., Int. Ed., 2010, 49, 4795 CrossRef CAS.
- C. W. Lee, K. C. Roh and K. B. Kim, Nanoscale, 2013, 5, 9604 RSC.
- Y. F. Song, J. Yang, K. Wang, S. Haller, Y. G. Wang, C. X. Wang and Y. Y. Xia, Carbon, 2016, 96, 955 CrossRef CAS.
- R. L. Liu, L. Wan, S. Q. Liu, L. X. Pan, D. Q. Wu and D. Y. Zhao, Adv. Funct. Mater., 2015, 25, 526 CrossRef CAS.
- X. H. Jin, Q. L. Wei, H. J. Huang, M. X. Wang and Y. M. Huang, Chin. J. Chem., 2012, 30, 2805 CrossRef CAS.
- D. S. Zhang, X. R. Wen, L. Y. Shi, T. T. Yan and J. P. Zhang, Nanoscale, 2012, 4, 5440 RSC.
- L. Wang, L. Sun, C. G. Tian, T. X. Tan, G. Mu, H. X. Zhang and H. G. Hu, RSC Adv., 2012, 2, 8359 RSC.
- C. J. Guerrero and B. F. Caballero, Mater. Chem. Phys., 2015, 153, 209 CrossRef.
- M. X. Wang, C. Y. Wang, T. Q. Li and Z. J. Hu, Carbon, 2008, 46, 84 CrossRef CAS.
- C. J. Guerrero and B. F. Caballero, Mater. Chem. Phys., 2015, 153, 209 CrossRef.
- Y. L. Cheng, T. H. Li, C. Q. Fang, M. R. Zhang, X. L. Liu, R. E. Yu and J. B. Hu, Appl. Surf. Sci., 2013, 182, 862 CrossRef.
- S. X. Zhang, Q. Weng, F. Q. Zhao, H. X. Gao, P. Chen, X. B. Chen and Z. W. An, J. Colloid Interface Sci., 2017, 496, 35 CrossRef CAS.
- Y. F. Wang, H. H. Jiang, S. W. Ye, J. M. Zhou, J. H. Chen, Q. Q. Zeng, H. Yang and T. X. Liang, Funct. Mater. Lett., 2019, 12, 1950042 CrossRef CAS.
- A. Nabi, S. Tasneem, C. G. Jesudason, V. S. Lee and S. B. Zain, J. Mol. Liq., 2018, 256, 100 CrossRef CAS.
- Y. L. Cheng, L. Yang, C. Q. Fang and X. Guo, J. Anal. Appl. Pyrolysis, 2016, 122, 387 CrossRef CAS.
- Y. L. Cheng, Q. L. Zhang, C. Q. Fang, Y. Ouyang, J. Chen, X. Yu and D. H. Liu, J. Anal. Appl. Pyrolysis, 2018, 129, 154 CrossRef CAS.
- M. Liu, J. Qian, Y. Zhao, D. Zhu, L. Gan and L. Chen, J. Mater. Chem. A, 2015, 3, 11517 RSC.
- D. Wang, Z. Geng, B. Li and C. Zhang, Electrochim. Acta, 2015, 173, 377 CrossRef CAS.
- Y. L. Cheng, Q. L. Zhang, C. Q. Fang, Z. G. Huang, J. Chen, L. L. Wu and H. T. Wang, J. Electrochem. Soc., 2019, 166, A1 CrossRef.
- Y. L. Cheng, Q. L. Zhang, C. Q. Fang and S. H. Guo, J. Electrochem. Soc., 2017, 164, A1845 CrossRef CAS.
- W. Xing, S. Z. Qiao, R. G. Ding, F. Li, G. Q. Lu, Z. F. Yan and H. M. Cheng, Carbon, 2006, 44, 216 CrossRef CAS.
- C. W. Huang, C. H. Hsu, P. L. Kuo, C. T. Hsieh and H. Teng, Carbon, 2011, 49, 895 CrossRef CAS.
- L. L. Zhang, S. Y. Zhao, X. N. Tian and X. S. Zhao, Langmuir, 2010, 26, 17624 CrossRef CAS.
Footnote |
| † These authors contribute equally to the article. |
| This journal is © The Royal Society of Chemistry 2019 |

