 Open Access Article
Creative Commons Attribution 3.0 Unported Licence
Rod-like anhydrous V2O5 assembled by tiny nanosheets as a high-performance cathode material for aqueous zinc-ion batteries†
Weijun
Zhou
a,
Jizhang
Chen
 *a,
Minfeng
Chen
a,
Xinwu
Xu
a,
Qinghua
Tian
b,
Junling
Xu
*c and
Ching-Ping
Wong
 cd
cd
aCollege of Materials Science and Engineering, Nanjing Forestry University, Nanjing 210037, China. E-mail: jizhang.chen@hotmail.com
bDepartment of Chemistry, School of Sciences, Zhejiang Sci-Tech University, Hangzhou 310018, China
cDepartment of Electronic Engineering, The Chinese University of Hong Kong, NT, Hong Kong, China. E-mail: junlingxu@outlook.com
dSchool of Materials Science and Engineering, Georgia Institute of Technology, Atlanta, USA
First published on 26th September 2019
Abstract
Aqueous zinc-ion batteries offer a low-cost and high-safety alternative for next-generation electrochemical energy storage, whereas suitable cathode materials remain to be explored. Herein, rod-like anhydrous V2O5 derived from a vanadium-based metal–organic framework is investigated. Interestingly, this material is assembled by tiny nanosheets with a large surface area of 218 m2 g−1 and high pore volume of 0.96 cm3 g−1. Benefiting from morphological and structural merits, this material exhibits excellent performances, such as high reversible capacity (449.8 mA h g−1 at 0.1 A g−1), good rate capability (314.3 mA h g−1 at 2 A g−1), and great long-term cyclability (86.8% capacity retention after 2000 cycles at 2 A g−1), which are significantly superior to the control sample. Such great performances are found to derive from high Zn2+ ion diffusion coefficient, large contribution of intercalation pseudocapacitance, and fast electrochemical kinetics. The ex situ measurements unveil that the intercalation of Zn2+ ion is accompanied by the reversible V5+ reduction and H2O incorporation. This work discloses a direction for designing and fabricating high-performance cathode materials for zinc-ion batteries and other advanced energy storage systems.
1. Introduction
Although lithium-ion batteries (LIBs) have dominated in portable electronics and emerging electric vehicles, their future potential for large-scale energy storage systems is strongly hindered by limited lithium resources, high cost, and safety issues.1–3 With the advantages of low cost, good safety, and high energy density, aqueous zinc-ion batteries (AZIBs) are becoming an alternative technology to LIBs, especially for large-scale applications.3–6 On the one hand, zinc element is abundant on the earth, and its metallic form is stable in water and has an approximate redox potential of −0.76 V vs. standard hydrogen electrode (SHE), allowing metallic Zn to be directly used as the anode of AZIBs with a large theoretical specific capacity (820 mA h g−1 and 5855 mA h cm−3).4,7 On the other hand, aqueous electrolytes contribute to better safety, higher ionic conductivity, easier processing, and lower cost in comparison with organic electrolytes.5 Despite great advances made for AZIBs in the last several years, AZIBs are still in their infancy, and their development is severely restricted by the unsatisfactory cathode materials, mainly due to heavy mass and high polarization of divalent Zn2+ ion.1,3In recent years, Mn-based oxides (e.g., MnO2,8–12 Mn3O4,13 and ZnMn2O4 (ref. 14)), polyanionic compounds (e.g., Na3V2(PO4)2F3 (ref. 15) and LiV2(PO4)3 (ref. 16)), Prussian blue analogues,17 Mo-based compounds (e.g., MoS2 (ref. 18)), and organic and polymer compounds (e.g., polyaniline19–21 and p-chloranil22) have been investigated as the cathode materials for AZIBs. However, these materials suffer from either low specific capacity or poor rate capability or short life span. Very recently, vanadium oxide, sulfide, and vanadate cathode materials have attracted much attention since Nazar et al. reported Zn0.25V2O5·nH2O as a high-capacity (∼300 mA h g−1) and long-life (1000 cycles) cathode material.23–31 It is noteworthy that the reversible, stable, and rapid redox reactions associated with vanadium element render these materials highly appealing for AZIBs. For example, Alshareef et al. developed hydrated layered Mg2+-intercalated V2O5 (Mg0.34V2O5·0.84H2O) with a large interlayer spacing of 13.4 Å, which enables high capacities of 353 and 264 mA h g−1 at 0.1 and 1 A g−1, respectively.25 Niu et al. reported NaV3O8·1.5H2O nanobelts, which exhibit high capacity of 380 mA h g−1 at 0.05 A g−1 and great capacity retention of 82% over 1000 cycles.30
Among various vanadium-based materials, anhydrous V2O5 is of particular interest owing to its simple configuration and high valence state of vanadium that enable more active sites and higher specific capacity.32–40 That is, anhydrous V2O5 is free of cations (e.g., Zn2+, Li+, Na+, K+, Mg2+, Ca2+) and H2O molecules within its layers, thus possessing higher gravimetric and volumetric specific capacities than other vanadium-based materials in theory, while such characteristic also makes Zn2+ ion uptake difficult due to the limited interlayer space.34,41,42 For instance, porous V2O5 nanofibers prepared by electrospinning and subsequent calcination delivers merely 319 mA h g−1 at a rather low current density of 0.02 A g−1, which is substantially lower than the theoretical specific capacity (∼589 mA h g−1 based on the two-electron redox center of vanadium) of V2O5.34 In addition, this V2O5 shows low capacities at high current densities, e.g., 104 mA h g−1 at 2.94 A g−1.34 As is widely utilized for electrode materials, tailoring the morphology, size, and porosity is an effective way to address the above-mentioned problem. In the present work, in order to demonstrate the importance of morphology engineering for V2O5 cathode material and elucidate its Zn2+ ion uptake mechanism, we focus on rod-like anhydrous V2O5 (denoted RA-V2O5) that is fabricated via the pyrolysis of MIL-47. MIL-47 is a vanadium-based metal–organic framework (MOF) VIV(O)(bdc), in which bdc represents 1,4-benzenedicarboxylate. It is found that RA-V2O5 possesses micro/nano-hierarchical structure with large specific surface area and high pore volume, consequently displaying great electrochemical performances.
2. Experimental
2.1. Materials synthesis and characterization
MIL-47 was synthesized according to a previous report.43 The as-obtained MIL-47 was kept in a furnace at 350 °C for 4 h in the air atmosphere, thus producing RA-V2O5. The morphology and microstructure were characterized on JEOL JSM-7600F field emission scanning electron microscope (FE-SEM), JEOL JEM-2100UHR transmission electron microscope (TEM), and Quantachrome Autosorb-iQ2-MP N2 adsorption/desorption analyzer. The crystallographic information, phase purity, and chemical compositions of the samples were collected by Rigaku Ultima IV powder X-ray diffractometer (XRD) with Cu Kα radiation source, Elementar Vario EL Cube elemental analyzer, TA Instruments Q5000 IR thermogravimetric analyzer (TGA), Thermo Scientific DXR Raman Spectrometer with λ = 532 nm laser excitation, and Kratos AXIS UltraDLD X-ray photoelectron spectrometer (XPS).2.2. Electrochemical measurements
RA-V2O5, Super-P carbon black, and polyvinylidene difluoride (PVDF) were mixed in N-methylpyrrolidone (NMP) homogeneously at a weight ratio of 7![[thin space (1/6-em)]](https://www.rsc.org/images/entities/char_2009.gif) :
:![[thin space (1/6-em)]](https://www.rsc.org/images/entities/char_2009.gif) 2
2![[thin space (1/6-em)]](https://www.rsc.org/images/entities/char_2009.gif) :
:![[thin space (1/6-em)]](https://www.rsc.org/images/entities/char_2009.gif) 1 to form a slurry, which was casted on a titanium foil and dried at 80 °C for 4 h. Then the titanium foil was pressed at 10 MPa and cut into round pieces (12 mm in diameter) as working electrodes. The mass loading of RA-V2O5 is 1.5–2 mg cm−2. CR2016 coin cells were assembled by a traditional method using glass fiber membrane (Whatman GF/A), zinc foil (0.25 mm), and 3 M Zn(CF3SO3)2 aqueous solution as the separator, counter electrode, and electrolyte, respectively. The electrochemical performances of coin cells were examined at current densities from 0.1 to 5 A g−1 in the potential window from 0.2 to 1.6 V vs. Zn2+/Zn using a LAND CT2001A battery test system. Cyclic voltammetry (CV) and electrochemical impedance spectroscopy (EIS) measurements were carried out using a CHI 660E electrochemical workstation. The solubility of RA-V2O5 in the electrolyte was evaluated by inductively coupled plasma mass spectrometer (ICP-MS).
1 to form a slurry, which was casted on a titanium foil and dried at 80 °C for 4 h. Then the titanium foil was pressed at 10 MPa and cut into round pieces (12 mm in diameter) as working electrodes. The mass loading of RA-V2O5 is 1.5–2 mg cm−2. CR2016 coin cells were assembled by a traditional method using glass fiber membrane (Whatman GF/A), zinc foil (0.25 mm), and 3 M Zn(CF3SO3)2 aqueous solution as the separator, counter electrode, and electrolyte, respectively. The electrochemical performances of coin cells were examined at current densities from 0.1 to 5 A g−1 in the potential window from 0.2 to 1.6 V vs. Zn2+/Zn using a LAND CT2001A battery test system. Cyclic voltammetry (CV) and electrochemical impedance spectroscopy (EIS) measurements were carried out using a CHI 660E electrochemical workstation. The solubility of RA-V2O5 in the electrolyte was evaluated by inductively coupled plasma mass spectrometer (ICP-MS).
3. Results and discussion
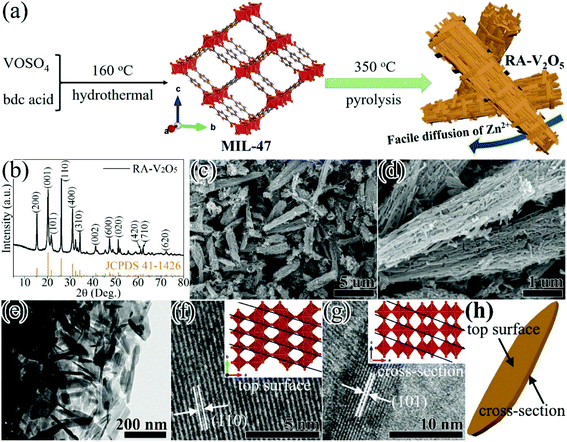
RA-V2O5 was fabricated through a two-step process (see Fig. 1a). In the first step, MIL-47 was prepared by a facile hydrothermal reaction of VOSO4 and bdc acid at 160 °C.43 In the second step, the as-obtained MIL-47 was pyrolyzed at 350 °C for 4 h in air, thus transforming into RA-V2O5. The crystalline phase of RA-V2O5 was verified by XRD, as shown in Fig. 1b, which matches exactly with the orthorhombic shcherbinaite V2O5 with a Pmmn space group (JCPDS 41-1426). The intense peaks at 2θ = 15.35°, 20.25°, 21.68°, 26.11°, 31.00°, and 34.30° correspond to the (200), (001), (101), (110), (400), and (310) planes of V2O5, respectively. According to the elemental analysis result, the weight percentages of C and H elements are both lower than 0.3% in RA-V2O5, indicating RA-V2O5 is almost free of carbon and water. The anhydrous nature of RA-V2O5 is also confirmed by the TGA curve in Fig. S1.† For comparison, commercial V2O5 purchased from Aladdin (denoted C-V2O5) was also investigated as the cathode material for AZIBs. As can be observed from Fig. S2,† all the XRD peaks of C-V2O5 are attributed to shcherbinaite V2O5. It is also seen that the peaks of C-V2O5 are much sharper than that of RA-V2O5, indicative of much lower crystallinity of the latter.Fig. 1c shows the global SEM image of RA-V2O5, revealing a homogeneous rod-like morphology. These rods are around 1 μm in diameter and have extremely rough surface. It can be clearly seen from Fig. 1d and e that RA-V2O5 rods consist of interconnected tiny nanosheets with the thickness of 5–15 nm. Notably, there exist sufficient voids among RA-V2O5 nanosheets, which can considerably facilitate Zn2+ ion diffusion within V2O5, therefore realizing high specific capacity and great rate capability. Besides, these voids can effectively accommodate the volumetric expansion of V2O5 upon Zn2+ ion uptake, which is beneficial for cycling stability. The high-resolution (HR) TEM images of RA-V2O5 nanosheet at the top surface and cross-section are presented in Fig. 1f and g, in which the lattice fringes of 0.337 and 0.406 nm correspond to the (110) and (101) crystalline planes of shcherbinaite V2O5, respectively. The orientations and locations of these two planes are illustrated in Fig. 1h and the inset of Fig. 1f and g. As for C-V2O5, it is comprised by large particles of 200–600 nm in size, as shown in Fig. S3.†
Fig. 2a displays Raman spectra of two V2O5 samples. They show nearly identical profiles, and are in good consistent with previously reported V2O5.33,34 Specifically, the nine bands can be divided into three regions, i.e., 500–1000 cm−1, 200–500 cm−1, and the strongest band at 140 cm−1, originating from the bond stretching modes, the angle bending modes, and the shear motion and rotations of the ladders along their axes, respectively.44 The high purity of RA-V2O5 is also confirmed by its XPS spectrum (Fig. S4†), which only contains peaks belonging to V and O. As for C-V2O5, a small amount of Na is detected. The existence of sufficient voids within RA-V2O5 is evidenced by N2 adsorption–desorption analysis. As is shown in Fig. 2b, RA-V2O5 exhibits type IV isotherm (IUPAC classification), indicative of mesoporous structure. According to Brunauer–Emmett–Teller (BET) theory, the specific surface area of RA-V2O5 is measured to be 218 m2 g−1, much higher than that of C-V2O5 (5.3 m2 g−1). It is worthwhile mentioning that the specific surface area of RA-V2O5 is significantly larger than that of previously reported V2O5 cathode materials for AZIBs, e.g., porous V2O5 nanofibers (27.1 m2 g−1),34 V2O5 hollow spheres (11.1 m2 g−1),37 and V2O5 nanofibers (17.9 m2 g−1),38 therefore making electrolyte permeation and Zn2+ ion insertion more favourable within RA-V2O5. Besides, a H3-type hysteresis loop is observed for RA-V2O5, suggesting it is composed of sheet-shaped particles, which accords well with its actual morphology observed from TEM. The mesoporous nature of RA-V2O5 is further supported by the Barrett–Joyner–Halenda (BJH) pore size distribution, as shown in the inset of Fig. 2b. In particular, a well resolved peak centered at ca. 2.3 nm can be observed. And RA-V2O5 has a large pore volume of 0.96 cm3 g−1, in comparison with merely 0.01 cm3 g−1 of C-V2O5.
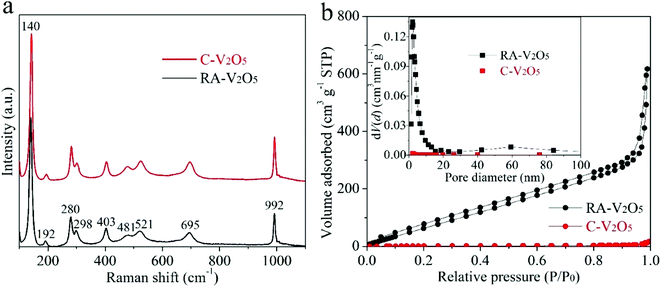 | ||
| Fig. 2 (a) Raman spectra and (b) N2 adsorption/desorption isotherms of RA-V2O5 and C-V2O5 (the inset of (b) shows corresponding BJH pore-size distributions). | ||
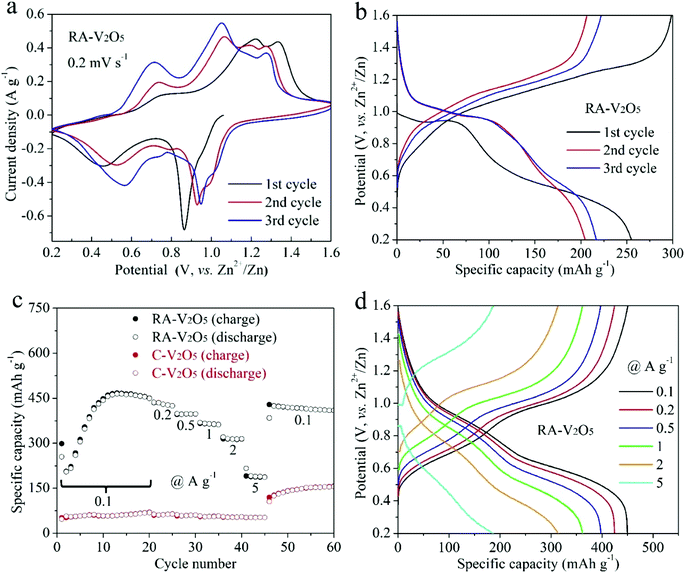
The electrochemical properties of RA-V2O5 and C-V2O5 were evaluated in a coin-cell configuration using zinc metal foil and 3 M Zn(CF3SO3)2 aqueous solution as the counter/reference electrode and electrolyte, respectively. The CV curves of RA-V2O5 in the initial three cycles at a scan rate of 0.2 mV s−1 in the potential window of 0.2 to 1.6 V (vs. Zn2+/Zn) are shown in Fig. 3a. Multiple pairs of redox peaks can be observed, demonstrating a multistep Zn2+ ion uptake/release process in V2O5 cathode materials for AZIBs.36–39 The CV curves of RA-V2O5 at the 1st cycle is different from that in the following cycles in terms of peak positions and profiles, behind which the possible reason is the activation of V2O5. It is also seen that RA-V2O5 exhibits more peaks than C-V2O5 (Fig. S5†) and the peak current densities of RA-V2O5 are much stronger, unveiling that RA-V2O5 has higher electrochemical reactivity than C-V2O5. Fig. 3b presents the galvanostatic charge/discharge (GCD) curves of RA-V2O5 in initial three cycles at the current density of 0.1 A g−1, in which sloped plateaus can be observed. And the characteristics of these curves are consistent with the above-mentioned CV curves. As for C-V2O5, its GCD curves (see Fig. S6†) shows similar characteristics, whereas its capacities are much lower than that of RA-V2O5.
Rate capability is an important parameter for practical applications. Fig. 3c exhibits charge and discharge capacities of RA-V2O5 and C-V2O5 at current densities from 0.1 to 5 A g−1. At 0.1 A g−1, the discharge capacity of RA-V2O5 rises from 2nd cycle gradually, and reaches a maximum value of 464.4 mA h g−1 at the 13th cycle. Such phenomenon is ascribed to the electrochemical activation of V2O5 during Zn2+ ion storage, which was also observed for previously reported V2O5 cathode materials.32,34,37,40 The activation is probably related to the poor electrical conductivity of V2O5,45 as well as phase transformation and morphology evolution of V2O5 during repeated cycles. This process enables more actives sites that were previously inaccessible to Zn2+ ions. Then, as the finite activation process becomes slight, the capacity slowly drops to 449.8 mA h g−1 at the 20th cycle. As the current density is raised progressively to 0.2, 0.5, 1, 2, and 5 A g−1, the discharge capacity of RA-V2O5 declines to 424.5, 397.8, 361.9, 314.3, and 186.8 mA h g−1 at the end of each current density, respectively. When the current density recovers to 0.1 A g−1, RA-V2O5 is able to give high capacities between 410 and 420 mA h g−1, indicative of good electrochemical stability. Besides, it is noted that RA-V2O5 delivers considerably higher capacities than C-V2O5 under all the current densities, manifesting our construction of RA-V2O5 is highly meaningful. Remarkably, thanks to the morphological and structural merits, the RA-V2O5 outperforms many vanadium-based cathode materials reported to date for AZIBs, such as the ones listed in Table S1.† It is clearly seen that our RA-V2O5 is significantly superior to porous V2O5 nanofibers (104 mA h g−1 at 3 A g−1),34 V2O5 nanosheets (100 mA h g−1 at 2 A g−1),36 V2O5 nanospheres (138.3 mA h g−1 at 5 A g−1),39 and V2O5 hollow spheres (147 mA h g−1 at 5 A g−1).37 As is depicted in Fig. 3d, the GCD curve profiles of RA-V2O5 at various current densities display nearly the same shape, implying small polarization and fast electrochemical kinetics.
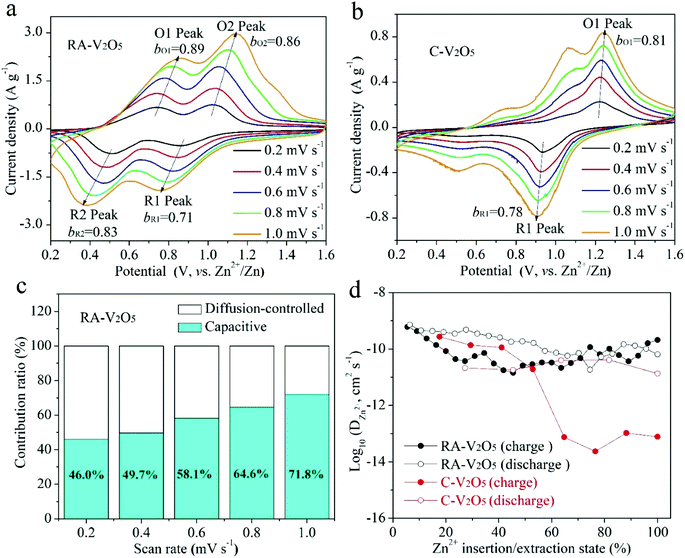
CV measurements were conducted at various scan rates to study the electrochemical kinetics of RA-V2O5 and C-V2O5, as displayed in Fig. 4a and b. With the progressive increase of the scan rate from 0.2 to 1.0 mV s−1, the anodic peaks slightly move to higher potential, while the cathodic peaks shift to the opposite direction. In the meantime, these peaks become broader gradually. This phenomenon is common for electrode materials, and results from aggravated electrochemical polarization at higher scan rates. When the scan rate is high, the transport of electrons and the diffusion of electrolyte ions in the batteries cannot be synchronized with the quick electron transfer in the external circuit. As a result, the potential/voltage during charging would rise, while the potential/voltage during discharge would decrease. If assuming that the relationship between the scan rate (ν) and peak current density (i) conforms to the following classic power-law equation,46 the charge storage kinetics can be estimated:
| i = aνb | (1) |
| i(V) = k1ν + k2ν1/2 | (2) |
The Galvanostatic Intermittent Titration Technique (GITT) was used to estimate the Zn2+ ion diffusion coefficients (DZn2+) in RA-V2O5 and C-V2O5.49 Before GITT tests, the coin cells were run at 0.1 A g−1 for 20 cycles to obtain a stable state. Subsequently, a galvanostatic pulse of 1200 s (0.05 A g−1) followed by a relaxation of 180 min to allow the potential to reach the equilibrium was repeatedly applied during the whole charge/discharge process. On the basis of the following equation, the DZn2+ could be calculated:23,49
 | (3) |
Although the divalent nature of Zn2+ ion has an adverse effect on its diffusion within the electrode material, the DZn2+ of RA-V2O5 is not low, ranging from 10−9 to 10−11 cm2 s−1 (Fig. 4d), which is much higher than Li+ ion diffusion in LiFePO4 (ref. 50) and Li4Ti5O12,51 and higher than DZn2+ of previously reported V2O5.38 Besides, the DZn2+ of RA-V2O5 is slightly higher than that of C-V2O5 in general, due to much larger specific surface area and pore volume of the former. That is, the ion diffusion at the surface and interface is much more favourable than that within the bulk, therefore contributing to improved rate performances in RA-V2O5.
Cycling stability is critical for electrode materials. Fig. 5a shows charge and discharge capacities of RA-V2O5 and C-V2O5 during 2000 cycles at 2 A g−1. The cycling performance tests were conducted after 10 cycles at 0.1 A g−1. It is seen that the charge capacity is nearly identical to the discharge one at each cycle, implying high coulombic efficiency. In the respect of discharge, RA-V2O5 offers an initial capacity of 317.6 mA h g−1, which gradually drops to 293.2 and 275.6 mA h g−1 at the 1000th and 2000th cycle, respectively. That is, the capacity retention of RA-V2O5 is up to 92.3% and 86.8% after 1000 and 2000 cycles, respectively. As for C-V2O5, its discharge capacity is merely 82.8 mA h g−1 at the 2000th cycle, and the corresponding capacity retention is merely 59.4%. After around 30 days (including the period of cycling at 2 A g−1 for 2000 cycles), the electrolyte of RA-V2O5 coin cells was collected by washing the electrodes, separators, and coin cell shells with deionized water. Then the collected electrolyte was subjected to ICP-MS analysis, which reveals only trace amount of vanadium (0.0288%) from RA-V2O5 can be dissolved. Therefore, the active material dissolution is not the main reason of capacity fading for V2O5 cathode materials. In order to provide more insight into the electrochemical kinetics of RA-V2O5, EIS measurements were performed using 5 mV amplitude with frequency ranging from 10 mHz to 100 kHz. As is shown in Fig. 5b, the Nyquist plots of RA-V2O5 consist of two parts, i.e. a depressed semicircle in the high frequency region (charge transfer process) and a sloped line in the low frequency region (diffusion-limited process).52 At the initial state, the impedances of RA-V2O5 are considerably lower than that of C-V2O5, illustrating the morphology engineering adopted by the present study can significantly enhance electrochemical kinetics. Specifically, the charge transfer resistance (Rct) of RA-V2O5 is merely 103.1 Ω, which gets even smaller (66.8 Ω) at the end of 1000 cycles. The reduction of Rct might result from activation mentioned in the above section.
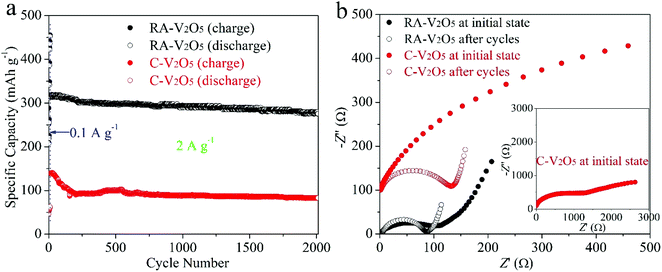 | ||
| Fig. 5 (a) Cycling performances of RA-V2O5 and C-V2O5 at 2 A g−1, conducted after 10 cycles at 0.1 A g−1. (b) Nyquist plots of RA-V2O5 and C-V2O5 at initial state and after 1000 cycles at 2 A g−1. | ||
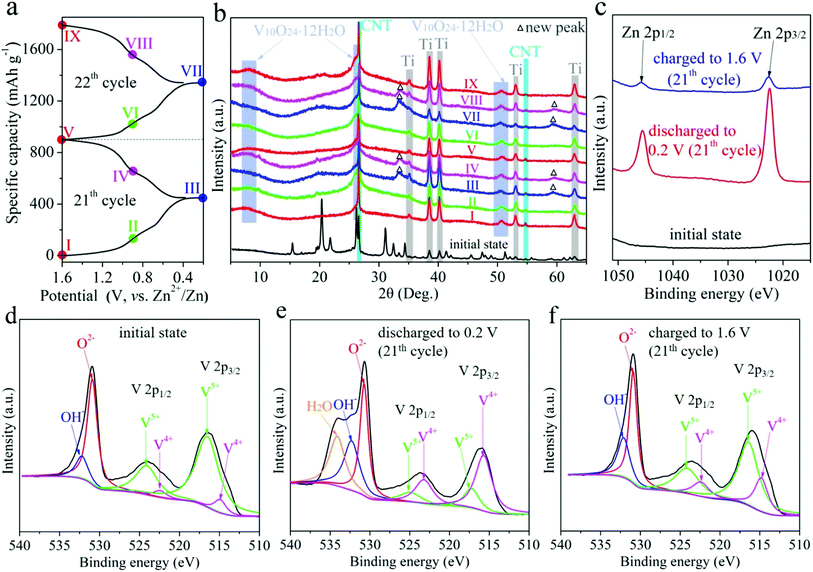
The charge storage mechanism of RA-V2O5 was investigate using ex situ XRD measurements. The RA-V2O5 electrodes were cycled for 20 times at 0.1 A g−1 to reach a stable state. Subsequently during the 21th and 22th cycles, the RA-V2O5 electrodes were discharged or charged to a certain state (marked in Fig. 6a). After that, the RA-V2O5 electrodes were separated from the coin cells, rinsed with distilled water thoroughly, and dried under vacuum at room temperature. Herein, carbon black conductive agent was replaced by carbon nanotubes (CNT), so as to avoid the cracking of electrodes during washing with water. Fig. 6b shows XRD patterns of RA-V2O5 at different states. Except for the peaks originating from the Ti current collector and CNT conductive agent (the XRD pattern of neat CNT is shown in Fig. S8†), all the peaks of the electrode at the initial state (before cycles) can be indexed as the shcherbinaite V2O5. Surprisingly, all the peaks belonging to V2O5 disappear after 20 cycles. Instead, several new humps appear and match with V10O24·12H2O.53 These new peaks are rather broad and very low in intensity, indicating high-crystalline V2O5 is electrochemically transformed into amorphous V10O24·12H2O. When the electrode is discharged to 0.2 V, two new peaks are observed, and then disappear at 1.6 V. These new peaks coincide with the ones for Zn0.25V2O5·nH2O at discharged states.23 In Fig. S9,† some peaks/humps are magnified. It is seen the hump centered at ca. 50.4° (corresponding to V10O24·12H2O) moves to lower degree during discharging and shifts to higher degree during charging, due to the (de)intercalation of Zn2+ ions and H2O molecules. The above results indicate high-crystalline V2O5 is electrochemically transformed into amorphous V10O24·12H2O after prolonged cycles. This phenomenon has not been reported for vanadium-based oxide materials before, probably due to that previous reports mainly focused on initial several cycles. In fact, activation process often exists for vanadium-based oxide materials, especially for V2O5.32,34,37,40 In the present study, the rod-like morphology of RA-V2O5 is found to collapse after 2000 cycles at 2 A g−1, and in the meantime the nanosheets evolve into interconnected nanowires, as shown in Fig. S10.† Herein, the phase transformation and morphology evolution might account for the activation process of V2O5.
What's more, the ex situ XPS measurements were conducted on RA-V2O5 at the 21th cycle, as shown in Fig. 6c–f, in which the spectra were calibrated using the C 1s peak at 284.8 eV. In Fig. 6c, Zn is absent at the initial state. When the electrode is discharged to 0.2 V, two strong peaks corresponding to Zn 2p appear, confirming Zn2+ is inserted into the host material. When the RA-V2O5 electrode is charged back to 1.6 V, these two peaks are still present, whereas their intensity is far below that for 0.2 V, indicative of good reversibility. The above result also demonstrates that a small amount of inserted Zn2+ ions cannot be extracted, agreeing well with previous reports.24,42 This might be the origin of capacity decay. As can be seen from Fig. 6d–f, the V5+ peak becomes weaker and the V4+ peak gets stronger when the electrode is discharged, indicating that part of V5+ is reduced to V4+ for charge balance. This process is reversible since V4+ can be oxidized back to V5+ at 1.6 V. It is also seen that the O 1s subpeak that is assigned to H2O is enhanced significantly when the electrode is discharged to 0.2 V, suggesting that H2O molecules are incorporated into the host material together with Zn2+ ion intercalation.26,28,53 During the charge process, these H2O molecules are released. The incorporated H2O molecules within the lattice of host material can effectively shield the electrostatic field of Zn2+ ions that are inserted at the same time, therefore beneficial to electrochemical kinetics.
4. Conclusions
Success development of AZIBs mainly depends on the design of cathode materials. In this work, we highlight the importance of morphology engineering by fabricating RA-V2O5via decomposing MIL-47 at 350 °C in air. Interestingly, RA-V2O5 rods are assembled by tiny nanosheets. Such intriguing morphology and structure endow RA-V2O5 with great performances as the cathode material for AZIBs. It is noticed that the pseudocapacitive Zn2+ ion intercalation into RA-V2O5 occupies nearly or more than half of the total capacity, e.g., 71.8% at 1 mV s−1. RA-V2O5 also possesses high Zn2+ ion diffusion coefficient of 10−9 to 10−11 cm2 s−1 and low charge transfer resistance around 100 Ω. The fundamental Zn2+ ion storage mechanism is also elaborated. The crystalline V2O5 is converted to amorphous V10O24·12H2O and the morphology changes a lot after cycles, which might account for the activation process of V2O5. And it is found the Zn2+ ion (de)intercalation is accompanied by the reversible uptake/release of H2O molecules and redox transitions between V5+ and V4+. In summary, this work offers a new avenue for designing high-performance cathode materials of AZIBs and reveals a new phenomenon associated with Zn2+ ion storage.Conflicts of interest
There are no conflicts to declare.Acknowledgements
This work was supported by the National Natural Science Foundation of China (No. 51902165), the Natural Science Foundation of Jiangsu Province (BK20170917), the Scientific Research Foundation for High-Level Talents of Nanjing Forestry University (GXL2016023), the Program of High-Level Talents in Six Industries of Jiangsu Province (XCL-040), and the Jiangsu Specially-Appointed Professor Program.References
- A. Konarov, N. Voronina, J. H. Jo, Z. Bakenov, Y. K. Sun and S. T. Myung, ACS Energy Lett., 2018, 3, 2620–2640 CrossRef CAS.
- P. Yu, Y. Zeng, H. Zhang, M. Yu, Y. Tong and X. Lu, Small, 2019, 15, 1804760 CrossRef.
- J. Ming, J. Guo, C. Xia, W. Wang and H. N. Alshareef, Mater. Sci. Eng., R, 2019, 135, 58–84 CrossRef.
- M. Song, H. Tan, D. L. Chao and H. J. Fan, Adv. Funct. Mater., 2018, 28, 1802564 CrossRef.
- G. Z. Fang, J. Zhou, A. Q. Pan and S. Q. Liang, ACS Energy Lett., 2018, 3, 2480–2501 CrossRef CAS.
- W. Xu, K. Zhao, W. Huo, Y. Wang, G. Yao, X. Gu, H. Cheng, L. Mai, C. Hu and X. Wang, Nano Energy, 2019, 62, 275–281 CrossRef CAS.
- Y. B. Li, J. Fu, C. Zhong, T. P. Wu, Z. W. Chen, W. B. Hu, K. Amine and J. Lu, Adv. Energy Mater., 2019, 9, 1802605 CrossRef.
- N. Zhang, F. Y. Cheng, J. X. Liu, L. B. Wang, X. H. Long, X. S. Liu, F. J. Li and J. Chen, Nat. Commun., 2017, 8, 405 CrossRef.
- W. Sun, F. Wang, S. Y. Hou, C. Y. Yang, X. L. Fan, Z. H. Ma, T. Gao, F. D. Han, R. Z. Hu, M. Zhu and C. S. Wang, J. Am. Chem. Soc., 2017, 139, 9775–9778 CrossRef CAS.
- J. H. Huang, Z. Wang, M. Y. Hou, X. L. Dong, Y. Liu, Y. G. Wang and Y. Y. Xia, Nat. Commun., 2018, 9, 2906 CrossRef.
- D. Chao, W. Zhou, C. Ye, Q. Zhang, Y. Chen, L. Gu, K. Davey and S.-Z. Qiao, Angew. Chem., Int. Ed., 2019, 58, 7823–7828 CrossRef CAS.
- S. Lian, C. Sun, W. Xu, W. Huo, Y. Luo, K. Zhao, G. Yao, W. Xu, Y. Zhang, Z. Li, K. Yu, H. Zhao, H. Cheng, J. Zhang and L. Mai, Nano Energy, 2019, 62, 79–84 CrossRef CAS.
- J. W. Hao, J. Mou, J. W. Zhang, L. B. Dong, W. B. Liu, C. J. Xu and F. Y. Kang, Electrochim. Acta, 2018, 259, 170–178 CrossRef CAS.
- X. W. Wu, Y. H. Xiang, Q. J. Peng, X. S. Wu, Y. H. Li, F. Tang, R. C. Song, Z. X. Liu, Z. Q. He and X. M. Wu, J. Mater. Chem. A, 2017, 5, 17990–17997 RSC.
- W. Li, K. Wang, S. Cheng and K. Jiang, Energy Storage Materials, 2018, 15, 14–21 CrossRef.
- F. Wang, E. Y. Hu, W. Sun, T. Gao, X. Ji, X. L. Fan, F. D. Han, X. Q. Yang, K. Xu and C. S. Wang, Energy Environ. Sci., 2018, 11, 3168–3175 RSC.
- R. Trocoli, G. Kasiri and F. La Mantia, J. Power Sources, 2018, 400, 167–171 CrossRef CAS.
- W. Xu, C. Sun, K. Zhao, X. Cheng, S. Rawal, Y. Xu and Y. Wang, Energy Storage Materials, 2019, 16, 527–534 CrossRef.
- F. Wan, L. L. Zhang, X. Y. Wang, S. S. Bi, Z. Q. Niu and J. Chen, Adv. Funct. Mater., 2018, 28, 1804975 CrossRef.
- C. Kim, B. Y. Ahn, T. S. Wei, Y. Jo, S. Jeong, Y. Choi, I. D. Kim and J. A. Lewis, ACS Nano, 2018, 12, 11838–11846 CrossRef CAS.
- P. F. Liu, R. H. Lv, Y. He, B. Na, B. Wang and H. S. Liu, J. Power Sources, 2019, 410, 137–142 CrossRef.
- D. Kundu, P. Oberholzer, C. Glaros, A. Bouzid, E. Tervoort, A. Pasquarello and M. Niederberger, Chem. Mater., 2018, 30, 3874–3881 CrossRef CAS.
- D. Kundu, B. D. Adams, V. Duffort, S. H. Vajargah and L. F. Nazar, Nat. Energy, 2016, 1, 16119 CrossRef CAS.
- P. He, Y. L. Quan, X. Xu, M. Y. Yan, W. Yang, Q. Y. An, L. He and L. Q. Mai, Small, 2017, 13, 1702551 CrossRef.
- F. W. Ming, H. F. Liang, Y. J. Lei, S. Kandambeth, M. Eddaoudi and H. N. Alshareef, ACS Energy Lett., 2018, 3, 2602–2609 CrossRef CAS.
- Q. Pang, C. L. Sun, Y. H. Yu, K. N. Zhao, Z. Y. Zhang, P. M. Voyles, G. Chen, Y. J. Wei and X. D. Wang, Adv. Energy Mater., 2018, 8, 1800144 CrossRef.
- H. G. Qin, Z. H. Yang, L. L. Chen, X. Chen and L. M. Wang, J. Mater. Chem. A, 2018, 6, 23757–23765 RSC.
- T. Y. Wei, Q. Li, G. Z. Yang and C. X. Wang, J. Mater. Chem. A, 2018, 6, 20402–20410 RSC.
- B. Y. Tang, G. Z. Fang, J. Zhou, L. B. Wang, Y. P. Lei, C. Wang, T. Q. Lin, Y. Tang and S. Q. Liang, Nano Energy, 2018, 51, 579–587 CrossRef CAS.
- F. Wan, L. L. Zhang, X. Dai, X. Y. Wang, Z. Q. Niu and J. Chen, Nat. Commun., 2018, 9, 1656 CrossRef.
- J. S. Park, J. H. Jo, Y. Aniskevich, A. Bakavets, G. Ragoisha, E. Streltsov, J. Kim and S. T. Myung, Chem. Mater., 2018, 30, 6777–6787 CrossRef CAS.
- N. Zhang, Y. Dong, M. Jia, X. Bian, Y. Y. Wang, M. D. Qiu, J. Z. Xu, Y. C. Liu, L. F. Jiao and F. Y. Cheng, ACS Energy Lett., 2018, 3, 1366–1372 CrossRef CAS.
- D. M. Xu, H. W. Wang, F. Y. Li, Z. C. Guan, R. Wang, B. B. He, Y. S. Gong and X. L. Hu, Adv. Mater. Interfaces, 2019, 6, 1801506 CrossRef.
- X. Chen, L. Wang, H. Li, F. Cheng and J. Chen, J. Energy Chem., 2019, 38, 20–25 CrossRef.
- Q. Li, Q. Zhang, C. Liu, Z. Zhou, C. Li, B. He, P. Man, X. Wang and Y. Yao, J. Mater. Chem. A, 2019, 7, 12997–13006 RSC.
- J. Zhou, L. T. Shan, Z. X. Wu, X. Guo, G. Z. Fang and S. Q. Liang, Chem. Commun., 2018, 54, 4457–4460 RSC.
- H. Qin, L. Chen, L. Wang, X. Chen and Z. Yang, Electrochim. Acta, 2019, 306, 307–316 CrossRef CAS.
- Y. Li, Z. Huang, P. K. Kalambate, Y. Zhong, Z. Huang, M. Xie, Y. Shen and Y. Huang, Nano Energy, 2019, 60, 752–759 CrossRef CAS.
- F. Liu, Z. Chen, G. Fang, Z. Wang, Y. Cai, B. Tang, J. Zhou and S. Liang, Nano-Micro Lett., 2019, 11, 25 CrossRef CAS.
- D. Chen, X. Rui, Q. Zhang, H. Geng, L. Gan, W. Zhang, C. Li, S. Huang and Y. Yu, Nano Energy, 2019, 60, 171–178 CrossRef CAS.
- P. Hu, M. Yan, T. Zhu, X. Wang, X. Wei, J. Li, L. Zhou, Z. Li, L. Chen and L. Mai, ACS Appl. Mater. Interfaces, 2017, 9, 42717–42722 CrossRef CAS.
- P. Senguttuvan, S. D. Han, S. Kim, A. L. Lipson, S. Tepavcevic, T. T. Fister, I. D. Bloom, A. K. Burrell and C. S. Johnson, Adv. Energy Mater., 2016, 6, 1600826 CrossRef.
- Y. Yan, Y. Q. Luo, J. Y. Ma, B. Li, H. G. Xue and H. Pang, Small, 2018, 14, 1801815 CrossRef.
- R. Baddour-Hadjean, C. Navone and J. P. Pereira-Ramos, Electrochim. Acta, 2009, 54, 6674–6679 CrossRef CAS.
- P. Hu, T. Zhu, J. Ma, C. Cai, G. Hu, X. Wang, Z. Liu, L. Zhou and L. Mai, Chem. Commun., 2019, 55, 8486–8489 RSC.
- V. Augustyn, J. Come, M. A. Lowe, J. W. Kim, P. L. Taberna, S. H. Tolbert, H. D. Abruna, P. Simon and B. Dunn, Nat. Mater., 2013, 12, 518–522 CrossRef CAS.
- L. N. Chen, Y. S. Ruan, G. B. Zhang, Q. L. Wei, Y. L. Jiang, T. F. Xiong, P. He, W. Yang, M. Y. Yan, Q. Y. An and L. Q. Mai, Chem. Mater., 2019, 31, 699–706 CrossRef CAS.
- H.-S. Kim, J. B. Cook, H. Lin, J. S. Ko, S. H. Tolbert, V. Ozolins and B. Dunn, Nat. Mater., 2016, 16, 454 CrossRef.
- W. Weppner and R. A. Huggins, J. Electrochem. Soc., 1977, 124, 1569–1578 CrossRef CAS.
- Y. J. Zhu and C. S. Wang, J. Phys. Chem. C, 2010, 114, 2830–2841 CrossRef CAS.
- B. H. Li, C. P. Han, Y. B. He, C. Yang, H. D. Du, Q. H. Yang and F. Y. Kang, Energy Environ. Sci., 2012, 5, 9595–9602 RSC.
- J. Z. Chen, K. L. Fang, Q. Y. Chen, J. L. Xu and C. P. Wong, Nano Energy, 2018, 53, 337–344 CrossRef CAS.
- T. Y. Wei, Q. Li, G. Z. Yang and C. X. Wang, Electrochim. Acta, 2018, 287, 60–67 CrossRef CAS.
Footnote |
| † Electronic supplementary information (ESI) available: Fig. S1–S10 and Table S1. See DOI: 10.1039/c9ra06143f |
| This journal is © The Royal Society of Chemistry 2019 |

