 Open Access Article
An effective method to improve the growth rate of large single crystal diamonds under HPHT processes: optimized design of the catalyst geometric construction
Yadong
Li
a,
Chunxiao
Wang
b,
Liangchao
Chen
b,
Longsuo
Guo
b,
Zhuangfei
Zhang
c,
Chao
Fang
 c and
Hongan
Ma
 *b
*b
aCollege of Electronical Information Engineering, Yangtze Normal University, Chongqing 408100, China
bState Key Lab of Superhard Materials, Jilin University, Changchun 130012, China. E-mail: jlu_li1989@163.com
cKey Laboratory of Material Physics of Ministry of Education, School of Physical Engineering, Zhengzhou University, Zhengzhou 450052, China
First published on 9th October 2019
Abstract
In this work, we presented the influence of catalyst geometric construction on temperature distribution, flow structure, the transport processes of the carbon atoms, and the resulting diamond growth in the process of HPHT diamond synthesis. Several catalyst geometry models were tested, and the experimental results of growth rates were compared with numerical simulations. We revealed that increasing the protrusion diameter of the convex-shaped catalysts could significantly improve the growth rate of diamonds. The diamond growth rate was improved from 1.6 mg h−1 to 4 mg h−1 when the protrusion diameter was enlarged by 2 mm. These results will be discussed through the characteristic distributions of the temperature and convection fields in the process of diamond growth.
Introduction
High pressure and high temperature (HPHT) processes make it possible to produce high-quality large single-crystal diamonds, which can be used in a wide variety of industrial and commercial applications such as ultra-precision machining, electronics, optics, quantum processes and jewelry.1–16 The growth of large diamonds by the temperature gradient method (TGM) using HPHT processes occurs in solvent/catalyst environments. Using TGM, the temperature gradient of the catalyst provides the main driving force for diamond growth, while the carbon atoms in the catalyst can be transported to the seed crystal by convection flow.17–22 Thus, the temperature gradient and convection distribution of the catalyst are significant factors that determine the quality and growth rate of the synthesised diamond.The geometric construction (shape and size) of the catalyst can effectively improve the temperature distribution and convection structure of the catalyst. In ref. 20, the effect of the catalyst geometry shape on diamond growth was investigated. It was found that tabular and convex-shaped catalysts have completely different temperature and convection distribution characteristics, which are suitable for the synthesis of cubic-shaped and tower-shaped diamonds, respectively. However, the effect of the geometric size of the catalyst on the growth of diamonds has not been clarified. It is of great significance to clarify the influence of the catalyst geometric size on the temperature and convection characteristics and on the resulting diamond growth in order to improve crystal quality and optimize the diamond growth process.
In this study, we established several convex catalyst geometry models with different protrusion diameters to explore the influence of the catalyst geometric size on diamond growth. The temperature and convection distribution characteristics of the catalyst were simulated by the finite element method (FEM). By analyzing the temperature and convection numerical results, we revealed that increasing the protrusion diameter of the convex catalyst could significantly improve the growth rate of the diamond. The experimental results indicated the same conclusions as those of the numerical simulations. The findings of this study are expected to lead to further improvements in the production level and yield of large single crystal diamonds using the HPHT process.
Simulation and experimental details
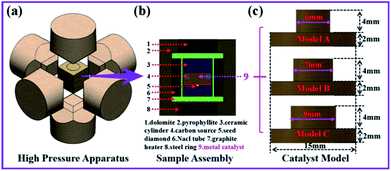
A 3D model of the high-pressure synthesis apparatus and the sample assembly were established, as shown in Fig. 1a and b. The multi-field coupling analysis module of ANSYS software was used to complete the numerical simulation of the temperature and convection fields of the synthesis cavity. Three convex catalyst geometry models with different protrusion diameters were designed. The protrusion diameter of model A was set as 6 mm, model B as 7 mm and model C as 8 mm, while the height (6 mm) and bottom diameter (15 mm) were exactly the same in all models, as shown in Fig. 1c. The three models used the same voltage and thermal boundary conditions in the simulation process, and the finite element model, material parameters and boundary conditions were obtained from our previous reports.23,24Experiments on the diamond synthesis were carried out in a china type cubic high pressure apparatus (CHPA) with a synthesis cavity of 42 × 42 × 42 mm3 at a pressure of 5.7 GPa and temperature of 1300 °C in all runs. High purity graphite powder (99.9% purity) and Fe64Ni36 alloy were used as the carbon source and the catalyst, respectively. Synthetic diamond crystals (size about 0.6 mm) were selected as the seed crystals. The temperature was measured in each experiment using a Pt-30% Rh/Pt-6% Rh thermocouple, whose junction was placed near the crystallization sample. The pressure was estimated by the oil press load, which was calibrated by a curve that was established on the pressure-induced phase transitions of Bi, Tl, and Ba. After the synthetic experiments, the diamond crystals were treated by HNO3 and H2SO4 to remove the residual metal and graphite from the surface and we obtained clean crystals. An optical microscope (OM) was used to observe the morphology, size and metal inclusions of the recovered diamond. Raman spectra were used to characterize the quality of the diamond crystals. The acquisition of the spectra was performed using a LabRam HR800 spectrometer (Horiba) with excitation at 514 nm and a laser spot-size of 100 μm.
Results and discussion
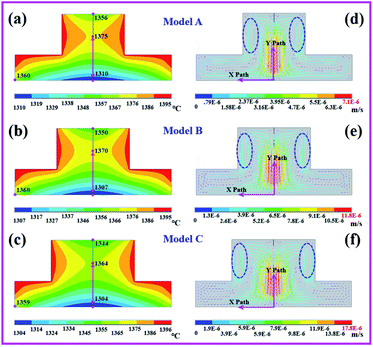
In this work, we only studied the growth mode of single crystal seeds. Due to the high thermal conductivity of diamonds, the temperature and convection fields of the multi-seed growth mode were significantly different from those of the single crystal seed. Research on the multi-seed growth mode will be discussed in a future work. First, we simulated the temperature and convection distributions for the initial growth phase of the diamonds, as shown in Fig. 2. From the simulation results, we can clearly see that the distributions of the temperature and convection fields are symmetrical. Fig. 2a, b and c show the temperature distribution results of models A, B, and C, respectively. We can see that the temperature at the contact position with the carbon source is the highest at about 1395 °C (red color), where the carbon solubility is the highest, and the low-temperature zone is at the seed position. In addition, we can observe that the temperature distributions of the convex part of the catalyst are obviously different. With the increase in the protrusion diameter, the temperature is more slowly transferred to the central position of the convex part, and a two-stage temperature difference appears in the vertical direction of the catalyst. The temperature difference between the center of the convex part of the catalyst and the seed location (pink arrow) directly affects the vertical growth rate of the diamond. We found that with the increase in the catalytic protrusion diameter, the vertical temperature difference of the catalyst increased, changed from 50 °C to 53 °C to 55 °C, and the horizontal temperature difference decreased from 65 °C to 63 °C to 60 °C. The temperature difference varied by just 2 or 3 degrees when the protrusion diameter was increased by 1 mm.The driving force for the diamond growth by TGM is provided by the solubility difference resulting from the temperature gradient in the catalyst. Therefore, the magnitude of the temperature gradient directly affects the growth rate of the diamond. According to the results of the temperature fields, we inferred that the temperature difference between the horizontal and vertical directions in the initial growth stage of the catalyst only changed by 2 or 3 degrees in the three models. The catalysts in models A, B and C had the same height and bottom diameter: 6 mm and 15 mm, respectively; this indicated that the temperature change of 2 to 3 degrees had only a slight impact on the horizontal and vertical temperature gradients during the initial growth stage of the diamond.
Fig. 2d–f show the convection distribution results of models A, B, and C. We can observe that the maximum convection intensity and velocity regions are near the diamond growth area, and the weak convection region is near the outer edge of the catalyst. Furthermore, at the contact position between the catalyst and the carbon source surrounded by the blue dotted line, the convection velocity is obviously greater than that at the other contact positions, which indicates where the carbon source will be consumed first. It is even more remarkable that as the protrusion diameter of the catalyst increased, the convection intensity in the region above the seed was enhanced significantly. Meanwhile, the peak values of convection velocity were 7.1 × 10⁻⁶ m s−1 for model A, 11.8 × 10⁻⁶ m s−1 for model B, and 17.8 × 10⁻⁶ m s−1 for model C, which indicated that the convection velocity increased obviously with the increase in the protrusion diameter of the catalyst. To further study the variation trends of convection velocity in different models, we selected X and Y paths (Fig. 2d–f) to compare the convection velocities in the three models.
Fig. 3 shows the comparison results of the convection velocity on the X and Y paths in models A, B, and C. We can observe that along the X and Y paths, model C has the highest convection velocity, followed by model B and model A. From Fig. 3a, it can be seen that in model C, the convection velocity in the horizontal direction from 2 mm to 6 mm exhibits little change, while in models B and C, the convection velocity in the horizontal direction at approximately 2 mm from the seed is significantly enhanced; however, the change in the convection velocity in the horizontal direction at the 6 mm location occurs just in a tight range. From Fig. 3b, we can see that the maximum convection velocity is located at 3 mm above the seed, while the increase in amplitude is about 1.5 times the increase in the protrusion diameter.
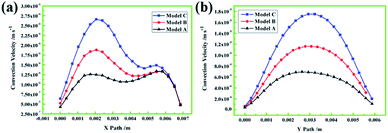 | ||
| Fig. 3 (a) Convection velocity on the X path in models A, B and C. (b) Convection velocity on the Y path in models A, B and C. | ||
In the process of crystal growth, convection is the main form of mass transport; thus, an increase in the convection velocity and intensity in the catalyst means that more carbon atoms will be transported from the carbon source to the seed diamond, which indicates that the diamond growth rate will increase. According to the convection and temperature field results, we found that the convection intensity around the seed diamond and the convection velocity in the vertical and horizontal directions increased significantly by enlarging the protrusion diameter of the convex-shaped catalyst, while the temperature gradient changed very little in the horizontal and vertical directions. Thus, we can infer that the growth rate of the diamond in the vertical and horizontal directions will be obviously improved with the increase in the protrusion diameter of the convex catalyst. The synthetic diamond in model C exhibited the maximum growth rate compared with those in models B and A in the initial growth stage.
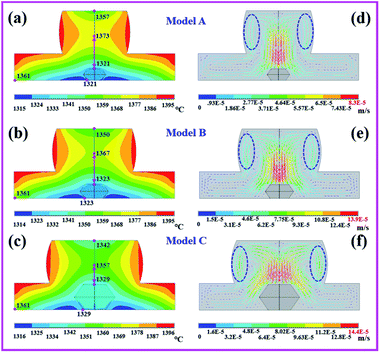
In the process of diamond growth, the influence of the volume change in the catalyst and the grown diamond on the temperature and convection distributions cannot be ignored. Therefore, we established a growth model within the grown diamond and obtained the temperature and convection simulation results, as shown in Fig. 4. According to the temperature simulation results, the vertical and horizontal temperature differences gradually decreased, while the vertical temperature difference changed greatly (model A, 52 °C; model B, 44 °C; model C, 28 °C). This result indicated that the vertical and horizontal temperature gradients of the diamond decreased with the increase in the diamond volume. According to the convection simulation results, we can observe that the area dotted with a blue line still represents the location where the carbon source is first consumed. More importantly, the regions with the strongest convection velocity and intensity are located around the grown diamond; the convection velocity and intensity at each crystal surface of the grown diamond in model C are significantly higher than those in models B and A. By observing the velocity bar, we can also find that the convection velocity in model C is still the largest (model A, 8.3 × 10⁻⁵ m s−1; model B, 13.9 × 10⁻⁵ m s−1; model C, 14.4 × 10⁻⁵ m s−1).
The temperature gradient and convection velocity in the catalyst jointly determine the growth rate of the diamond. Through the above numerical simulation results, it was found that with the increase in the diamond volumes in models A, B and C, the temperature gradient decreased gradually, while the convection velocity and intensity increased. The decrease in the temperature gradient represented a decrease in the growth rate, while the increase in the convection velocity represented an increase in the growth rate. Therefore, the diamond growth rates in the later growth stage in models A, B and C may tend to be consistent; the growth rate in each model depends on the relative magnitudes of the temperature gradient, convection velocity and intensity.
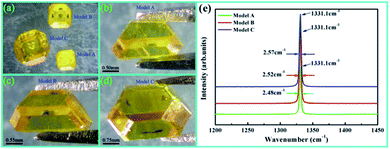
To confirm our analysis of the simulation results, all model experiments were conducted at a working pressure of 5.7 GPa and temperature of 1300 °C with an Fe–Ni catalyst on CHPA. A seed crystal with the {100} face and 0.6 × 0.6 mm2 size and a synthesis time of 15 hours was used in all experiments. Fig. 5a shows a comparison of the results of the crystal sizes synthesized by the three models. We can directly observe that the diamond synthesized by model C is the largest with a diameter of 3.7 mm and a weight of 60 mg. The growth rates of the diamonds synthesized by models A, B, and C were 1.6 mg h−1, 2.3 mg h−1 and 4.0 mg h−1, respectively. The experimental results showed that the crystal growth rate could be effectively improved by increasing the protrusion diameter of the convex catalyst. Examining the metal inclusions and Raman spectra of the samples allows one to assess the crystal quality. Overall, the diamonds displayed good crystalline quality, as evidenced by the low FWHM value of the Raman diamond peak at 1331.1 cm−1 and the lack of visible metal inclusions inside the crystal, as shown in Fig. 5b–e. We can only just distinguish the weak change in FWHM from 2.48 cm−1 to 2.52 cm−1 to 2.57 cm−1, which suggests that model A has the best crystal quality, followed by B and C, resulting from the different crystal growth rates.
Conclusions
In summary, increasing the protrusion diameter of the convex-shaped catalyst could significantly improve the growth rate of a large single crystal diamond. The numerical simulation results showed that the convection velocity and intensity in the horizontal and vertical directions of the catalyst increased significantly by enlarging the catalyst protrusion diameter, which led to an increase in the carbon atoms transported to the seed crystal and an improvement in the growth rate of the diamond. From the synthesis experiments, we inferred that the diamond growth rate improved from 1.6 mg h−1 to 4 mg h−1 when the protrusion diameter was enlarged by 2 mm. This study demonstrates that the diamond growth rate can be controlled by optimizing the geometrical construction of a catalyst.Conflicts of interest
There are no conflicts to declare.Acknowledgements
This project was supported by the National Natural Science Foundation of China (No. 11804305); sponsored by Natural Science Foundation of Chongqing, China. (No. cstc2019jcyj-msxmX0391); supported by Youth Project of Science and Technology Research Program of Chongqing Education Commission of China. (No. KJQN201901405).Notes and references
- S. Koizumi, K. Watanabe, M. Hasegawa and H. Kanda, Science, 2001, 292, 1899 CrossRef CAS PubMed.
- D. C. Shin, B. V. Sarada, D. A. Tryk and A. Fujishima, Anal. Chem., 2003, 75, 530 CrossRef CAS.
- M. Barletta, G. Rubino, R. Valle and R. Polini, ACS Appl. Mater. Interfaces, 2012, 4, 694 CrossRef CAS.
- P. Achatz, O. A. Williams, P. Bruno, D. M. Gruen, J. A. Garrido and M. Stutzmann, Phys. Rev. B: Condens. Matter Mater. Phys., 2006, 74, 155429 CrossRef.
- X. B. Liu, X. P. Jia, Z. F. Zhang, Y. Li, M. H. Hu, Z. X. Zhou and H. A. Ma, Cryst. Growth Des., 2011, 11, 3844 CrossRef CAS.
- G. D. Fuchs, G. Burkard, P. V. Klimov and D. D. Awschalom, Nat. Phys., 2011, 7, 789 Search PubMed.
- Y. Shvyd'ko, V. Blank and S. Terentyev, MRS Bull., 2017, 42, 437 CrossRef.
- C. X. Liu, M. V. Gurudev Dutt and D. PekkerK, Phys. Rev. A, 2018, 98, 052342 CrossRef CAS.
- M. Kozák, T. Otobe, M. Zukerstein, F. Trojánek and P. Malý, Phys. Rev. B, 2019, 99, 104305 CrossRef.
- S. B. Van Dam, M. Walsh, M. J. Degen, E. Bersin, S. L. Mouradian, A. Galiullin, M. Ruf, M. IJspeert, T. H. Taminiau, R. Hanson and D. R. Englund, Phys. Rev. B, 2019, 99, 161203 CrossRef CAS.
- M. P. Backlund, P. Kehayias and R. L. Walsworth, Phys. Rev. Appl., 2017, 8, 054003 CrossRef.
- H. Siampour, S. Kumar and S. I. Bozhevolnyi, Nanoscale, 2017, 9, 17902 RSC.
- F. Peyskens, D. Chang and D. Englund, Phys. Rev. B, 2017, 96, 235151 CrossRef.
- A. F. Khokhryakov, Y. N. Palyanov, Y. M. Borzdov, A. S. Kozhukhov and D. V. Sheglov, Diamond Relat. Mater., 2018, 88, 67 CrossRef CAS.
- A. A. Shiryaev, D. A. Zolotov, O. M. Suprun, S. A. Ivakhnenko, A. A. Averin, A. V. Buzmakov, V. V. Lysakovskyi, I. G. Dyachkova and V. E. Asadchikov, CrystEngComm, 2018, 20, 7700 RSC.
- Y. N. Palyanov, I. N. Kupriyanov, A. F. Khokhryakov and Y. M. Borzdov, CrystEngComm, 2017, 19, 4459 RSC.
- N. Chen, H. A. Ma, B. M. Yan, L. C. Chen, L. X. Chen, L. S. Guo, X. Y. Miao, C. Fang and X. P. Jia, Cryst. Growth Des., 2018, 18, 3870 CrossRef CAS.
- L. S. Guo, H. A. Ma, L. C. Chen, N. Chen, X. Y. Miao, Y. Wang, S. Fang, Z. Q. Yang, C. Fang and X. P. Jia, CrystEngComm, 2018, 20, 5457 RSC.
- X. Y. Miao, L. C. Chen, H. A. Ma, C. Fang, L. S. Guo, S. Fang, Y. Wang and X. P. Jia, CrystEngComm, 2018, 20, 7109 RSC.
- Y. D. Li, X. P. Jia, N. Chen, L. C. Chen, L. S. Guo, C. X. Wang, G. Li, S. S. Sun and H. A. Ma, CrystEngComm, 2017, 19, 137 RSC.
- M. H. Hu, N. Bi, S. S. Li, T. C. Su, Q. Hu, X. P. Jia and H. A. Ma, Int. J. Refract. Met. Hard Mater., 2015, 48, 61 CrossRef CAS.
- Y. Li, Y. D. Li, Y. Wang, J. Zhang, M. S. Song, Y. C. She and X. Z. Chen, CrystEngComm, 2018, 20, 4127 RSC.
- Y. D. Li, X. P. Jia, B. M. Yan, N. Chen, C. Fang, Y. Li, S. S. Sun and H. A. Ma, RSC Adv., 2016, 6, 40330 RSC.
- Z. C. Li, X. P. Jia, G. F. Huang, M. H. Hu, Y. Li, B. M. Yan and H. A. Ma, Chin. Phys. B, 2013, 22, 014701 CrossRef.
| This journal is © The Royal Society of Chemistry 2019 |

