 Open Access Article
A single-phase white light emitting phosphor Ba3Y(PO4)3:Ce3+/Tb3+/Mn2+: luminescence, energy transfer and thermal stability
Yun
Chen
,
Wenge
Ding
*,
Panlai
Li
 *,
Xue
Li
,
Qi
Bao
,
Jinjin
Liu
,
Keliang
Qiu
,
Xiangyu
Meng
,
Zhiping
Yang
and
Zhijun
Wang
 *
*
National-Local Joint Engineering Laboratory of New Energy Photoelectric Devices, Hebei Key Laboratory of Optic-electronic Information and Materials, College of Physics Science & Technology, Hebei University, Baoding 071002, China. E-mail: dwg@hbu.edu.cn; li_panlai@126.com; wangzj1998@126.com
First published on 25th September 2019
Abstract
A series of Ce3+/Tb3+, Tb3+/Mn2+ and Ce3+/Tb3+/Mn2+ doped Ba3Y(PO4)3 were synthesized by the high temperature solid state method. Phase formation, energy transfer, luminescence properties and thermal quenching properties of phosphors were analyzed in detail. For the co-doped samples, the energy transfer from Ce3+ to Tb3+ and Tb3+ to Mn2+ was proved by analyzing the spectra and fluorescence lifetime, and the energy transfer mechanism was calculated to be dipole–dipole interaction. A series of color-tunable phosphors were obtained by the energy transfer from Ce3+ to Tb3+ and Tb3+ to Mn2+. For the tri-doped samples, it was confirmed that the energy transfers from Ce3+ to Tb3+, Tb3+ to Mn2+ and Ce3+ to Mn2+ exist at the same time by analyzing the spectra properties, and it can emit warm-white light with extensive color temperature regulability. In addition, the thermal stability was abnormal and outstanding because the defects exist in the samples. The results show that the phosphors may be novel warm white emitting phosphors for white light emitting diodes.
1 Introduction
In recent years, white-light-emitting diodes (LEDs) have received more and more attention for their many advantages1 Compared with traditional light sources, white LEDs have higher efficiency, higher brightness, longer service time and are more environmentally friendly, hence they are considered as the fourth generation light source.1–7 The most common method to synthesize white LEDs is to combine the GaN blue LED chip with yellow phosphor YAG:Ce3+. However, this type of white LED has many drawbacks due to lack of a red ingredient, such as the poor color rendering index and the high correlated color temperature.3,4,8 Because white LEDs can not only be used in lighting field, but also in display and medical fields, hence they should show specific optical performance in different application scenarios which means that phosphors with high tunability are needed.7,9 Nowadays, the ultraviolet-excited single-phased phosphors have been taken seriously, which can achieve white light with good color rendering index, suitable correlated color temperature and tunable emission by adjusting the doping ratio of different ions.10–13 Therefore, it is urgent to find novel and high performance single-phased phosphors. Generally, when doping rare earth ions or transition metal ions into compound, the white emitting phosphor may be achieved by the energy transfer between different activator ions,14 such as Ca10Na(PO4)7:Ce3+/Tb3+/Mn2+,15 Na2Ba6(Si2O7)(SiO4)2:Ce3+/Eu2+/Tb3+/Mn2+.16 Among many host compounds, the eulytite-type orthophosphates with the type of M3IMII(PO4)3 (MI = Ba, Sr, Ca, and Pb, MII = La, Sc, Y, Bi, and In) have attracted great interests, for example, when doped Ce3+, Tb3+, and Mn2+ in Ba3Y(PO4)3 (BYP), the phosphors can produce blue, green and red light, respectively.17–19 Thus, it is possible to achieve white emission when the above three ions are tri-doped in BYP. Moreover, the thermal stability of phosphor is an essential characteristic. It has been reported in our previous work that BYP:Ce3+,Mn2+ shows extraordinary thermal stability due to the existence of defect in the samples.17 It is expectable that the defect is to be utilized to gain a series of phosphors with high temperature stability in Ce3+/Tb3+/Mn2+ doped BYP. In this work, series of Ce3+/Tb3+, Tb3+/Mn2+ or Ce3+/Tb3+/Mn2+ doped BYP are obtained. Phase formation, energy transfer, luminescence properties and thermal property were investigated in detail. Finally, series of single-phased white emitting phosphors are obtained by the energy transfer Ce3+ → Tb3+, Tb3+ → Mn2+ and Ce3+ → Mn2+.2 Experimental
2.1 Sample preparation
Series of Ba3Y0.95−x(PO4)3:0.05Ce3+,xTb3+, Ba3−yY0.95(PO4)3:0.05Ce3+,yMn2+ and Ba2.86Y0.7−z(PO4)3:zCe3+,0.3Tb3+,0.14Mn2+ were synthesized by a high temperature solid state method. Raw materials BaCO3 (analytical reagents, A.R.), NH4H2(PO4)3 (A.R.), Y2O3 (99.99%), CeO2 (99.99%), Tb4O7 (99.99%) and MnCO3 (A.R.) were weighed according to stoichiometric proportions, and then mixed them in an agate mortar pestling for 20 min to ensure the materials are distributed uniformly. The mixed materials were put into crucibles and heated at 1300 °C for 3 h in a carbon reducing atmosphere. After firing, the samples cooled to room temperature slowly and were grounded into powder for subsequent use.2.2 Materials characterization
XRD patterns of sample are measured by powder X-ray diffraction (XRD) using a D8-A25 Focus diffractometer at 40 kV and 40 mA with step size of 0.05° and a scan speed 0.1 s per step. Spectral property of sample was measured by Hitachi F-4600 fluorescence spectrophotometer with a 450 W Xe lamp as the excitation source. Decay curves were measured by Horiba FL-4600 fluorescence spectrophotometer with a 320 nm pulse laser radiation (nano-LED) for Ce3+ and 450 W Xe lamp as the excitation resource for Mn2+ at room temperature. Thermoluminescence spectra of samples were measured by a FJ-427A1 TL dosimeter at room temperature with a fixed heating rate of 1 k s−1 within the range 300–450 K. Commission Internationale de L'Eclairage (CIE) chromaticity coordinates of samples were obtained by the PMS-80 spectral analysis system.3 Results and discussion
3.1 Phase formation
The XRD patterns of BYP:0.05Ce3+,xTb3+ (x = 0.02, 0.45), BYP:0.05Ce3+,yMn2+ (y = 0.08, 0.14) and BYP:zCe3+,0.3Tb3+,0.14Mn2+ (z = 0.07, 0.15) were shown in Fig. 1. It can be seen that no apparent impurity phase appears and all the diffraction peaks of samples can be indexed to the standard card of BYP (JCPDS No. 44-0318) appropriately. The XRD patterns illustrates that Ce3+, Tb3+ and Mn2+ did not cause any significant change to the crystal structure of BYP and series of pure phase phosphors were obtained.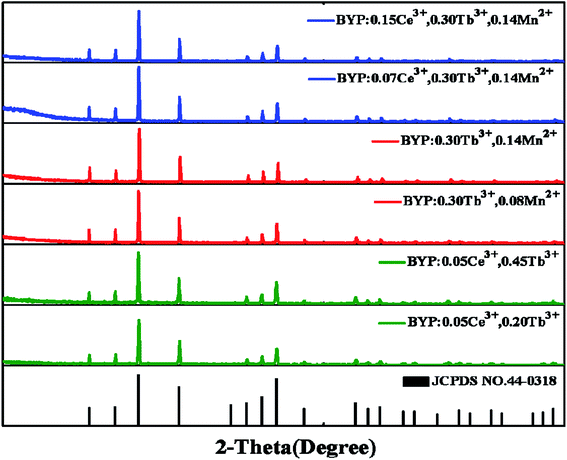 | ||
| Fig. 1 XRD patterns of the representative samples and the standard patterns of Ba3Y(PO4)3 (JCPDS No. 44-0318). | ||
3.2 Luminescence and energy transfer properties of BYP:Ce3+,xTb3+
Fig. 2a–c display the emission and excitation spectra of BYP:0.05Ce3+ (λex = 330 nm, λem = 400 nm), BYP:0.45Tb3+ (λex = 377 nm, λem = 550 nm) and BYP:0.05Ce3+,0.15Tb3+ (λex = 330 nm, λem = 400 nm, 550 nm), respectively. The emission spectrum of BYP:0.05Ce3+ shows a blue emission band peaking at 400 nm, which originates from the electron transition 5d → 4f of Ce3+. The excitation band of BYP:0.05Ce3+ ranges from 200 nm to 360 nm (λmax = 330 nm) due to the 4f → 5d electron transition. For BYP:0.45Tb3+, a series of characteristic emission peaks of Tb3+ appear in the emission spectrum which originates from the electron transition 5D4 → 7F6 (500 nm), 5D4 → 7F5 (550 nm), 5D4 → 7F4 (590 nm) and 5D4 → 7F3 (630 nm) of Tb3+, respectively. The excitation spectrum of BYP:0.45Tb3+ shows a broad excitation band from 210 nm to 400 nm because of the allowed 4f8–4f75d transition and intra-configuration transition of Tb3+. Comparing the emission spectrum of BYP:0.05Ce3+ with the excitation spectrum of BYP:0.45Tb3+, an obvious spectral overlapping can be observed which means an effective energy transfer from Ce3+ to Tb3+ (ETCe–Tb) may be occur.19,20 In addition, the emission spectrum of BYP:0.05Ce3+,0.15Tb3+ contains both the emission band of Ce3+ and Tb3+, the excitation spectrum monitored at 550 nm (emission peak of Tb3+) has the similar profile with that monitored at 400 nm (emission peak of Ce3+), it also means that there may be energy transfer from Ce3+ to Tb3+.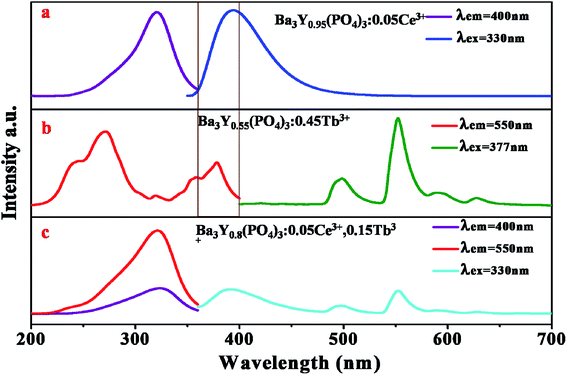 | ||
| Fig. 2 Emission and excitation spectra of (a) BYP:0.05Ce3+; (b) BYP:0.45Tb3+; (c) BYP:0.05Ce3+,0.15Tb3+. | ||
In order to further investigate the luminescence properties, a series of BYP:Ce3+,xTb3+ were synthesized. Fig. 3a shows the emission spectra of BYP:0.05Ce3+,xTb3+ (x = 0–0.45) under 330 nm UV excitation. Fig. 3b reveals the emission intensity of Ce3+ (λem = 400 nm) and Tb3+ (λem = 550 nm), it can be seen that the emission intensity of Ce3+ declines constantly as the concentration of Tb3+ increasing, meanwhile, the emission intensity of Tb3+ goes up ceaselessly. According to the change of emission intensity, it means that an effective energy transfer from Ce3+ to Tb3+ is expectable.
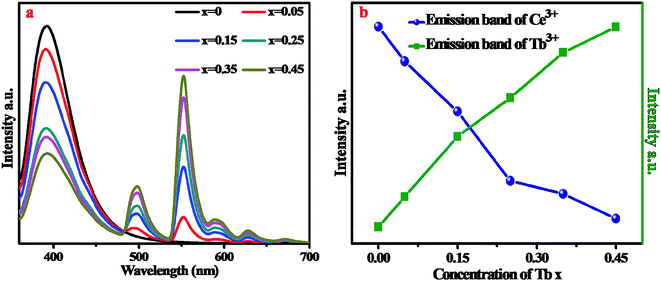 | ||
| Fig. 3 (a) Emission spectra of BYP:0.05Ce3+,xTb3+ (x = 0–0.45). (b) Emission intensity of Ce3+ and Tb3+ as a function of Tb3+ concentration. | ||
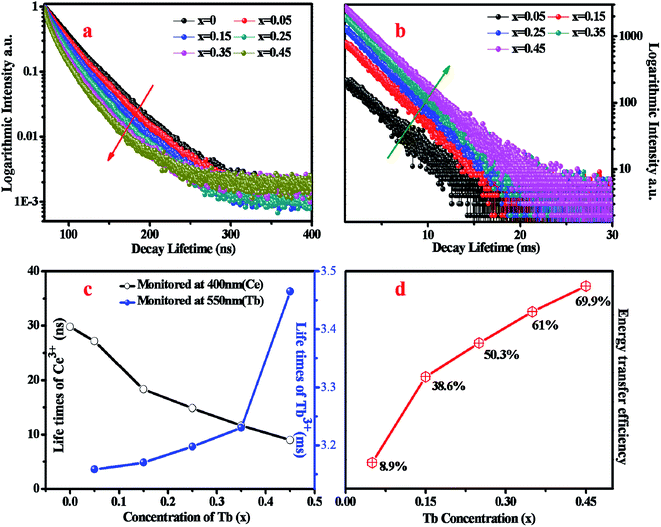
To confirm the energy transfer from Ce3+ to Tb3+, the decay curves of Ce3+ monitored at 400 nm under 320 nm pulse laser radiation (nano-LED) excitation and decay curves of Tb3+ monitored at 550 nm under 377 nm excitation for BYP:0.05Ce3+,xTb3+ are shown in Fig. 4a and b, respectively. The decay curves of Ce3+ and Eu2+ can be matched well with second-order exponential function, which can be expressed as the following expression:21,22
I(t) = A1![[thin space (1/6-em)]](https://www.rsc.org/images/entities/char_2009.gif) exp(t/τ1) + A2 exp(t/τ1) + A2![[thin space (1/6-em)]](https://www.rsc.org/images/entities/char_2009.gif) exp(t/τ2) exp(t/τ2) | (1) |
| τ* =(A1τ12 + A2τ22)/(A1τ1 + A2τ2) | (2) |
The calculated average lifetime of Ce3+ and Tb3+ are shown in Fig. 4c, from which one can see that the lifetime of Ce3+ decreases consistently and that of Tb3+ increases consistently with increasing Tb3+ concentration. The lifetime can strongly prove the energy transfer from Ce3+ to Tb3+, and the energy transfer efficiency can be calculated by the following equation9,22
| ηT = 1 − τ/τ0 | (3) |
According to Dexter's theory, there are two types of interactions between sensitizers and activators: multipolar interaction and exchange interaction.21,24 The critical distance between Ce3+ and Tb3+ (RCe–Tb) is a critical factor to judge which type it belongs to, and the critical distance RCe–Tb can be calculated by the following formula25
 | (4) |
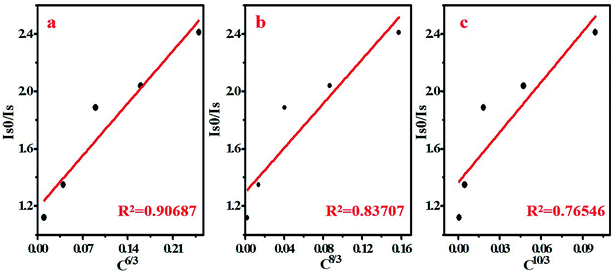
There are three kinds of multipolar interactions: dipole–dipole, dipole–quadrupole and quadrupole–quadrupole interaction. The mechanism of ETCe–Tb can be discussed by Dexter's theory:24,26
 | (5) |
The Commission Internationale de L'Eclairage (CIE) chromaticity coordinates of BYP:0.05Ce3+,xTb3+ (x = 0–0.45) was calculated basing on the relevant emission spectra under 330 nm excitation. The results along with luminescent photographs of related phosphors are depicted in Fig. 6, the emission color of BYP:0.05Ce3+,xTb3+ can be modulated from blue (0.1622, 0.0406) to yellow-green (0.2946, 0.4169). Hence, series of color-tunable phosphors were synthesized successfully.
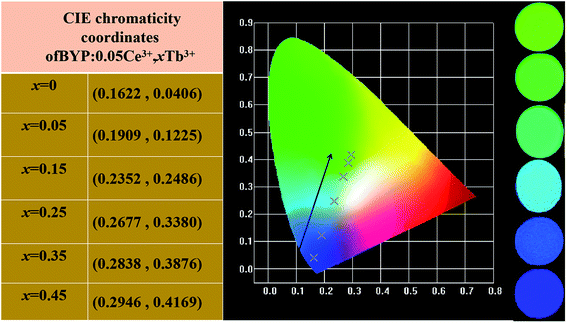 | ||
| Fig. 6 CIE chromaticity coordinates of BYP:0.05Ce3+,xTb3+ (x = 0–0.45) along with their luminescent photographs. | ||
To analyze the thermal stability of BYP:0.05Ce3+,xTb3+, the temperature-dependent emission spectra of BYP:0.05Ce3+,0.45Tb3+ excited by 330 nm were measured which is shown in Fig. 7a, and the emission intensity of Ce3+ and Tb3+ with increasing the temperature is depicted in Fig. 7b. It can be seen from the pictures that the emission intensity of Ce3+ shows a first increases and then decreases with increasing the temperature, but it remains 107.7% of the initial value (300 K) when the temperature reaches 425 K. As for Tb3+, its emission intensity increases constantly and reaches to 138.8% of the initial value when the temperature reaches 425 K. The abnormal change of emission intensity of Ce3+ and Tb3+ with temperature may be caused by the defects in BYP:0.05Ce3+,0.45Tb3+.28–30Fig. 8a shows the thermoluminescence spectrum of BYP:0.05Ce3+,0.45Tb3+, it can be seen that there are two emission bands ranging from 400 K to 420 K and from 460 K to 480 K, respectively. The thermoluminescence spectrum confirms the existence of defects. Fig. 8b depicts how defects affect the thermal stability of BYP:0.05Ce3+,xTb3+: the shallow trap D1 and deep trap D2 can store the electrons, but the electrons transmit to the conduction band when BYP:0.05Ce3+,xTb3+ are heated. After that, a part of electrons transmit to 5D4 energy level of Tb3+ and 5d energy band of Ce3+ from conduction band, then more electrons transmit from 5D4 to 7FJ energy level and 5d to 4f energy band by radiative transition meaning more energy would be released. Thus, the emission intensity of Ce3+ and Tb3+ rise up with increasing temperature.29
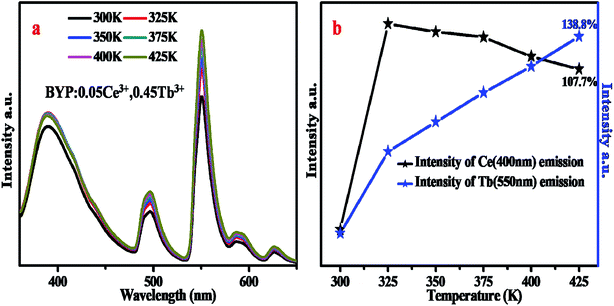 | ||
| Fig. 7 (a) Temperature-dependent emission spectra of BYP:0.05Ce3+,xTb3+ excited by 330 nm. (b) Relative intensity of Ce3+ and Tb3+ in the temperature-dependent emission spectra. | ||
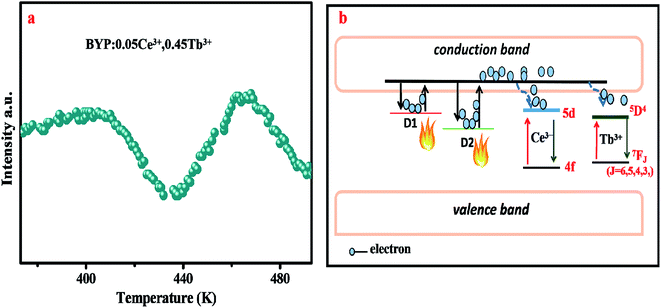 | ||
| Fig. 8 (a) Thermoluminescence spectrum of BYP:0.05Ce3+,0.45Tb3+. (b) Schematic diagram of the interaction between the defect and temperature-dependent emission intensity in BYP:0.05Ce3+,0.45Tb3+. | ||
3.3 Luminescence and energy transfer of BYP:0.4Tb3+,yMn2+
The emission spectra of BYP:0.4Tb3+,yMn2+ excited by 377 nm UV-light are shown in Fig. 9a and the relative emission intensities at 550 nm and 600 nm are depicted in Fig. 9b. The emission intensity of Tb3+ (550 nm) decreases constantly with increasing Mn2+ concentration, it means that Mn2+ may absorb energy from Tb3+. It is worth noting that the emission peaks of Tb3+ and Mn2+ coexist at 600 nm, as increasing Mn2+ concentration the source of the peak at 600 nm change from Tb3+ (5D4–7F4) to both Mn2+ (4T1–6A1) and Tb3+ and Mn2+ is a main source. The intensity of the peak at 600 nm shows a first decrease, then increase and decrease in the end. The possible energy transfer maybe the main reason for the intensity changing: as increasing Mn2+ concentration the energy transfer from Tb3+ to Mn2+ started to work, thus the emission intensity shows a first decrease; after that, the concentration of Mn2+ is enough, hence the source of the emission peak mainly originates from Mn2+ and the emission intensity of Tb3+ is too low, thus the emission intensity of the peak at 600 nm started to pick up. In the end, the concentration of Mn2+ reaches the quenching point, so its emission intensity started to decrease again.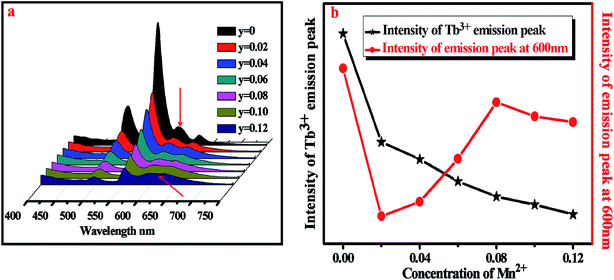 | ||
| Fig. 9 (a) Emission spectra of BYP:0.4Tb3+,yMn2+ (y = 0–0.12). (b) Relative emission intensity at 550 nm and 600 nm. | ||
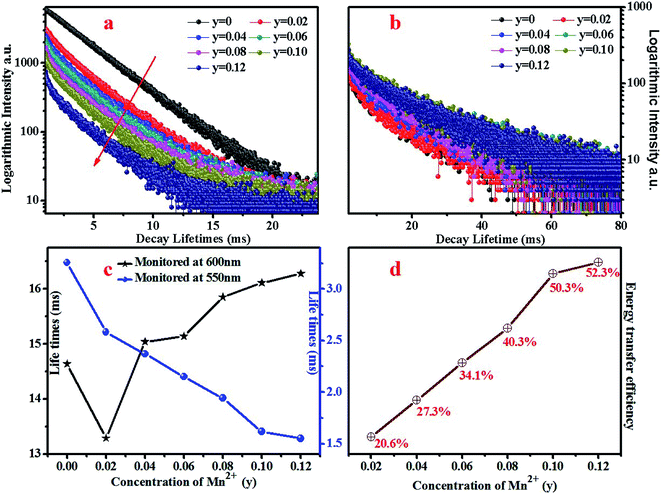
To confirm the energy transfer from Tb3+ to Mn2+ in BYP:0.4Tb3+,yMn2+, the decay curves of Tb3+ (λem = 550 nm, λex = 377 nm) and monitored at 600 nm (including Tb3+ and Mn2+, λex = 377 nm) are shown in Fig. 10a and b, respectively. The decay curves can be matched well with second-order exponential function expression (2), by means of expression (2) the average lifetimes can be calculated and the results are shown in Fig. 10c. It can be seen that the lifetime of Tb3+ decreases constantly as increasing Mn2+ concentration, this can prove the energy transfer from Tb3+ to Mn2+ (ETCe–Tb). In addition, the lifetime monitored at 600 nm shows a first decrease when y = 0 rises to y = 0.02, then increase when y = 0.02 rises to y = 0.08. This phenomenon is due to the low concentration of Mn2+ at the beginning, the measured and calculated lifetimes are mainly originated from Tb3+, hence the lifetime decrease. When increased Mn2+ concentration, it passed into the lifetime of Mn2+, thus the lifetime starts to increase.
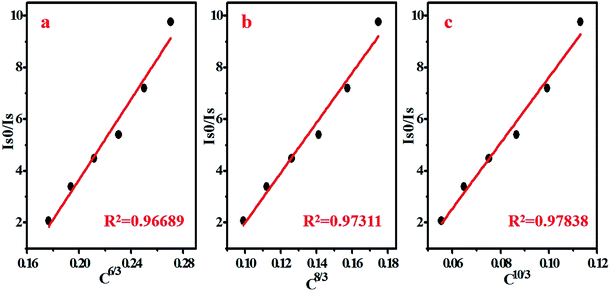
The energy transfer efficiency of ETTb–Mn had been calculated by formula (3) and the results are shown in Fig. 10d. It can be seen that the energy transfer efficiency increases as Mn2+ concentration increasing and the maximum value is 52.3% when y = 0.12. The critical distance from Tb3+ to Mn2+ (RcTb–Mn) can be calculated by expression (4), for BYP:0.4Tb3+,yMn2+, χc is calculated to be 0.42 and the RcTb–Mn is calculated to be 13.84 Å which is obviously larger than the maximum distance of 5 Å for the exchange interaction. Thus it can be confirmed that the type of interaction between Tb3+ and Mn2+ is multipolar interaction. The linear relationship between I0/I and Cn/3 for BYP:0.4Tb3+,yMn2+ are illustrated in Fig. 11a, and a well fitted curve can be gotten when n = 10 and R2 = 0.97838, therefore, it can be confirmed that the ETTb–Mn mechanism is quadrupole–quadrupole interaction.
The Commission Internationale de L'Eclairage (CIE) chromaticity coordinates of BYP:0.4Tb3+,yMn2+ (y = 0.02–0.12) was calculated basing on the relevant emission spectra under 377 nm excitation. The calculated results along with luminescent photographs of related phosphors are depicted in Fig. 12, the emission color of BYP:0.4Tb3+,yMn2+ can be modulated from yellow-greenish (0.3329, 0.5275) to white (0.3936, 0.3562). Thus, BYP:0.4Tb3+,yMn2+ can act as a color-tunable material which can be used in near UV based white LEDs.
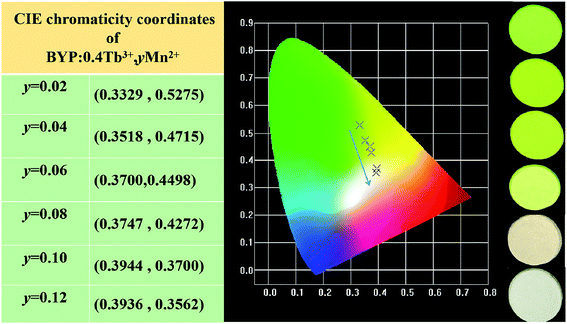 | ||
| Fig. 12 CIE chromaticity coordinates of BYP:0.4Tb3+,yMn2+ (y = 0.02–0.12) along with their luminescent photographs. | ||
The temperature-dependent emission spectra of BYP:0.4Tb3+,0.12Mn2+ excited by 377 nm was measured and shown in Fig. 13a, and the emission intensity of Tb3+ and Mn2+ is presented in Fig. 13b. It can be seen from Fig. 13a that the emission peak of Mn2+ shifts from 600 nm to 588 nm due to the thermally active phonon-assisted excitation from lower energy levels to higher energy levels in the excited state of Mn2+.24 Because of the thermal quenching, the emission intensity of Mn2+ decreases continually with the increase of temperature and remains 80.5% of the initial value (300 K) when the temperature reaches 425 K. However, the emission intensity of Tb3+ increases continually, and when the temperature reaches 425 K the emission intensity rises to 111.6% of the initial value.
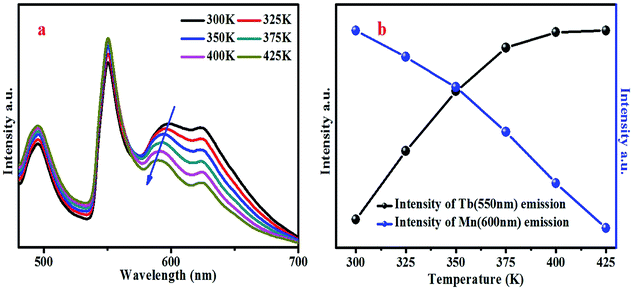 | ||
| Fig. 13 (a) Temperature-dependent emission spectra of BYP:0.4Tb3+,0.12Mn2+ excited by 377 nm. (b) Relative intensity of Tb3+ and Mn2+ in the temperature-dependent emission spectra. | ||
The abnormal change of emission intensity of Tb3+ is also caused by the defects in BYP:0.4Tb3+,0.12Mn2+. Fig. 14a depicts the thermoluminescence spectrum of BYP:0.4Tb3+,0.12Mn2+, as mentioned in Chapter 3.2: the emission intensity change of Ce3+ and Tb3+ in temperature-dependent emission spectra of BYP:0.05Ce3+,0.45Tb3+. Fig. 14b is the schematic diagram on how the defects affect the emission intensity of Tb3+ in BYP:0.4Tb3+,0.12Mn2+.
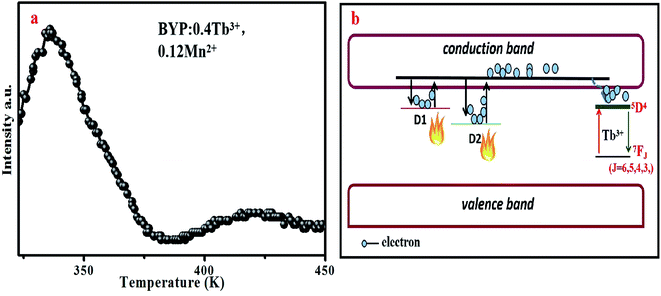 | ||
| Fig. 14 (a) Thermoluminescence spectrum of BYP:0.4Tb3+,0.12Mn2+. (b) Schematic diagram of the interaction between the defect and temperature-dependent emission intensity in BYP:0.4Tb3+,0.12Mn2+. | ||
3.4 Luminescence and energy transfer of BYP:zCe3+,0.4Tb3+,0.12Mn2+
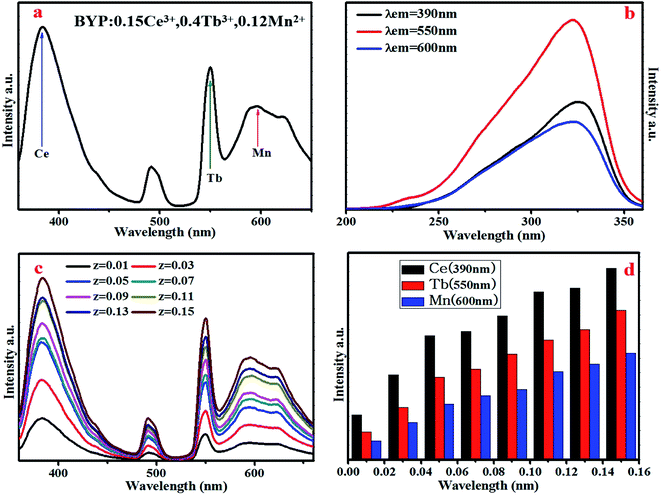
Fig. 15a shows the emission spectra of BYP:0.15Ce3+,0.4Tb3+,0.12Mn2+ excited by 330 nm, it can be seen that the emission peaks of Ce3+ (390 nm), Tb3+ (550 nm) and Mn2+ (600 nm) coexist in the emission spectra covering blue, yellow, green and red region, thus, the efficient white emission is expectable. Fig. 15b depicts the excitation spectra of BYP:0.15Ce3+,0.4Tb3+,0.12Mn2+ monitored at 390 nm, 550 nm and 600 nm, from which one can see that the obtained three spectra have the similar profile, it means that there is energy transfer among Ce3+, Tb3+ and Mn2+. To further investigate the luminescence and energy transfer, the emission spectra of BYP:zCe3+,0.4Tb3+,0.12Mn2+ under 330 nm excitation are shown in Fig. 15c, the relative intensity of Ce3+, Tb3+ and Mn2+ is depicted in Fig. 15d. It can be seen that the emission intensity of Ce3+, Tb3+ and Mn2+ increase continuously with increasing Ce3+ concentration, it indicates that there are ETCe–Tb, ETCe–Mn and ETTb–Mn in BYP:zCe3+,0.4Tb3+,0.12Mn2+.Fig. 16 shows the Commission Internationale de L'Eclairage (CIE) chromaticity coordinates of BYP:zCe3+,0.4Tb3+,0.12Mn2+ (z = 0.01–0.11) and luminescent photographs of related phosphors when excited by 330 nm UV excitation. The emission color of BYP:zCe3+,0.4Tb3+,0.12Mn2+ can be modulated from white (0.3030 , 0.2893) with high color temperature to white (0.4096 , 0.3770) with low color temperature, viz., a series of single-phased white light-emitting phosphors are realized successfully, and it maybe a potential application in white LEDs.
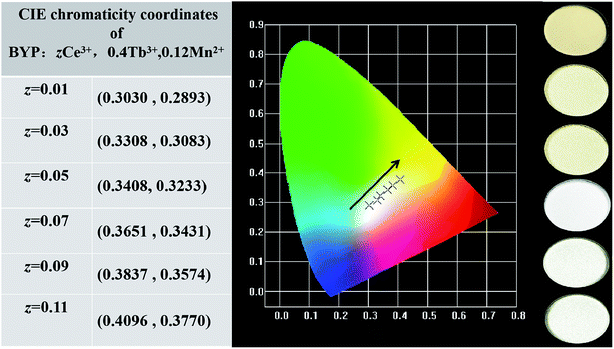 | ||
| Fig. 16 CIE chromaticity coordinates of BYP:zCe3+,0.4Tb3+,0.12Mn2+ (z = 0.01–0.11) along with their luminescent photographs. | ||
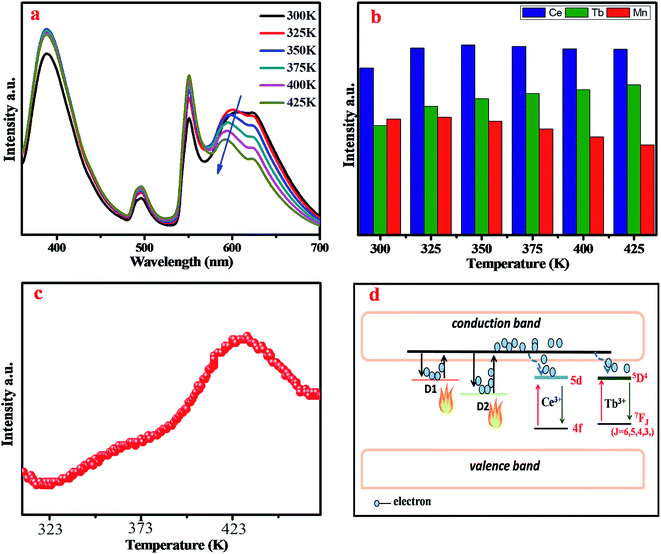
As a representative, BYP:0.03Ce3+,0.4Tb3+,0.12Mn2+ was chosen to explore the thermal stabilities. Fig. 17a depicts the temperature-dependent emission spectra of BYP:0.03Ce3+,0.4Tb3+,0.12Mn2+ under 330 nm UV excitation, Fig. 17b shows the emission intensity of Ce3+, Tb3+ and Mn2+. The emission peak of Mn2+ shifts from 600 nm to 587 nm with increasing the temperature and the reason is the same as that mentioned above, it is because of the thermally active phonon-assisted of Mn2+. With rising of temperature, the emission intensity of Mn2+ decreases due to thermal quenching effect and it still remains 80.8% of the initial value when the temperature rises to 425 K. The emission intensity of Ce3+ shows a first increase and then decrease, the emission intensity of Tb3+ increases constantly with increasing temperature. Fig. 17c presents the thermoluminescence spectrum of BYP:0.03Ce3+,0.4Tb3+,0.12Mn2+. The change in emission intensity of Ce3+ and Tb3+ is ascribed to the same theory as mentioned in chapter 3.2: the emission intensity change of Ce3+ and Tb3+ in temperature-dependent emission spectra of BYP:0.05Ce3+,0.45Tb3+. Fig. 17d is the schematic diagram on how the defects affect the emission intensity of Ce3+ and Tb3+ in BYP:0.03Ce3+,0.4Tb3+,0.12Mn2+.
4 Conclusions
In summary, a series of eulytite-typed and single-phased phosphors BYP:0.05Ce3+, xTb3+, BYP:0.05Ce3+, yMn2+ and BYP:zCe3+,0.3Tb3+,0.14Mn2+ were synthesized successfully. The energy transfer from Ce3+ to Tb3+ and Tb3+ to Mn2+ were confirmed by analyzing its spectra and fluorescence lifetime. The thermal stability of samples is extraordinary, and it had been proved that the unusual temperature performance is caused by the defects in the samples. Finally, a series of single-phased color-tunable with high thermal stability phosphors were obtained, especially BYP:zCe3+,0.3Tb3+,0.14Mn2+, it can emit warm white light and the color temperature can be modulated by the energy among Ce3+, Tb3+ and Mn2+. Thus, it may have application potential in white LEDs.Conflicts of interest
There are no conflicts to declare.Acknowledgements
The work is supported by the National Natural Science Foundation of China (Nos. 51672066, 51902080), the Funds for Distinguished Young Scientists of Hebei Province, China (No. A2018201101), and the Natural Science Foundation of Hebei Province, China (No. E2019201223).References
- J. W. Qiao, Z. Zhao, Q. L. Liu and Z. G. Xia, Recent advances in solid-state LED phosphors with thermally stable luminescence, J. Rare Earths, 2019, 37, 565–572 CrossRef CAS.
- C. Li, H. W. Zheng, H. W. Wei, S. J. Qiu, L. Xu, X. M. Wang and H. Jiao, Color tunable and white light emitting Ca2Si5N8:Ce3+, Eu2+ phosphor via efficient energy transfer for near-UV white LEDs, Dalton Trans., 2018, 47(19), 6860–6867 RSC.
- F. B. Xiong, S. X. Liu, H. F. Lin, X. G. Meng, S. Y. Lian and W. Z. Zhu, A novel white-light-emission phosphor Dy3+-doped CaLaB7O13 under UV excitation, Opt. Laser Technol., 2018, 106, 29–33 CrossRef CAS.
- M. Zhao, H. Liao, M. S. Molokeev, Y. Zhou, Q. Zhang, Q. Liu and Z. Xia, Emerging ultra-narrow-band cyan-emitting phosphor for white LEDs with enhanced color rendition, Light: Sci. Appl., 2019, 8, 38 CrossRef PubMed.
- X. Y. Huang and H. Guo, LiCa3MgV3O12:Sm3+: A new high-efficiency white-emitting phosphor, Ceram. Int., 2018, 44, 10340–10344 CrossRef CAS.
- N. T. K. Chi, N. T. Tuan, N. T. K. Lien and H. Nguyen, Red Emission of SrAl2O4:Mn4+ Phosphor for Warm White Light-Emitting Diodes, J. Electron. Mater., 2018,(10), 1–8 CAS.
- J. X. Hu, T. H. Huang, Y. P. Zhang, B. Lu, H. Q. Ye, B. J. Chen, H. P. Xia and C. Y. Ji, Enhanced deep-red emission from Mn4+/Mg2+ co-doped CaGdAlO4 phosphors for plant cultivation, Dalton Trans., 2019, 48, 2455–2466 RSC.
- J. T. Zhao, X. Y. Sun and Z. Q. Wang, Ce3+/Eu2+ doped SrSc2O4 phosphors: Synthesis, luminescence and energy transfer from Ce3+ to Eu2+, Chem. Phys. Lett., 2018, 691, 68–72 CrossRef CAS.
- Z. Y. Mao, J. J. Chen, J. Li and D. J. Wang, Dual-responsive Sr2SiO4:Eu2+-Ba3MgSi2O8:Eu2+,Mn2+ composite phosphor to human eyes and plant chlorophylls applications for general lighting and plant lighting, Chem. Eng. J., 2016, 284, 1003–1007 CrossRef CAS.
- S. Wang, Y. F. Li, L. G. Feng, L. Z. Zhang, Y. Zhang, X. L. Su, W. Ding and F. Yun, Laser patterning of Y3Al5O12:Ce3+ ceramic phosphor platelets for enhanced forward light extraction and angular color uniformity of white LEDs, Opt. Express, 2016, 24(15), 17522–17531 CrossRef CAS.
- Y. Zhang, X. J. Zhang, H. R. Zhang, L. L. Zheng, Y. Zeng, Y. Lin, Y. L. Liu and B. F. Lei, Tunable emission from green to red in the GdSr2AlO5:Tb3+,Eu3+phosphor via efficient energy transfer, RSC Adv., 2018, 8(7), 3530–3535 RSC.
- T. Senden, E. J. V. Harten and A. Meijerink, Synthesis and narrow red luminescence of Cs2HfF6:Mn4+ a new phosphor for warm white LEDs, J. Lumin., 2018, 194, 131–138 CrossRef CAS.
- H. P. You, Y. H. Song, G. Jia and G. Y. Hong, Energy transfer from Tb3+ to Mn2+ in LaMgAl11O19:Tb, Mn phosphors, Opt. Mater., 2008, 31(2), 342–345 CrossRef CAS.
- Z. M. Zhao, Z. G. Xia, X. X. Huang, L. X. Ning, G. Romain, M. S. Molokeev, Y. Y. Zhou, Y. C. Chuang, Q. Y. Zhang, Q. L. Liu and K. R. Poeppelmeier, Li substituent tuning of LED phosphors with enhanced efficiency, tunable photoluminescence, and improved thermal stability, Sci. Adv., 2019, 5, eaav0363 CrossRef.
- J. R. Sun, P. Huang, Y. F. Liu, L. Wang, C. E. Cui, Q. F. Shi and Y. Tian, Color-tunable Ca10Na(PO4)7:Ce3+/Tb3+/Mn2+, phosphor via energy transfer, J. Rare Earths, 2018, 36(6), 567–574 CrossRef CAS.
- W. Lü, H. W. Xu, M. M. Hao, H. C. Wang and X. J. Kang, Tunable full-color emitting Na2Ba6(Si2O7)(SiO4)2:Ce3+, Eu2+, Tb3+, Mn2+, phosphor for UV white LEDs: Photoluminescence and energy transfer, J. Alloys Compd., 2018, 752, 231–237 CrossRef.
- Y. Chen, Z. J. Wang, W. G. Ding, X. Li, Q. Bao, J. J. Liu, K. L. Qiu, X. Y. Meng, Z. P. Yang and P. L. Li, A single-phase white light emitting phosphor Ba3Y(PO4)3:Ce3+/Eu2+/Mn2+: Luminescence, energy transfer and thermal stability, J. Lumin., 2019, 210, 322–334 CrossRef CAS.
- C. H. Huang, T. W. Kuo and T. M. Chen, Thermally stable green Ba3Y(PO4)3:Ce3+,Tb3+ and red Ca3YAlO3(BO3)4:Eu3+ phosphors for white-light fluorescent lamps, Opt. Express, 2011, 19(S1), A1–A6 CrossRef CAS PubMed.
- N. Guo, C. Z. Jia, J. Li, Y. F. Zhao, R. Z. Oyang and W. Lü, Color Tuning and Energy Transfer in Eu2+/Mn2+-Doped Ba3Y(PO4)3 Eulytite-Type Orthophosphate Phosphors, RSC Adv., 2015, 5(58), 46517–46524 RSC.
- Y. B. Chen, K. W. Cheah and M. L. Gong, Low thermal quenching and high-efficiency Ce3+, Tb3+-co-doped Ca3Sc2Si3O12 green phosphor for white light-emitting diodes, J. Lumin., 2011, 131(8), 1589–1593 CrossRef CAS.
- C. Wang, P. L. Li, Z. J. Wang, Z. P. Yang, Z. L. Li, M. M. Tian, J. G. Cheng and Y. S. Sun, Crystal structure, luminescence properties, energy transfer and thermal properties of a novel color-tunable, white light-emitting phosphor Ca9-x-yCe(PO4)7:xEu2+,yMn2+, Phys. Chem. Chem. Phys., 2016, 18(41), 28661–28673 RSC.
- S. C. Xu, Z. J. Wang, P. L. Li, T. Li, Q. Y. Bai, J. Sun and Z. P. Yang, White-emitting phosphor Ba2B2O5:Ce3+, Tb3+, Sm3+: luminescence, energy transfer, and thermal stability, J. Am. Ceram. Soc., 2017, 100, 2069–2080 CrossRef CAS.
- X. Li, P. L. Li, Z. J. Wang, S. M. Liu, Q. Bao, X. Y. Meng and K. L. Qiu, Color-tunable luminescence properties of Bi3+ in Ca5(BO3)3F via changing site occupation and energy transfer, Chem. Mater., 2017, 29(20), 8792–8803 CrossRef CAS.
- X. G. Zhang, J. G. Xu and M. L. Gong, Site-occupancy, luminescent properties and energy transfer of a violet-to-red color-tunable phosphor Ca10Li(PO4)7:Ce3+, Mn2+, J. Lumin., 2017, 183, 348–354 CrossRef CAS.
- Y. Zhang, X. J. Zhang, H. R. Zhang, L. L. Zheng, Y. Zeng, Y. Lin, Y. L. Liu and B. F. Lei, Tunable emission from green to red in the GdSr2AlO5:Tb3+, Eu3+ phosphor via efficient energy transfer, RSC Adv., 2018, 8, 3530–3535 RSC.
- G. G. Li, Y. Tian, Y. Zhao and J. Lin, Recent progress in luminescence tuning of Ce3+ and Eu2+-activated phosphors for pc-WLEDs, Chem. Soc. Rev., 2016, 47(1), 8688–8713 Search PubMed.
- F. Xiao, R. X. Yi, H. L. Yuan, G. J. Zang and C. N. Xie, Color tunable emission and energy transfer of Ce3+/Dy3+ codoped Ba3La2(BO3)4 phosphor for UV white LEDs, Spectrochim. Acta, Part A, 2018, 202, 352–358 CrossRef CAS PubMed.
- H. J. Guo, Y. T. Wang, G. Li, J. Liu, P. Feng and D. W. Liu, Cyan emissive super-persistent luminescence and thermoluminescence in BaZrSi3O9:Eu2+, Pr3+ phosphors, J. Mater. Chem. C, 2017, 5(11), 2844–2851 RSC.
- Z. L. Li, Z. J. Wang, P. L. Li, J. G. Cheng, M. M. Tian, C. Wang and Z. P. Yang, Improvement of thermally stable and photoluminescence in Sr0.8Ca0.2Al2Si2O8:Eu2+ by the substitution of Si-Na # Al-Sr and Ca # Sr on structural modifications, Dalton Trans., 2017, 41, 14310–14317 RSC.
- Q. Y. Bai, Z. J. Wang, P. L. Li, S. C. Xu, T. Li, J. G. Cheng and Z. P. Yang, Utilizing Tb3+ as the energy transfer bridge to connect Eu3+-Zn2GeO4 host: Realization of efficient Eu3+ red emission, Mater. Des., 2016, 108, 597–607 CrossRef CAS.
| This journal is © The Royal Society of Chemistry 2019 |

