DOI:
10.1039/C9RA05993H
(Paper)
RSC Adv., 2019,
9, 32476-32489
Thermogravimetric and infrared spectroscopic studies of the spontaneous combustion characteristics of different pre-oxidized lignites
Received
2nd August 2019
, Accepted 14th September 2019
First published on 11th October 2019
Abstract
It is extremely important to prevent spontaneous combustion of coal in mines by studying the secondary oxidation of lignite at different pre-oxidation temperatures. The characteristic parameters of the spontaneous combustion of lignite were analyzed by simultaneous thermal analysis-Fourier transform infrared spectroscopy and in situ infrared spectroscopy experiments from the perspective of coal oxidizing, exothermicity and structural functional groups. The results show that the critical temperature and total heat absorption of pre-oxidized coal are lower than those of raw coal. For the coal a with pre-oxidation temperature of 120 °C, the critical temperature and total heat of the endothermic reaction were the lowest, which resulted in increased CO release and CO2 gas production. In the low temperature stage, the pre-oxidation step weakens some functional groups in coal; however, the participation amount of –CH3 structures increases. Kinetic analysis was performed on –OH and –CH3 groups during the secondary oxidation of coal. After pre-oxidation, the activation energy of coal was lower than that of raw coal; it was the lowest when the pre-oxidation temperature was 120 °C. In summary, the risk of spontaneous combustion of pre-oxidized coal increases during secondary oxidation, and the risk is greatest when the pre-oxidation temperature climbs to 120 °C.
1 Introduction
Coal resources occupy a basic position in the national economy of many countries and are a non-renewable energy source. In order to save resources and improve the recovery rate of coal, much coal in the goaf is repeatedly mined, and extra-thick coal seams are subjected to slice mining methods.1–3 When coal is repeatedly mined in the goaf, the residual coal and the goaf have larger pores, and wind flow penetrates into these gaps to form leak paths. The surface of the oxidized coal is oxidized again. When the heat generated by the oxidation of the coal is greater than the amount of heat dissipated, the coal will spontaneously ignite upon heat storage. The use of slicing mining technology in thick coal seams or extra-thick coal seams is another way to save resources. During the mining process, the first layer is oxidized when the coal seam is exposed to air during mining, which may cause changes in the spontaneous combustion characteristics of the coal. When the second layer is mined, fresh air reoxidizes the coal. In addition, there are many cases of spontaneous combustion involving re-oxidation of coal, such as reignition of old goaf and the reignition phenomenon when opening a sealed fire zone.4–6 After the coal sample is oxidized and heated to a certain temperature, the temperature of the coal sample returns to the normal temperature, and then the temperature is increased by oxidation. Some scholars call this secondary oxidation.7,8 Coal spontaneous combustion is a global disaster; it not only causes enormous waste of energy, represents a serious threat to the natural environment and produces harmful gases, but it also brings great harm to human health and can even result in casualties.9–13 Therefore, it is of great significance to study the re-ignition characteristics of coal with different degrees of oxidation; this can scientifically and effectively prevent the occurrence of secondary oxidation of coal.
Lignite is the coal with the lowest degree of coalification; it has unique physical and chemical properties, and its reserves account for about 45% of global coal.14 The lignite structure is mainly composed of a three-dimensional polymer network, various small molecular organic materials and inorganic materials.15 In addition, it has high volatile matter content, a low ignition temperature, and developed voids, and it easily reacts with oxygen.16,17 Therefore, the risk of spontaneous combustion of lignite is prominent. Many scholars use the crossing point temperature (CPT) method to determine the spontaneous combustion tendency of lignite.18–20 The crossing point temperature is an important temperature parameter for the spontaneous combustion process of coal. It defines the temperature at which the sample exceeds the furnace temperature and the coal begins to self-heat. The current thermal analysis technology measures the relationship between the physical properties and temperature of a substance under programmed temperature control; it has the advantages of smaller sample size, high precision, and good repeatability. It has been widely used to study coal spontaneous combustion tendency, coal oxidation heat release and coal thermal properties.21,22 The most commonly used thermal analysis methods at present are thermogravimetry, differential thermal analysis and differential scanning calorimetry. Iordanidis et al. analyzed the thermal effects of seven lignite samples from the Amynteon lignite deposit in northern Greece.23 Zhang et al. found the coal auto-ignition temperature (CAIT) through DSC curves and verified the existence of the CAIT point through TG/DSC analysis and mathematical model construction.24 Fourier transform infrared spectroscopy technology is applied to analyze functional groups. Yuan et al. analyzed the decomposition of oxygen-containing functional groups and the shortening of long alkyl side chains under microwave irradiation by infrared spectroscopy.25 Zhang et al. analyzed the changes of methyl and methylene groups in the low temperature oxidation process of lignite by FTIR, and they divided the oxidation process into three stages.26 Y. Kadioğlu et al. studied the relationship between the content of oxygen functional groups in two untreated, moistened and air-dried Turkish lignites and the spontaneous combustion characteristics of coal.27 A series of molecular dynamics (MD) simulations were performed on monomolecular model compounds using the ReaxFF reaction field to study the initiation of spontaneous reactions using a monomolecular model of lignite. Based on the simulation results, the hydroxyl groups in lignite were removed to inhibit spontaneous combustion of coal.28 The kinetic characteristic parameters of the coal oxidation process mainly include the reaction rate, activation energy, enthalpy change, pre-exponential factor and reaction mechanism function; these have been focused on by many scholars. The study of dynamic processes can increase our understanding of the phenomenon of coal spontaneous combustion, control the characteristics of coal spontaneous combustion, and develop new prevention and control technology.29 The activation energies have been obtained by methods such as Coats–Redfern (model fitting), Friedman (FR), Flynn–Wall–Ozawa (FWO), and Kissinger–Akahira–Sunose (KAS).30–32
In summary, the current research on lignite spontaneous combustion mainly focuses on the evolution process of coal oxidative spontaneous combustion and the changes in various indices in the coal oxidation process; however, little research on secondary oxidation of coal is included. In this paper, the spontaneous combustion characteristics of different pre-oxidized lignite samples were studied by thermogravimetric infrared and in situ infrared spectroscopy experiments. Based on the evolution of the functional groups, the kinetic parameters were determined using a model-free method. This study provides a theoretical basis for the prediction of spontaneous combustion of secondary oxidation of coal under the conditions of repeated mining, slicing mining, opening a sealed fire zone, etc.
2 Experimental and methods
2.1 Coal samples
Fresh lignite was collected from the primary working face of the Great Nanhu Mine in China. The coal samples were then packed in multilayer plastic and nylon bags and transported to the laboratory. The central portion of the lump coal was taken out and pulverized into a sample with a particle size of less than 0.1 mm. The screened coal samples were divided into 5 groups and numbered L1, L2, L3, L4 and L5. The L1 coal sample was the raw coal sample. The remaining coal samples were respectively placed in porcelain open enamel and placed in a temperature-programmed box, where they were heated to temperatures of 80 °C, 120 °C, 160 °C or 200 °C for 60 min to ensure sufficient oxidation of the coal samples. The intake air was switched to nitrogen, and the coal samples were sealed after the coal temperature was lowered to normal temperature; these samples were numbered L2, L3, L4 and L5, respectively.
2.2 Proximate analysis
Industrial analysis of both the pre-oxidized and raw samples was performed using a 5E-MAG6700 industrial analyzer (Kaiyuan Instrument Co., Ltd., PR China). For each test, 3 g of each coal sample was used. The gas supplied was air atmosphere. Each type of coal was analyzed 3 times to ensure test reproducibility, and the experimental error was less than 4%. The experimental results are shown in Table 1.
Table 1 Proximate analysis of the coal samplesa (wt%)
| Coal sample |
M
ad
|
A
ad
|
V
ad
|
FCad |
|
M
ad, Aad, Vad and FCad correspond to moisture, ash, volatile, and fixed carbon, respectively, on an air-dried basis.
|
| L1 |
12.15 |
43.45 |
25.1 |
19.3 |
| L2 |
1.43 |
35.82 |
28.62 |
34.13 |
| L3 |
1.64 |
31.96 |
30.79 |
35.61 |
| L4 |
1.40 |
30.11 |
25.18 |
43.31 |
| L5 |
1.19 |
32.67 |
27.73 |
38.41 |
Proximate analysis is an experimental method to certify the moisture, ash, and volatile content of coal. It can be seen in Table 1 that the pre-oxidized coals contained less ash than raw coal. The residue is coal ash, whose primary components include silica (SiO2), alumina (Al2O3) and iron oxides (Fe2O3), with generally lower contents of calcium (CaO), magnesium (MgO), potassium (K2O) and sodium (Na2O).33 The molecular structure of coal may combine with oxygen to form the oxidized coal structure, resulting in a decrease in the proportion of pre-oxidized coal components under the same mass conditions. Moreover, the moisture content of the lignite raw coal sample was high, and the moisture contents of the pre-oxidized coal samples decreased. The coal sample with a pre-oxidation temperature of 120 °C had the highest volatile content.
2.3 Simultaneous thermal-Fourier transform infrared spectroscopic analyses
Simultaneous thermal analysis-Fourier transform infrared spectroscopy (STA-FTIR) was used for the experiments. The experimental instrumentation consisted of a STA 449 F3 series simultaneous TG/DSC thermal analyzer manufactured by Netzsch Incorporated and a VERTEX70v series Fourier-transform infrared spectrometer (FTIR) manufactured by Bruker Incorporated. The DSC curves were obtained by detecting the heat changes in real time, and the TG curves were obtained by measuring the weight changes of each sample during the heating process. The STA was connected to the FTIR with an insulated pipe. The thermally insulated pipe and FTIR gas cavity were maintained at a constant temperature of 220 °C to prevent gas condensation as much as possible. The gas component content can be determined by FTIR spectroscopy. For these experiments, 10 mg of each coal sample was used for testing. The initial temperature for the heating experiments was 30 °C, the final temperature was 700 °C, and the samples were heated at a rate of 3 °C, 5 °C, 8 °C, or 12 °C min−1. The total flow rate of the protection and carrier gases was kept constant at 50 ml min−1, and the oxygen concentration in the gas was 21%. Prior to each measurement, the STA-FTIR instrument was calibrated. Each type of coal was tested 3 times to ensure the test reproducibility, and the experimental error was less than 4%.
2.4
In situ FTIR spectroscopy
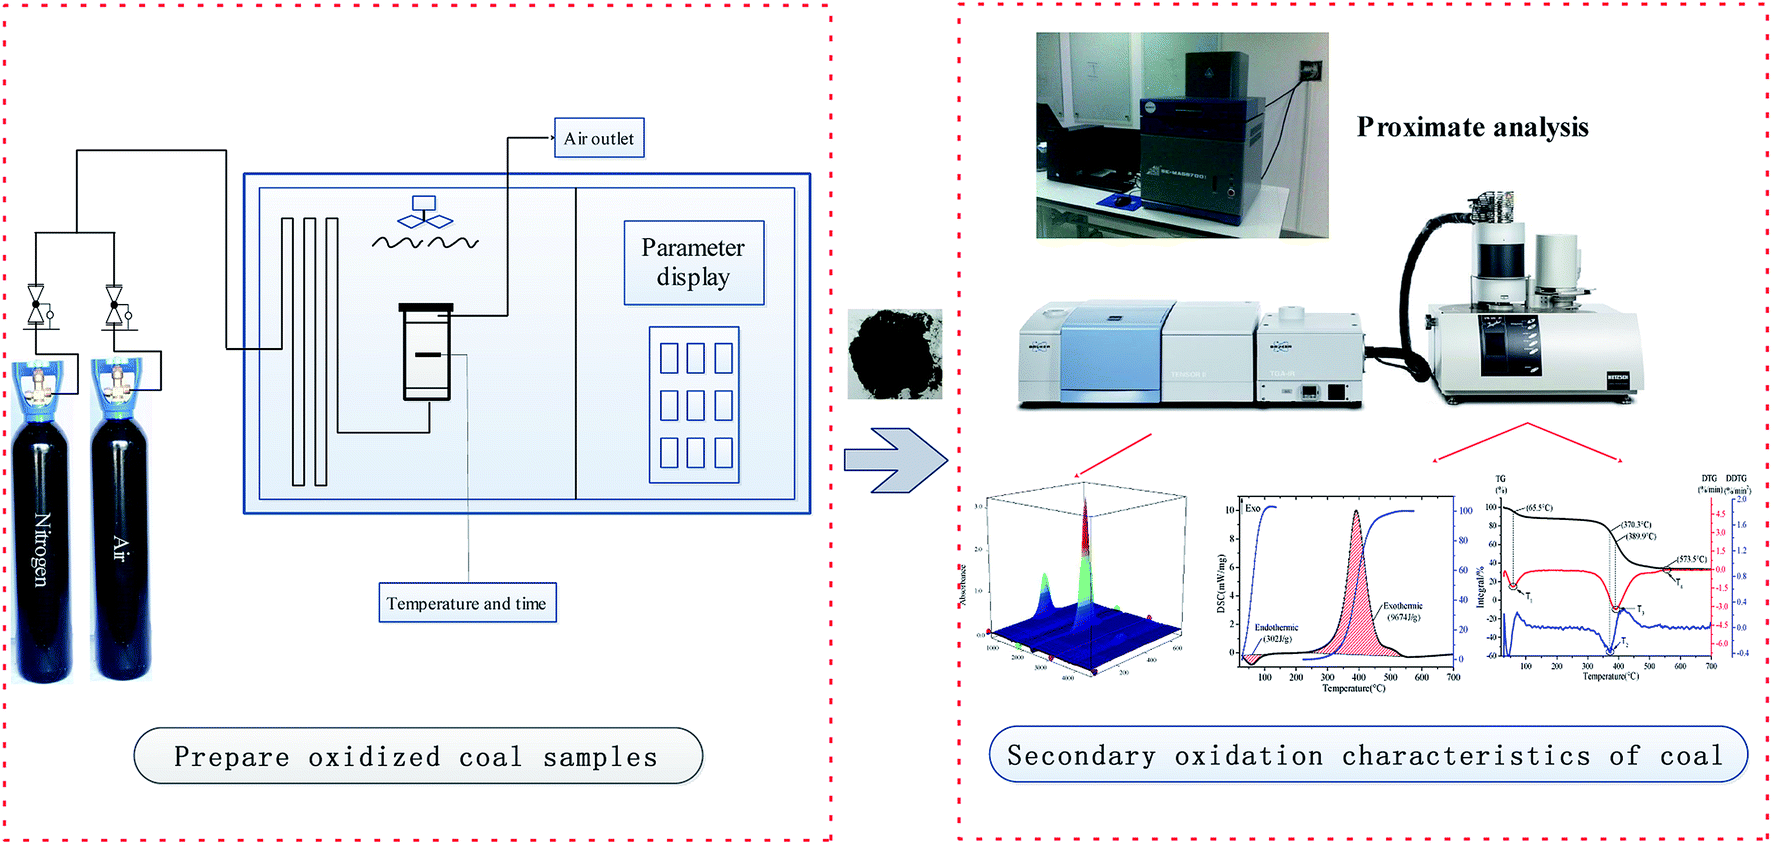
The microstructure changes of lignite raw coal and coal with different oxidation degrees during coal spontaneous combustion were analyzed in real time by a Brooke VERTEX 70v in situ infrared instrument, and the change histories of the main functional groups were observed. Dry potassium bromide powder was used as the background vector in the experiment. Then, the crucible was evenly filled with 10 mg of prepared coal sample, and the window plate on the back cover was pressed and sealed and placed in the diffuse reflection sample pool for testing. The wave number measurement range was set to from 600 to 4000 cm−1, the resolution was 4.0 cm−1, the number of accumulative scans was 32, the experimental temperature range was from 30 °C to 700 °C, the heating rate was set to 5 °C min−1, the air flow through the sample reaction tank was 50 ml min−1, and the test analysis for the coal samples was performed under oxygen conditions of 21%. Prior to the each measurement, the in situ FTIR instrument was calibrated. The experimental setup is shown in Fig. 1.
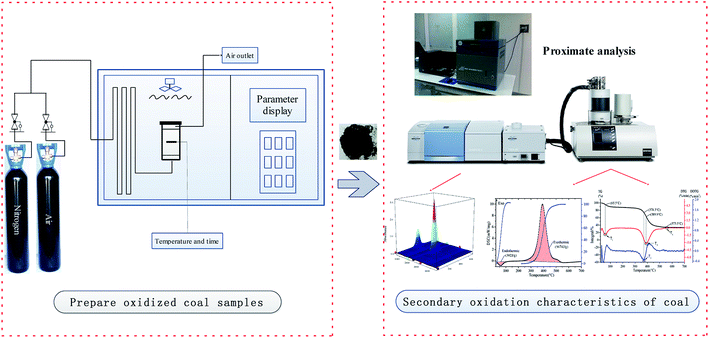 |
| | Fig. 1 The experimental setup. | |
3 Results and discussion
3.1 TG/DTG results
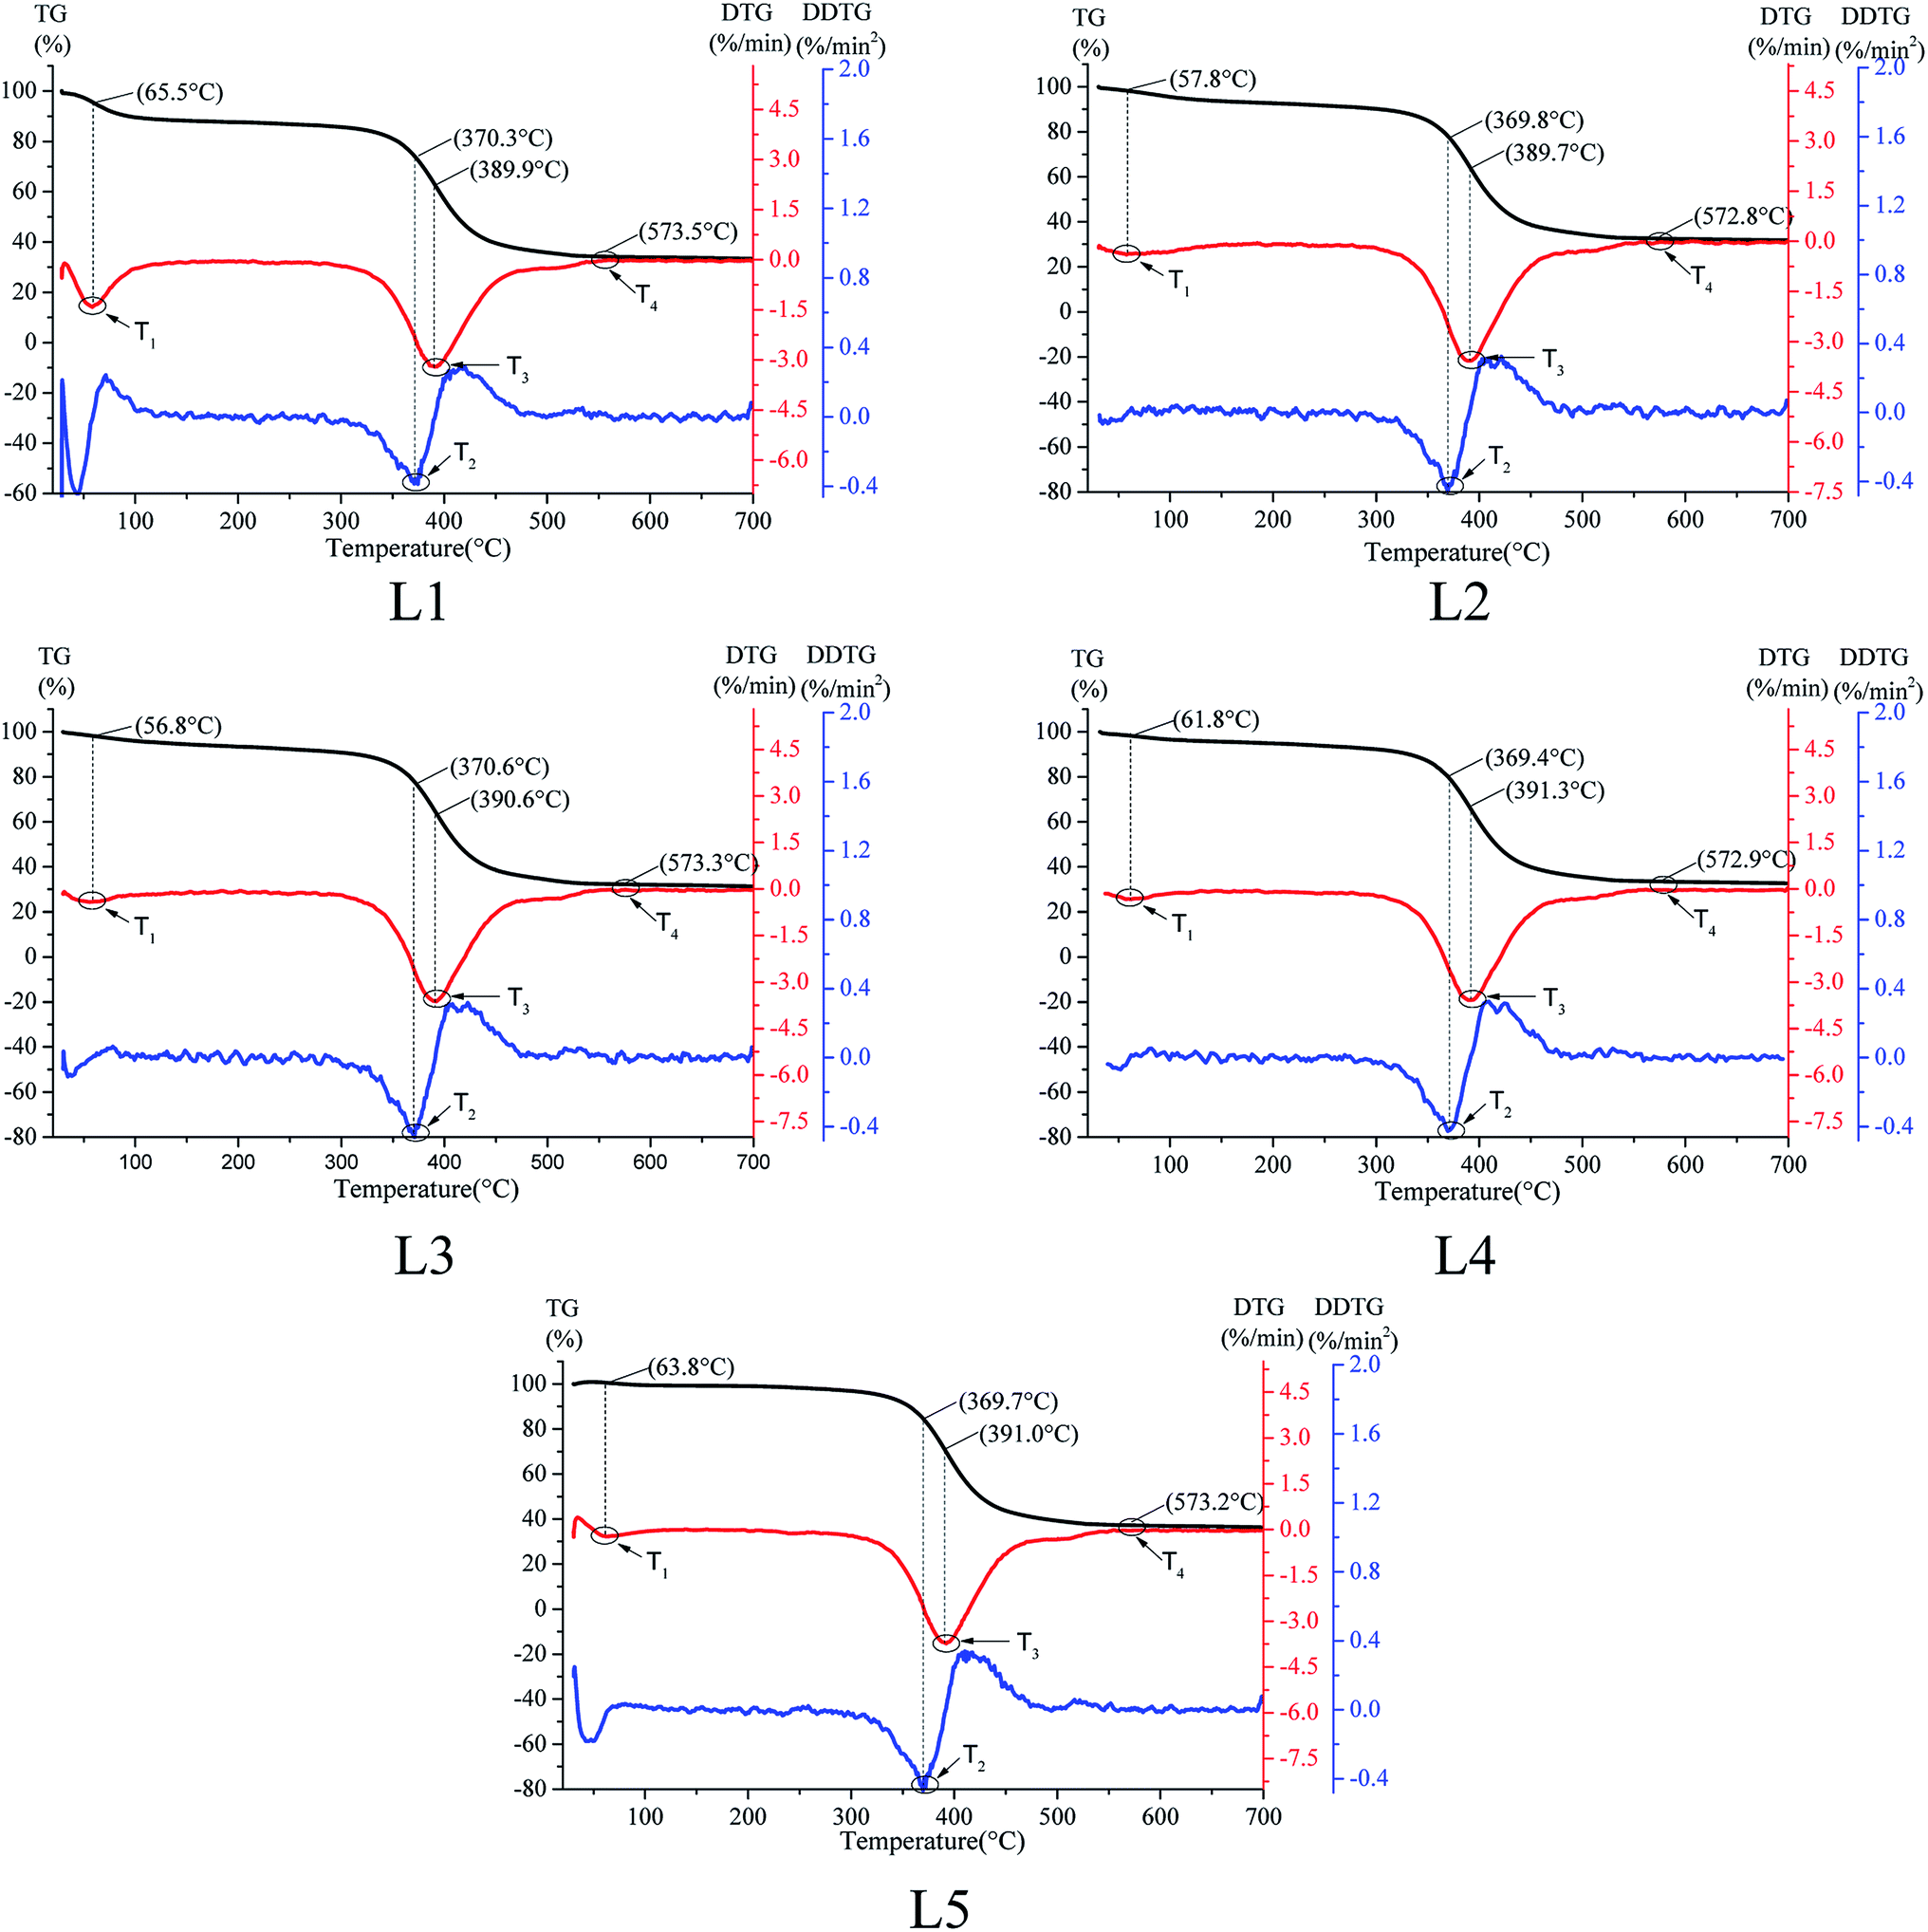
The TG/DTG curves of the coal samples numbered L1, L2, L3, L4 and L5 are shown in Fig. 2.
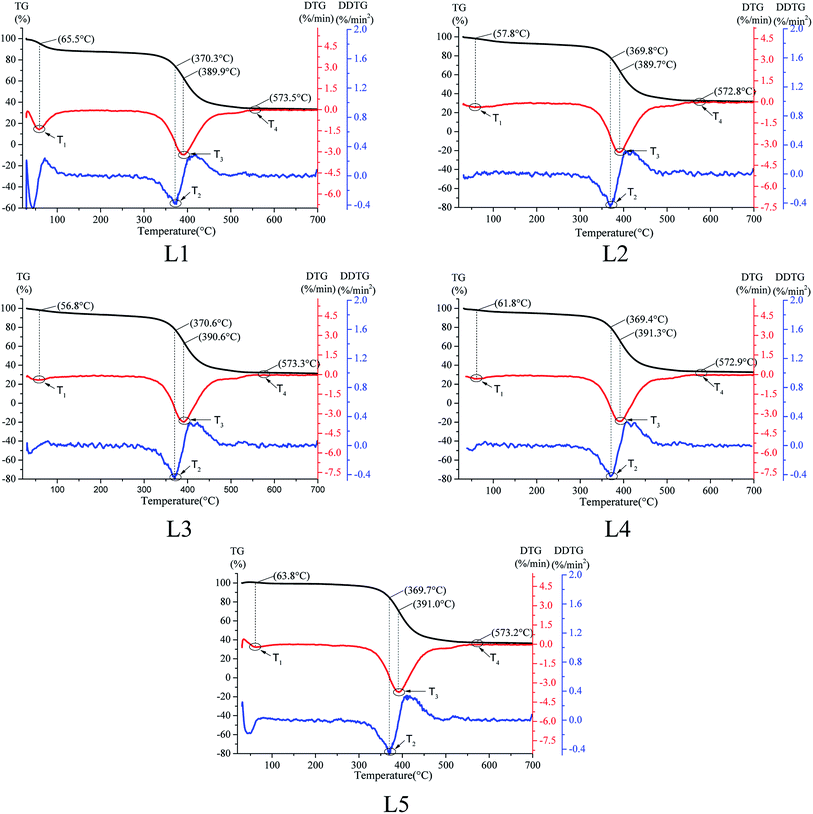 |
| | Fig. 2 Thermogravimetric (TG), differential thermogravimetric (DTG), and second derivative thermogravimetric (DDTG) curves of the coal samples numbered L1, L2, L3, L4 and L5. | |
On the basis of previous studies,34,35 the critical temperature T1 is the first maximum peak point of the weight loss rate during the coal reaction process. At this temperature, the reaction rate between oxygen and the active groups existing in coal will accelerate obviously, which results in increases of the oxygen consumption rate, water evaporation and released gas production amount. In addition, increasing amounts of the initial absorbed gas in the coal pore structure begin to desorb at this temperature. As a result, the DTG curve reaches the first maximum peak point value. The ignition temperature T2 is the temperature at which the coal sample begins to burn violently; it is also the temperature at which the mass loss rate is the maximum. The maximum weight loss rate temperature T3 is the temperature corresponding to the maximum valley bottom of the DTG curve. At this time, the internal combustion reaction of coal is fierce, producing large amounts of CO, CO2, H2O and small molecule gas products and releasing a large amount of heat at the same time. The quality of the coal sample decreases rapidly. The burnout temperature T4 is the temperature point at which the coal sample is completely burned and the mass no longer changes with increasing temperature. The statistical characteristic temperature points are shown in Table 2.
Table 2 Characteristic temperatures for spontaneous combustion of the different pre-oxidized lignite samples
| Coal sample |
Critical temperature T1 (°C) |
Ignition temperature T2 (°C) |
Maximum weight loss rate temperature T3 (°C) |
Burnout temperature T4 (°C) |
| L1 |
65.5 |
370.3 |
389.9 |
573.5 |
| L2 |
57.8 |
369.8 |
389.7 |
572.8 |
| L3 |
56.8 |
370.6 |
390.6 |
574.3 |
| L4 |
61.8 |
369.4 |
391.3 |
571.0 |
| L5 |
63.8 |
369.7 |
391.0 |
570.2 |
Lignite is highly volatile. During the oxidation heating process of raw coal and the pre-oxidized coal samples, the TG curves did not show the stages of oxygen absorption and weight gain and were always in the state of quality decrease before burnout. Table 2 shows that the T2, T3 and T4 values of the coal samples with different temperatures of pre-oxidation had no obvious changes, which are mainly reflected in T1. The critical temperature range is 56.8 °C to 65.5 °C. With increasing temperature of pre-oxidation, the critical temperature tended to first decrease, then increase, and it reached a minimum when the treatment temperature was 120 °C. Moreover, the critical temperatures of the pre-oxidized coal samples were lower than that of the raw coal sample. The results show that the risk of spontaneous combustion of pre-oxidized coal enhances during secondary oxidation, and the risk is greatest when the temperature climbs to 120 °C.
3.2 DSC results
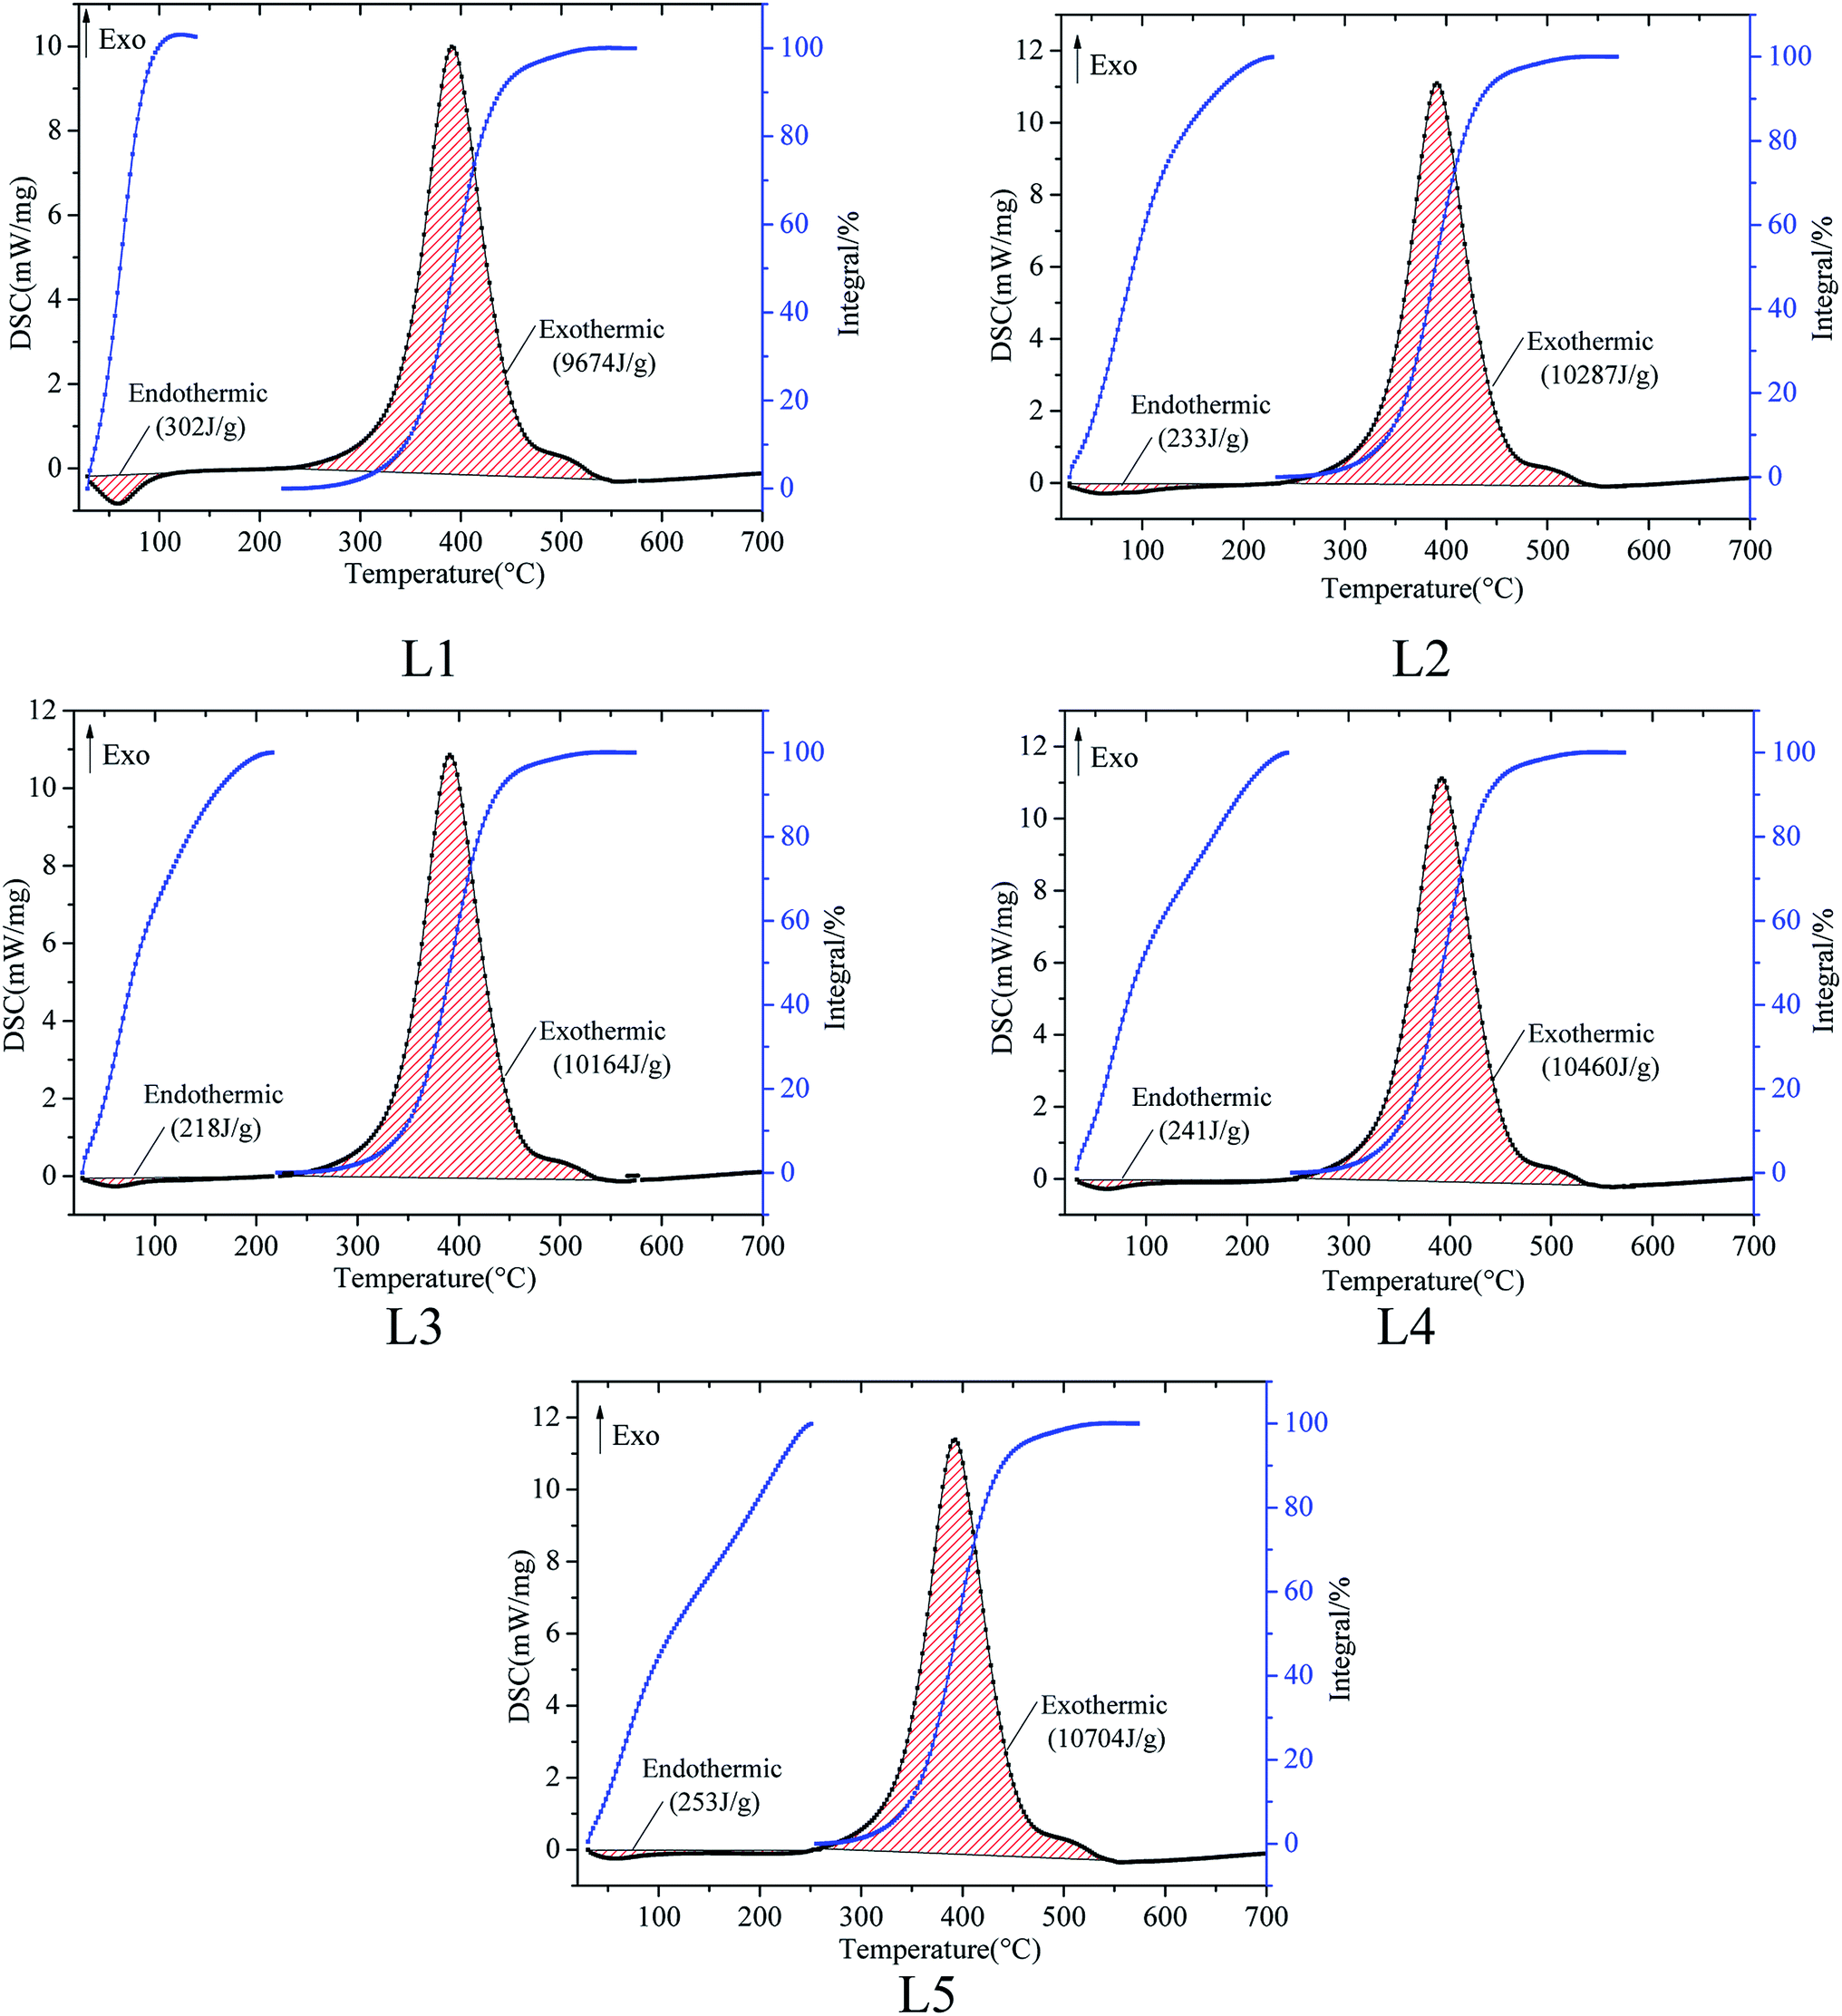
The process of spontaneous combustion of coal includes different thermal reactions, and the macroscopic manifestations are endothermic and exothermic. In order to study the thermal effects of coal spontaneous combustion with different pre-oxidized lignite samples, the DSC curves of coal oxidation were obtained using a STA 449 F3 series simultaneous TG/DSC thermal analyzer, as shown in Fig. 3. The total amounts of endothermic and exothermic heat were obtained by selecting the linear baseline.
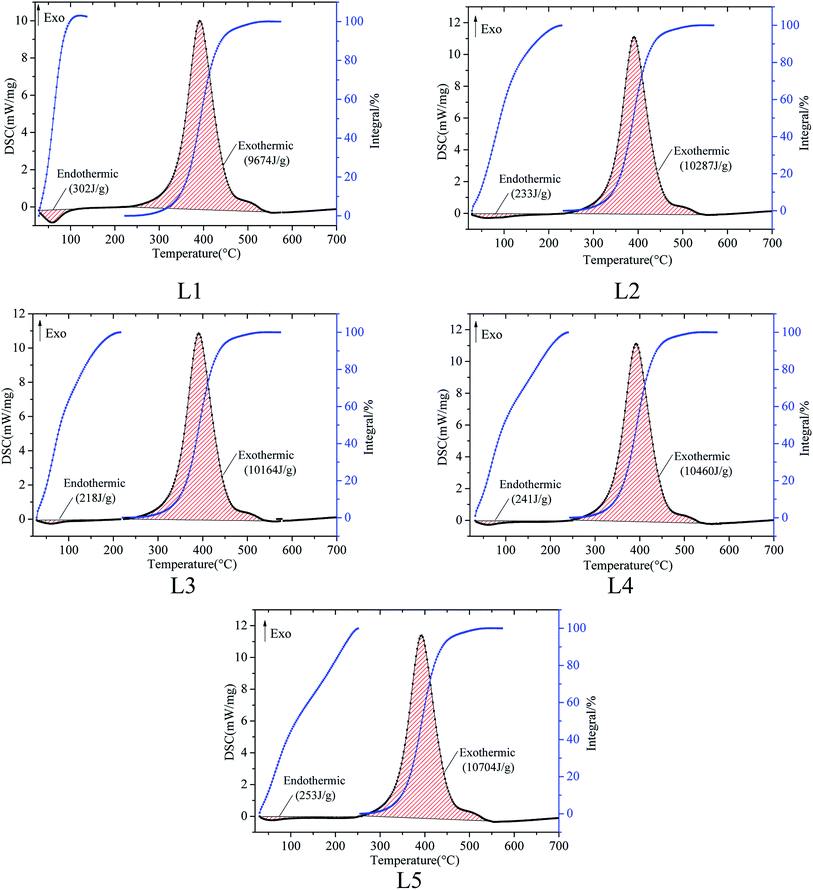 |
| | Fig. 3 Differential scanning calorimeter (DSC) curves of the coal samples numbered L1, L2, L3, L4 and L5. | |
There is an endothermic stage in the early stage of oxidation. This is due to the fact that water evaporation in coal absorbs more heat than the exothermic reaction between coal and oxygen. As the reaction intensity of coal oxygen increases gradually, the endothermic reaction of the coal sample decreases and then reaches the exothermic reaction. One area represents the total heat absorption of the coal sample before the initial exothermic temperature, while the other area represents the total heat release, as shown in Fig. 3. The specific characteristic parameters obtained from the DSC results are listed in Table 3.
Table 3 Characteristic parameters of the DSC curves for the different coal samples
| Coal sample |
Total heat of endothermic reaction (J g−1) |
Total heat of exothermic reaction (J g−1) |
| L1 |
302 |
9671 |
| L2 |
233 |
10![[thin space (1/6-em)]](https://www.rsc.org/images/entities/char_2009.gif) 287 287 |
| L3 |
218 |
10164 |
| L4 |
241 |
10460 |
| L5 |
253 |
10704 |
Table 3 displays that the total heat absorption of the coal samples with different pre-oxidation temperatures ranges from 218 J g−1 to 302 J g−1, and the total heat of exothermic reaction ranges from 9671 J g−1 to 10704 J g−1. The heats of endothermic reaction of the different pre-oxidation coals are not high. 10 mg of each coal sample was tested under the condition of 21% oxygen; therefore, the weight and endothermic decreases of the coal were small. When the heat of the endothermic reaction is small at the initial stage of the coal spontaneous combustion, the exothermic reaction occurs more easily. After pre-oxidation, the total heat of endothermic reaction of the coal was less than that of raw coal. The coal sample with the pre-oxidized temperature of 120 °C has the lowest heat absorption at the initial stage of coal spontaneous combustion. Coal has poor thermal conductivity; therefore, heat is easily accumulated. Compared with raw coal, the heat of endothermic reaction of pre-oxidized coal decreases and the exothermic reaction occurs readily, which increases the risk of spontaneous combustion of coal. Moreover, the spontaneous combustion risk of the coal sample with a pre-oxidation temperature of 120 °C is the most prominent.
3.3 FTIR results
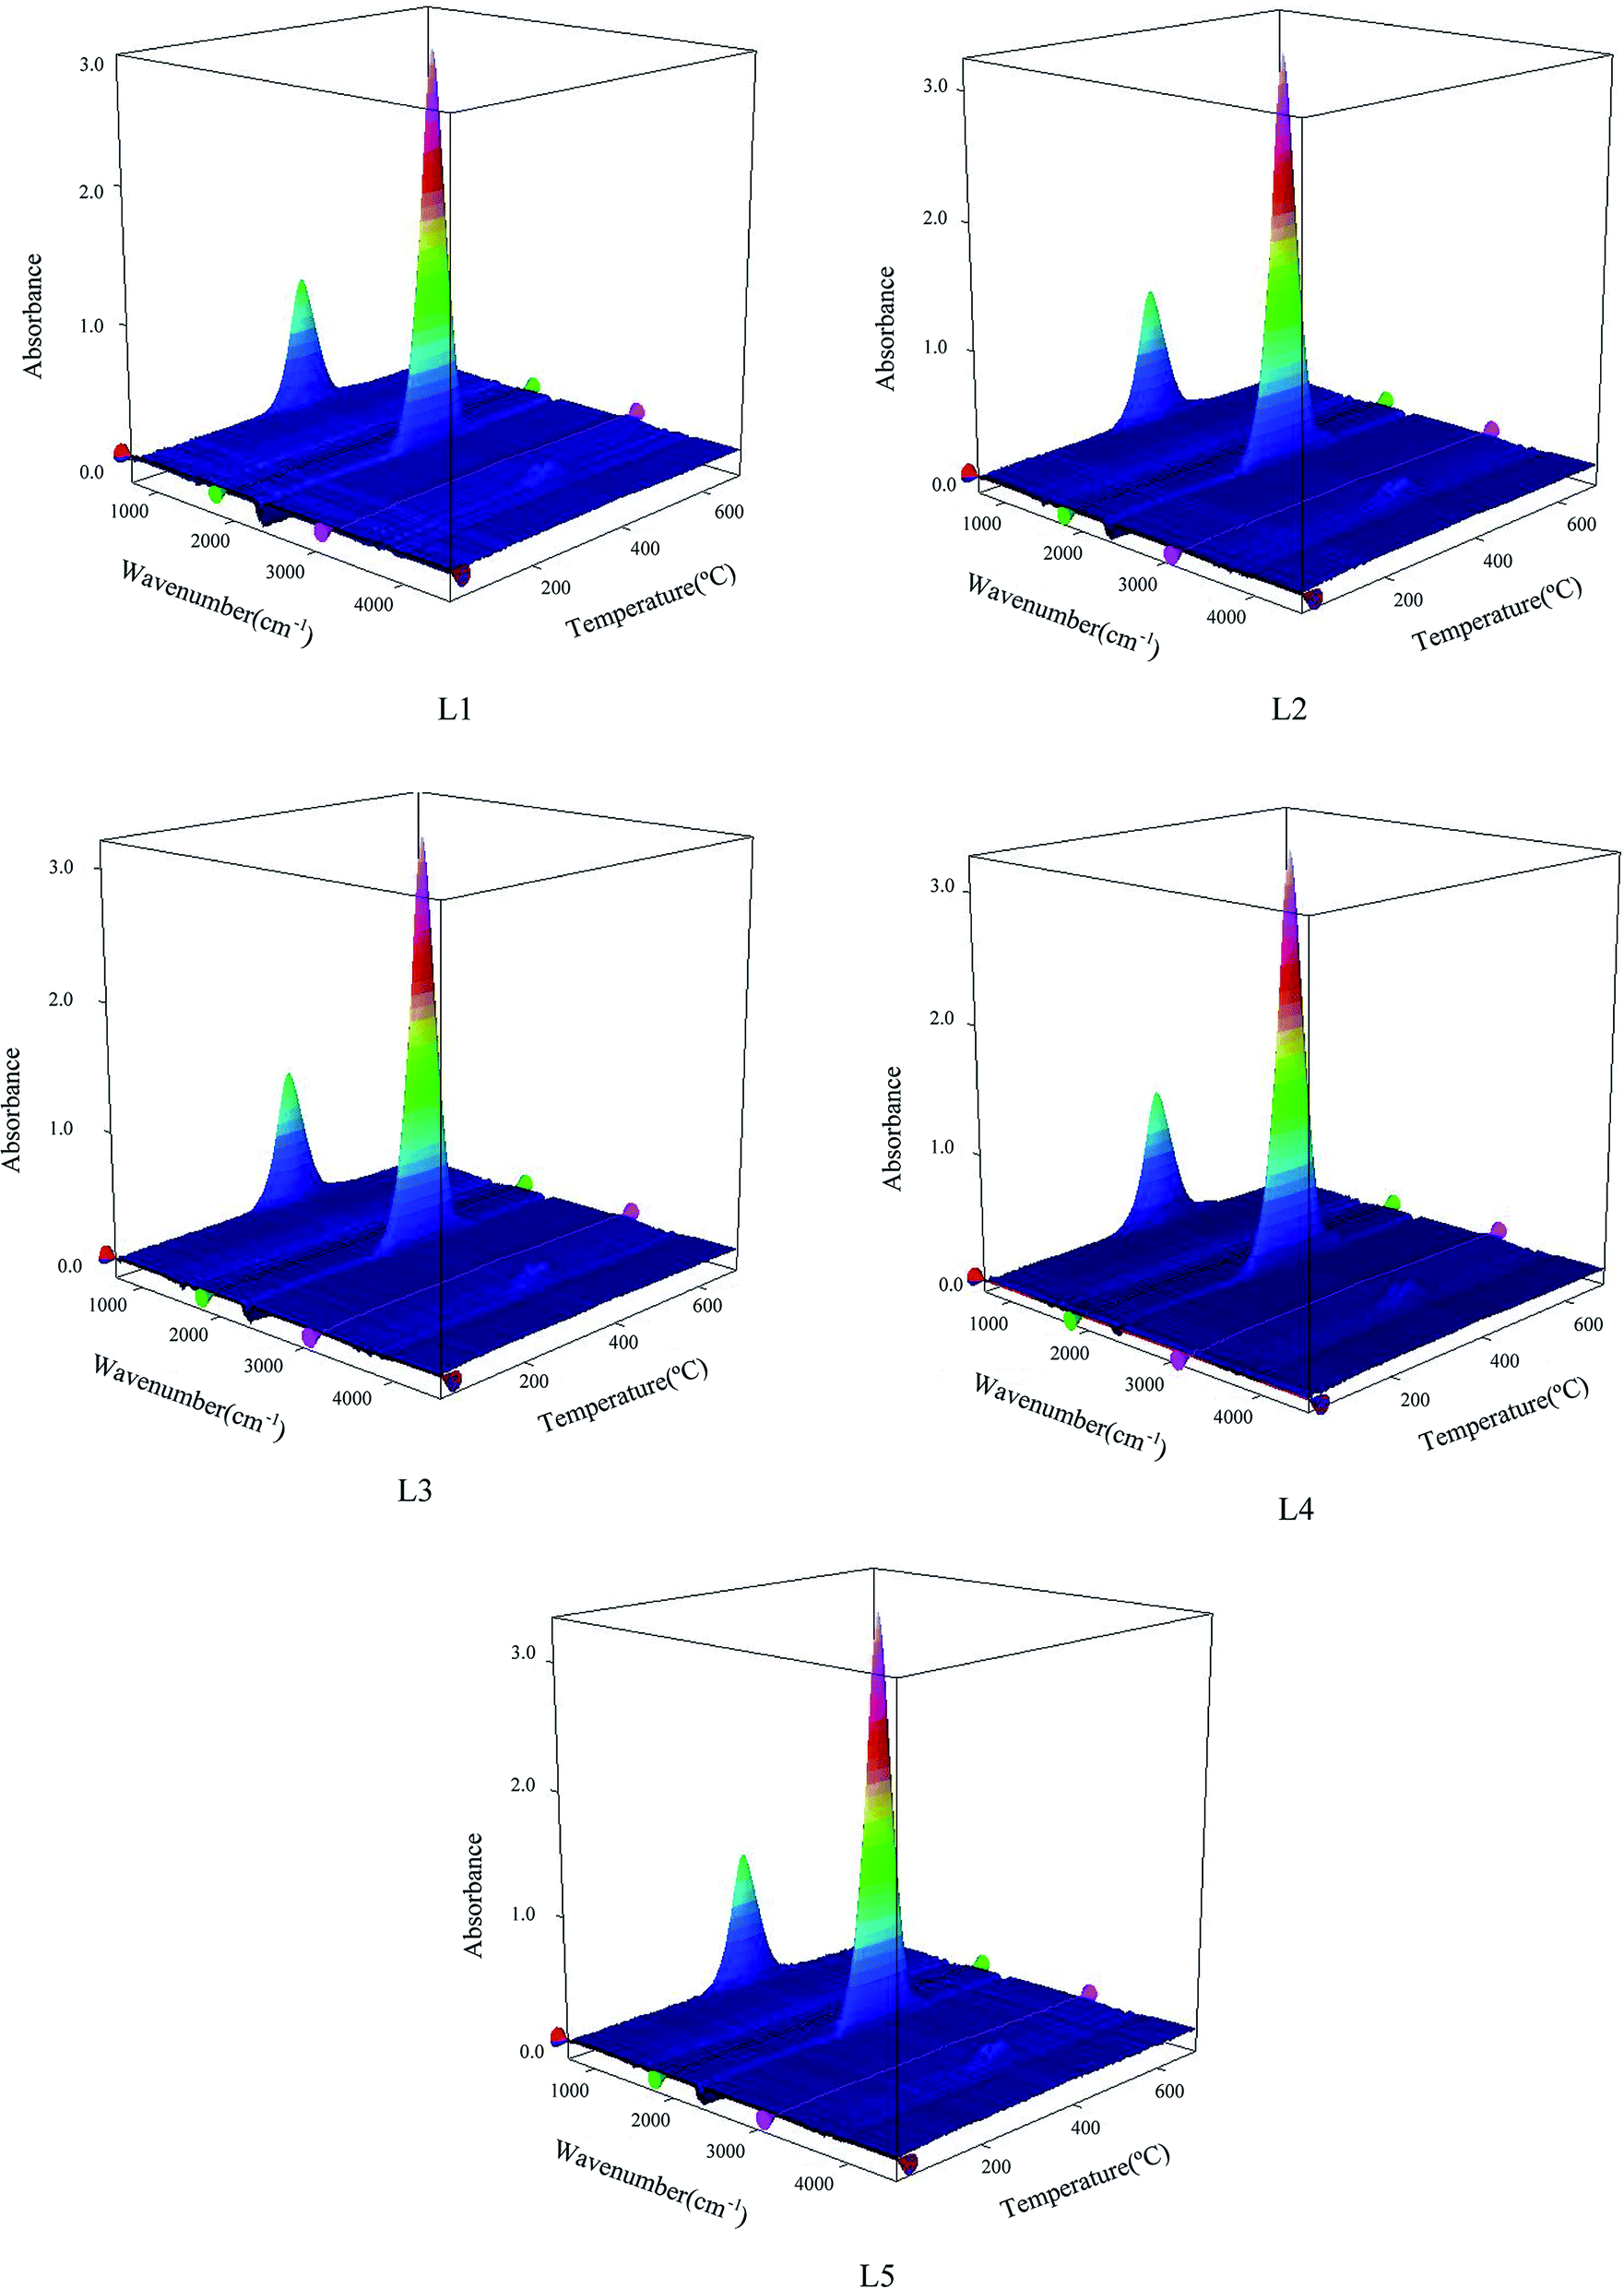
The greater the amount of gas produced by coal spontaneous combustion, the stronger the signal detected in the FTIR detector. Fig. 4 shows a 3D diagram (temperature–wavenumber–absorbance) of the FTIR results for both pre-oxidized and raw coal.
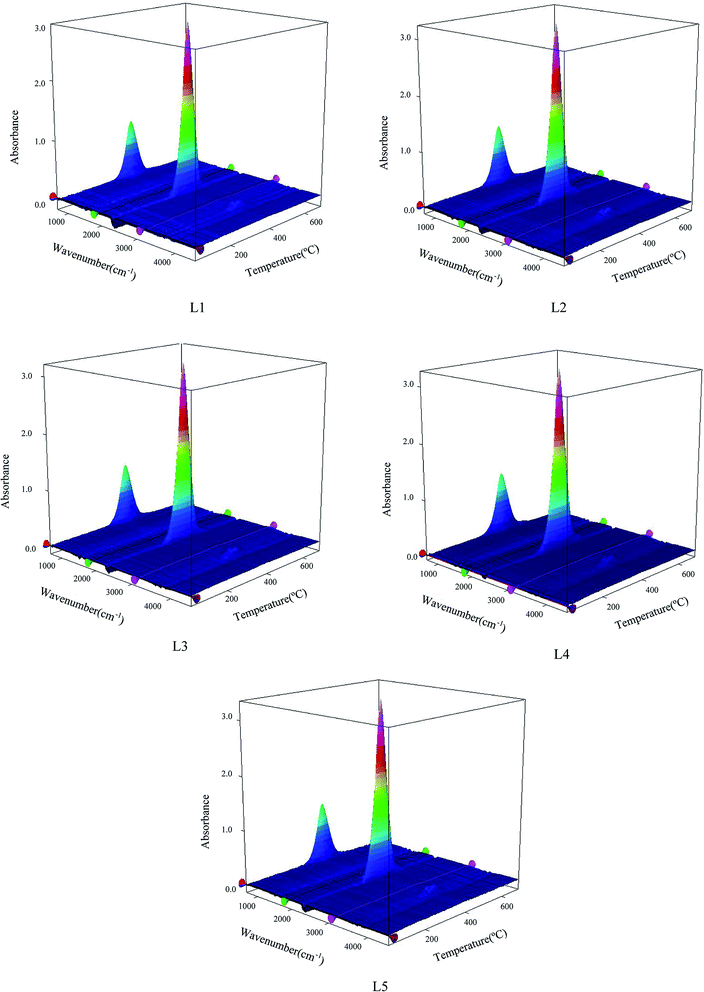 |
| | Fig. 4 3D diagram of the gas generated from the coal samples numbered L1, L2, L3, L4 and L5. | |
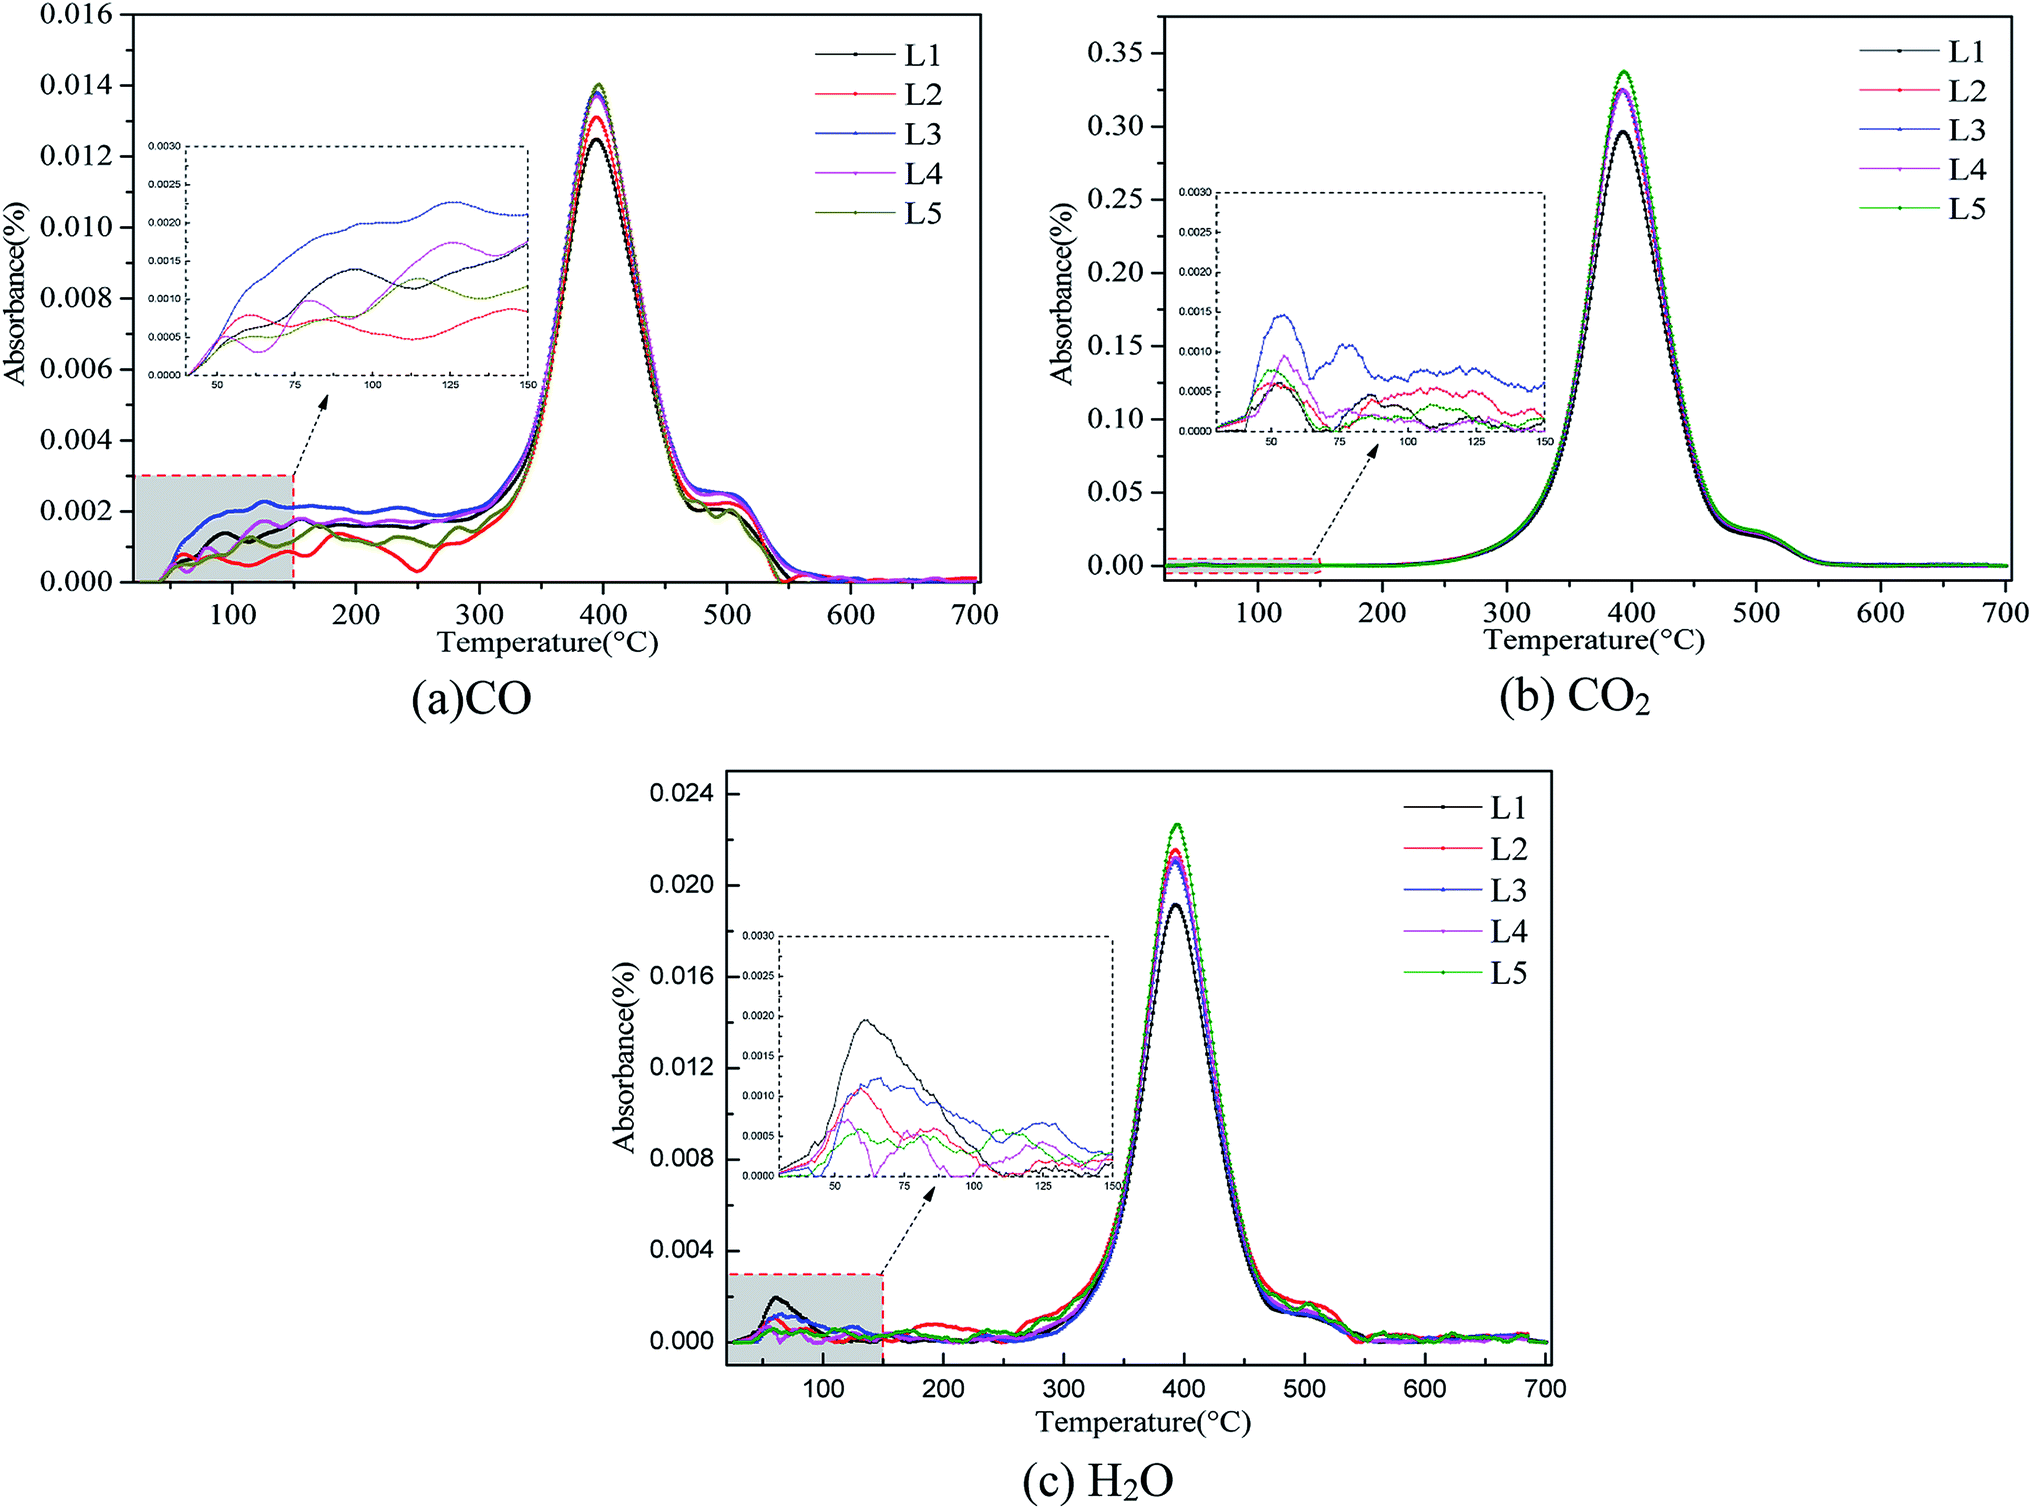
The peaks were analyzed by analyzing the Fourier infrared spectra. 2650 to 2200 cm−1 is attributed to CO2 gas. The free OH absorption peak at 3700 to 3625 cm−1 indicates H2O gas. 2200 to 1900 cm−1 is attributed to CO gas.36 In this paper, the spectra of CO, CO2 and H2O gases with increasing temperature were studied at 2173 cm−1, 2356 cm−1 and 3735 cm−1, respectively. Fig. 5 shows the absorbance versus temperature for three index gases: CO, CO2 and H2O.
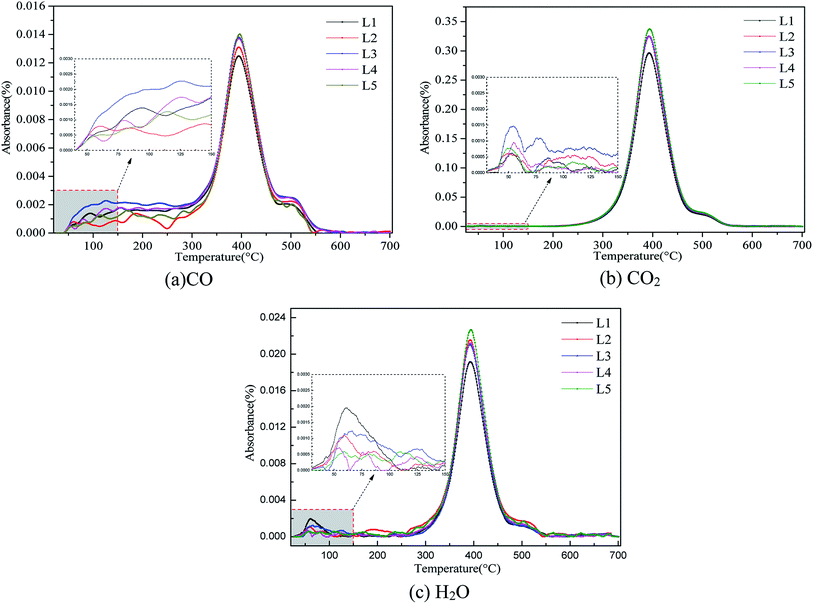 |
| | Fig. 5 Absorbance versus temperature diagrams for (a) CO, (b) CO2 and (c) H2O release from the pre-oxidized and raw coal samples. | |
There is a clear relationship between gas release and spontaneous combustion of coal.37 As shown in Fig. 5, CO, CO2 and H2O gases have the same change tendencies during the oxidative heating process of different pre-oxidation coal samples. In the low-temperature oxidation stage, the active structure of the coal molecules is activated to participate in the reaction, and the amounts of CO, CO2 and H2O gas produced begin to increase. As the temperature increases, the coal oxidation reaction becomes intense and the amounts of gas increase dramatically. As the active structure in the coal molecules is consumed in large quantities, the generated gas begins to decrease. During the burnout stage, the amount of gas is reduced to zero. There is a significant difference in the gas produced by the pre-oxidized and raw coal samples before 150 °C. Analysis of CO, H2O and CO2 gases on the same scale was carried out. The X-axis ranged from 30 °C to 150 °C, and the Y-axis ranged from 0 to 0.003. The results show that the coal with a pre-oxidation temperature of 120 °C released the most CO and CO2 gas, and the raw coal released the most H2O. There are numerous gaseous products formed during the spontaneous combustion of coal. CO appears first and exhibits a sensitive increase with increasing oxidizing temperature.38,39 As the main indicator gas, CO concentration is often used by various countries (such as Russia, China, America and Germany) to predict the degree of spontaneous combustion of coal.40,41 Because CO2 gas does not exhibit a sensitivity increase with increasing oxidizing temperature, it is not considered as an indicator gas. However, CO2 gas is also a product of coal oxidation. Therefore, pre-oxidation may change the molecular structure of coal. The numbers and types of active groups of the pre-oxidized samples may increase at 120 °C; therefore, they more readily react with oxygen to release gas. Due to the evaporation of water and desorption of gases, raw coal cannot be easily heated during storage in the low temperature stage.
3.4 Functional groups evolve during oxidation
The three major classes of functional groups in coal are oxygen-containing functional groups, aliphatic hydrocarbons, and aromatic hydrocarbons.42 With the combination of TG, DSC, CO, CO2 and H2O curves in the spontaneous combustion process of both pre-oxidized and raw coal, the effect of pre-oxidation is obvious in the low temperature stage of coal spontaneous combustion. The functional group changes of coal spontaneous combustion before 150 °C are analyzed in detail.
3.4.1 Oxygen-containing functional groups.
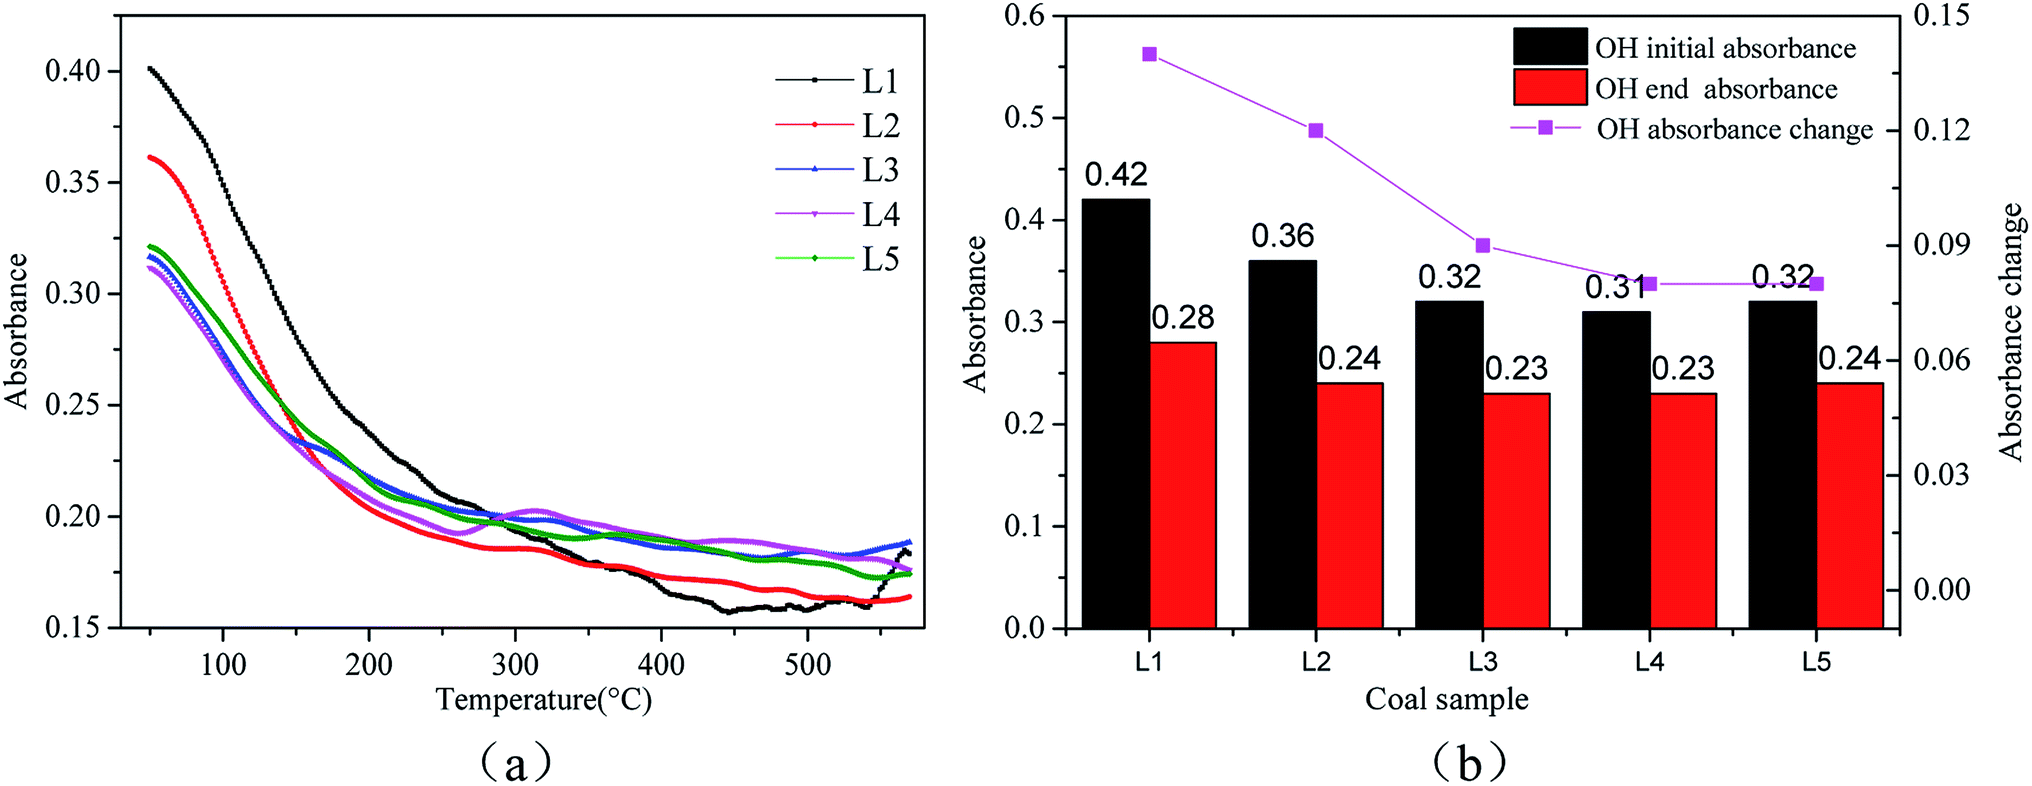
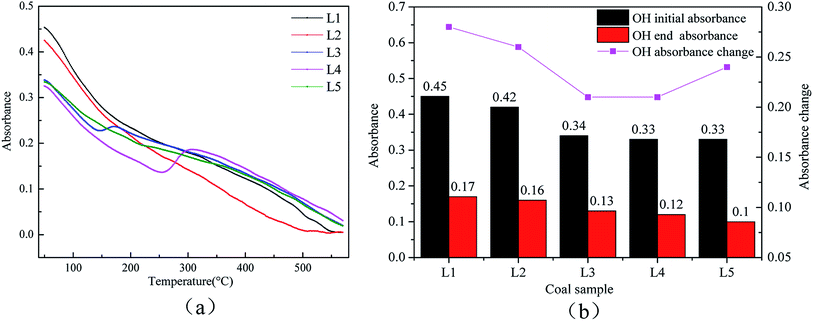
The hydroxyl group is one of the important functional groups in coal molecules. According to the results of in situ infrared spectroscopy of the coal samples, the–OH bond peaks at 3631 cm−1 and 3485 cm−1 were selected to obtain the variation of the –OH oxidation process with temperature. Fig. 6(a) and (b) show the evolution of the –OH bond during coal spontaneous combustion. Fig. 7(a) and 6(b) shows the changes in absorbance of the –OH bonds of the pre-oxidized and raw coal samples before 150 °C, respectively. Blue indicates the initial value and red indicates the end value. As the treatment temperature increases, the broken line represents the amount of participation of the –OH bond.
 |
| | Fig. 6 Changes in the –OH bonds at 3631 cm−1 during coal spontaneous combustion: (a) the amounts of the functional group at each temperature; (b) the degrees of participation of the functional group. | |
 |
| | Fig. 7 Changes in the –OH bond at 3485 cm−1 during coal spontaneous combustion: (a) the amounts of the functional group at each temperature; (b) the degrees of participation of the functional group. | |
The 3631 cm−1 peak is due to free –OH, and the 3485 cm−1 peak arises from the associative structure with the molecule. As the temperature increases, the free –OH decreases during the oxidation process. The associative structure is a stable component of the coal macromolecular network and will gradually disappear as the amount of –OH in the coal molecules decreases. The free –OH and associated hydrogen bonds are active throughout the entire reaction process. Fig. 6(b) and 7(b) show that as the treatment temperature increases, the number of reactions involving OH and the associated hydrogen bonds begin to decline. The amount of reactions involved shows a steady change after the pre-treatment temperature rises to 120 °C. At the low temperature oxidation stage, the coal sample will desorb water.42 The water in the samples pre-oxidized at 120 °C is basically desorbed. Less of the heat generated in the oxidation process of coal is consumed by water, and the coal can more readily store heat. Therefore, the risk of spontaneous combustion of coal increases.
3.4.2 Analysis of aliphatic hydrocarbons.
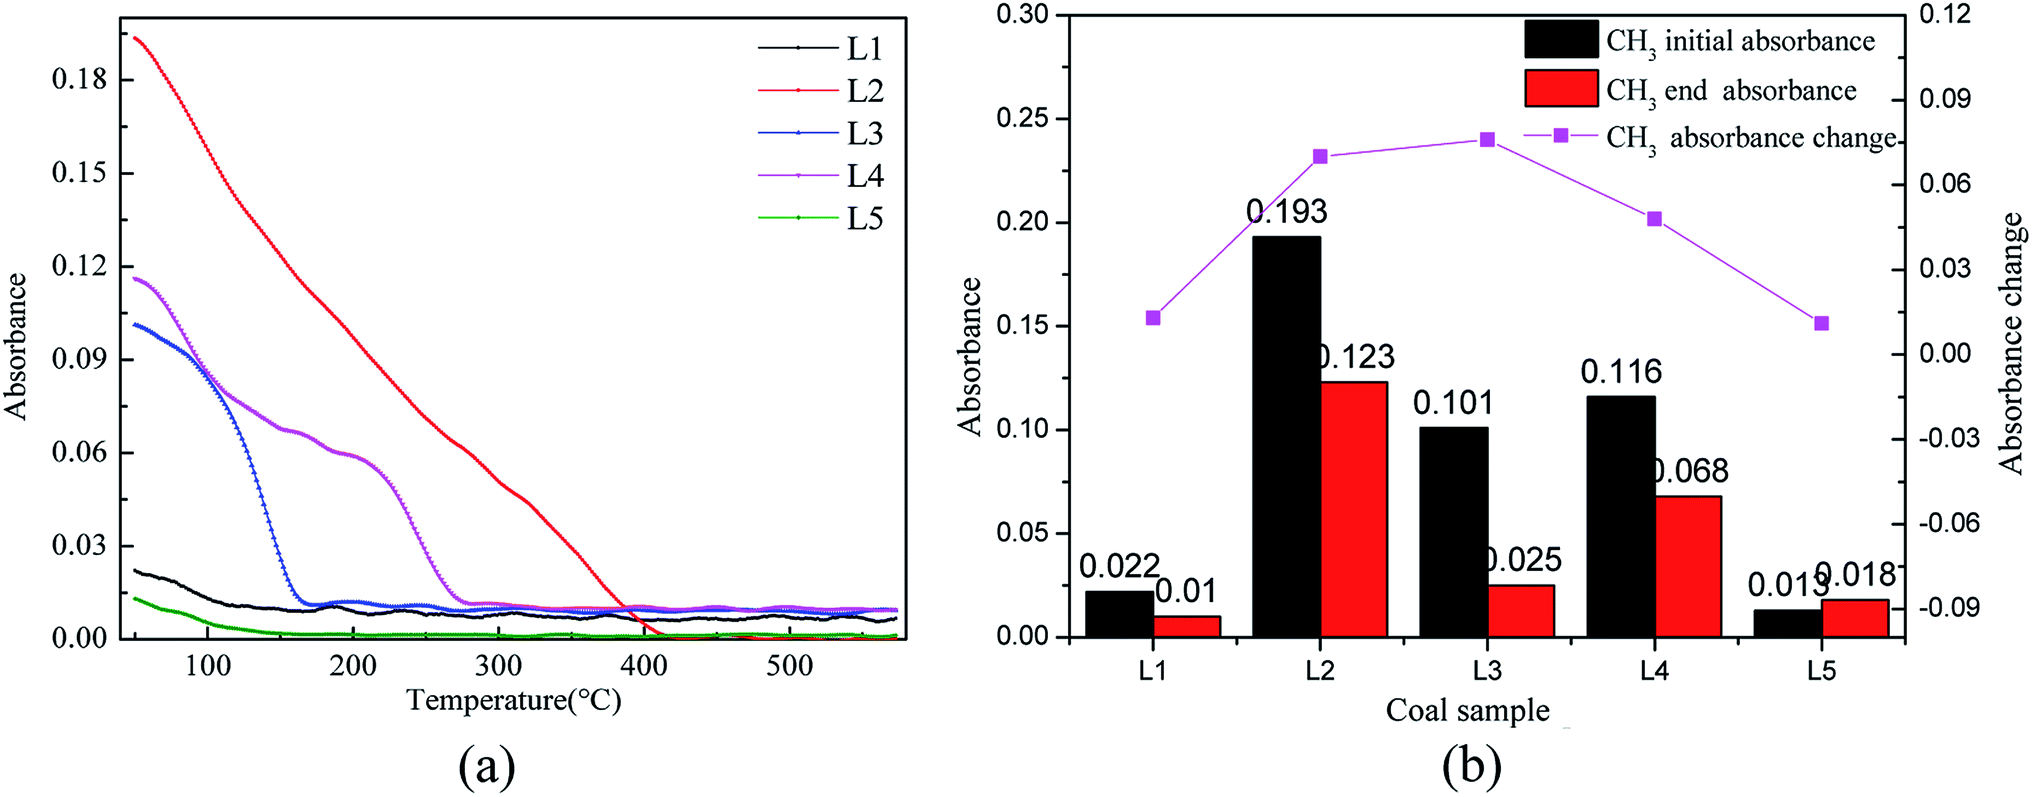
Aliphatic hydrocarbons mainly show antisymmetric stretching vibrations of –CH3 at 2975 cm−1 to 2945 cm−1 and oppositional stretching vibrations of –CH2 at 2930 cm−1 to 2880 cm−1. According to the Fourier infrared spectroscopy results of the coal samples, the wave position corresponding to the maximum absorbance of aliphatic hydrocarbons was selected as the research object. The oxidation process of aliphatic hydrocarbons as indicated by the –CH3 absorbance at 2975 cm−1 was selected for the study as a function of temperature. Fig. 8(a) shows the changes in the –CH3 bonds. Fig. 8(b) shows a bar graph of the –CH3 bond absorbance of raw coal and the different pre-oxidized coal samples below 150 °C.
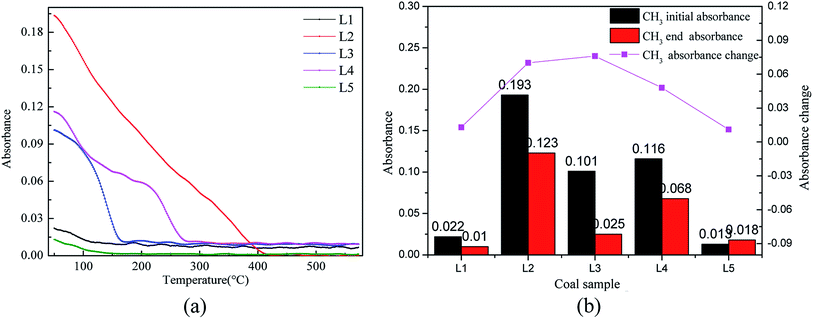 |
| | Fig. 8 Changes in the –CH3 bonds at 2975 cm−1 during coal spontaneous combustion: (a) the amounts of the functional group at each temperature; (b) the degrees of participation of the functional group. | |
As shown in Fig. 8(a), the aliphatic hydrocarbons are the main participants in the reaction. As the pre-oxidation temperature increases, the changes in the aliphatic hydrocarbon reactions in the coal samples with pre-oxidation temperatures of 80 °C, 120 °C and 160 °C are large. The aliphatic hydrocarbons in the coal sample with a pre-oxidation temperature of 80 °C mainly participate in the reaction below 400 °C; after that, the content changes little. Moreover, the coal samples with pre-oxidation temperatures of 120 °C and 160 °C participate in the reaction mainly below the temperatures of 150 °C and 280 °C, respectively. However, the changes in the aliphatic hydrocarbons in raw coal and the coal sample with a pre-oxidation temperature of 200 °C are small. This indicates that when the pre-oxidation temperature is less than or equal to 160 °C, the CH3 bond activity is enhanced, which increases the risk of spontaneous combustion of coal. Comprehensive analysis of the variation of aliphatic hydrocarbons in coal samples with different pre-oxidation levels during oxidative heating was performed (Fig. 8(b)). With increasing pre-oxidation temperature of the coal samples, the consumption rate of aliphatic hydrocarbons is the fastest in coal sample with a pre-oxidation temperature of 120 °C. The coal molecular structure is active and reacts with oxygen more readily under the same conditions.
3.4.3 Analysis of aromatic hydrocarbons.
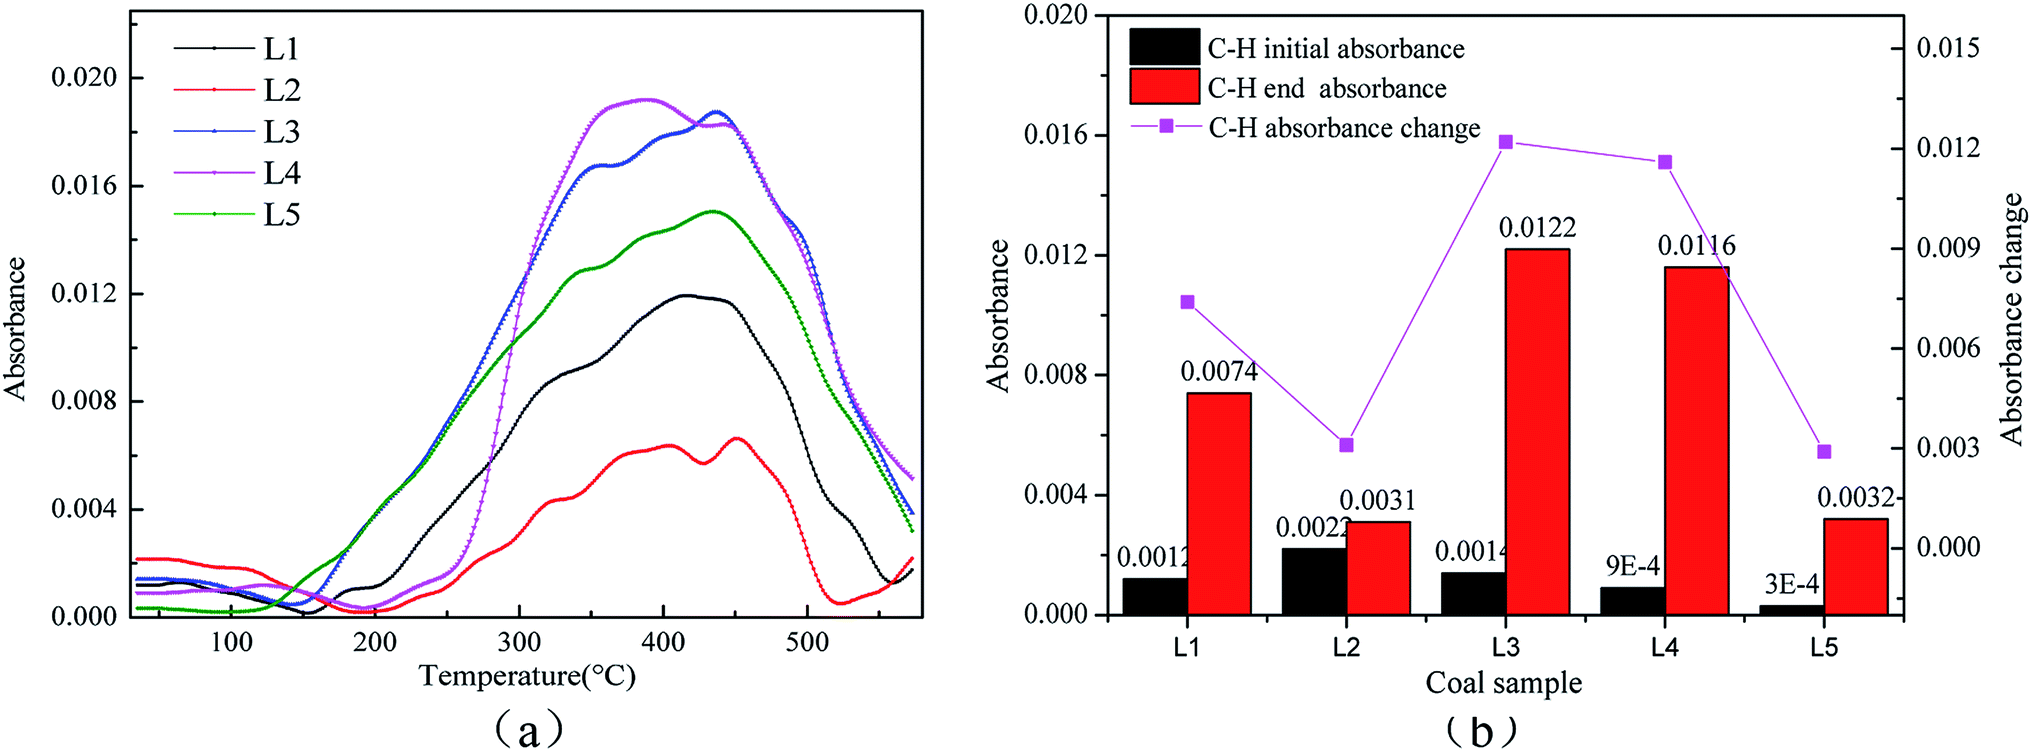
The C![[double bond, length as m-dash]](https://www.rsc.org/images/entities/char_e001.gif) C bonds in aromatic hydrocarbons are relatively stable in the coal structure. Aromatic hydrocarbon research mainly involves analyzing the C–H vibrations at 1895 cm−1. Fig. 9(a) shows the changes in the C–H bonds. The C–H structure is stable at the low temperature stage, so the variations before 300 °C were selected for study.43Fig. 9(b) shows a bar graph of the –CH3 bond absorbances of raw coal and different pre-oxidized coal samples below 300 °C.
C bonds in aromatic hydrocarbons are relatively stable in the coal structure. Aromatic hydrocarbon research mainly involves analyzing the C–H vibrations at 1895 cm−1. Fig. 9(a) shows the changes in the C–H bonds. The C–H structure is stable at the low temperature stage, so the variations before 300 °C were selected for study.43Fig. 9(b) shows a bar graph of the –CH3 bond absorbances of raw coal and different pre-oxidized coal samples below 300 °C.
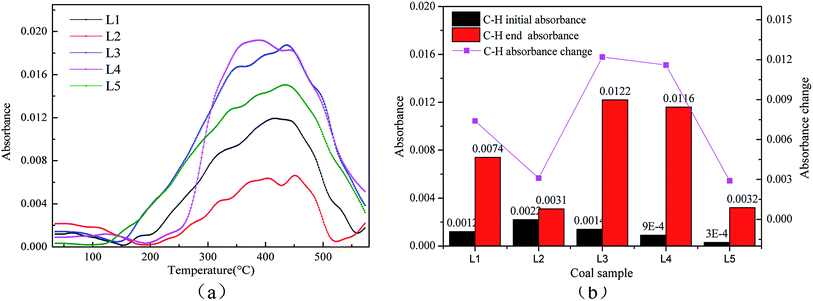 |
| | Fig. 9 Changes in the C–H bonds at 1895 cm−1 during coal spontaneous combustion: (a) the contents of the functional group at each temperature; (b) the degrees of participation of the functional group. | |
It is clear from Fig. 9(a) that the aromatic content of coal changed little before the temperature of 150 °C, which proves that the aromatic structures of the coal molecular structure are relatively stable and do not participate in the reaction at the low temperature stage. Kouichi Miura et al. also concluded that the C–H bond is not easily broken at the low temperature stage.43 The content of the C–H bond begins to increase after the low temperature stage. As the reaction temperature increases, the law of the C–H changes is similar to the law of CO2 gas production. Fig. 9(b) displays that the C–H bond production is the fastest in the secondary oxidation process of the coal sample with pre-oxidation at 120 °C. It is possible that when the coal pre-oxidation temperature reaches 120 °C, the molecular structure is activated and can readily react to produce C–H bonds.
3.5 Kinetic analysis
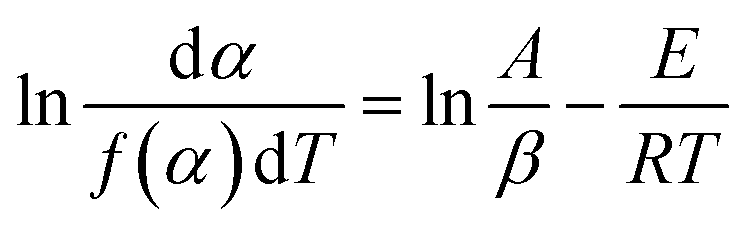
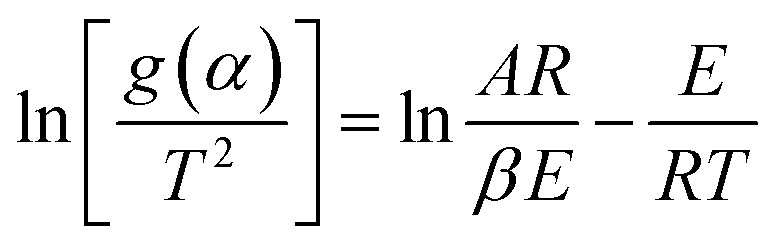
Because free water does not involve dynamics, the change of the C–H absorbance is not obvious before 150 °C. Therefore, kinetic calculations were performed for the active functional groups, the associated hydrogen bonds and –CH3. The Achar differential method and Coats–Redfern integral method were used to calculate the dynamics, as illustrated in eqn (1) and (2), respectively.32| | 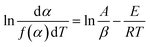 | (1) |
| | 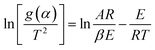 | (2) |
where E is a conversion value for the activation energy (J mol−1), β is the heating rate (K min−1), A is the pre-exponential factor (min−1), T is the absolute temperature, and R is the gas constant (8.314 J mol−1). α is the degree of conversion that can be defined by eqn (3):| | | α = (α0 − αT)/(α0 − αf) | (3) |
where α0 is the initial absorption intensity, αT is the absorption intensity of the functional group at temperature T, and αf is the final absorption intensity.
The reaction mechanisms corresponding to f(α) and g(α) are listed in Table 4.32,37,44 The Bagchi method was used to deduce the most probable mechanism functions.37 The raw data and the reaction mechanism functions f(α) and g(α) in Table 4 were substituted into the integral eqn (1) and the differential eqn (2), respectively, and then a series of activation energies were obtained. If the selected f(α) and g(α) are reasonable, the obtained activation energies are similar and the correlation coefficient of the fitted curve is excellent. Therefore, a group of mechanism functions with similar activation energies and high correlation were selected as the most probable mechanism functions, as shown in Table 5. The coal oxidation kinetics results are shown in Table 6.
Table 4 Reaction mechanism functions of the solid state process
| No. |
Reaction mechanism |
f(α) |
g(α) |
|
Chemical reaction
|
| 1 |
First-order |
1 – α |
−ln(1 – α) |
| 2 |
Second-order |
(1 – α)2 |
(1 – α)−1 |
| 3 |
Order of reaction |
(1 – α)2 |
(1 – α)−1 − 1 |
| 4 |
Third-order |
(1 – α)3 |
[(1 – α)−2 − 1]/2 |
|
|
Diffusion
|
| 5 |
One-dimensional diffusion |
1/2α−1 |
α
2
|
| 6 |
Two-dimensional diffusion Jander equation |
4(1 – α)1/2[1 − (1 − α)1/2]1/2 |
[1 − (1 − α)1/2]1/2 |
| 7 |
Two-dimensional diffusion Valensi equation |
[−ln(1 – α)]−1 |
α + (1 – α) ln(1 – α) |
| 8 |
Three-dimensional diffusion G–B equation |
3/2[(1 – α)−1/3 − 1]−1 |
1 – 2/3α − (1 – α)2/3 |
| 9 |
Three-dimensional diffusion anti-Jander equation |
3/2(1 + α)2/3[(1 + α)1/3 − 1]−1 |
[(1 + α)1/3 − 1]2 |
|
|
Limiting surface reaction between both phases
|
| 10 |
One dimension |
1 |
α
|
| 11 |
Two dimension |
2(1 – α)1/2 |
1 – (1 – α)1/2 |
| 12 |
Three dimension |
3(1 – α)2/3 |
1 – (1 – α)1/3 |
|
|
Random nucleation and nuclei growth
|
| 13 |
Avrami–Erofeev equation, n = 1/3 |
3(1 – α)[−ln(1 – α)]2/3 |
[−ln(1 – α)]1/3 |
| 14 |
Avrami–Erofeev equation, n = 3/2 |
2/3(1 – α)[−ln(1 – α)]−1/2 |
[−ln(1 – α)]3/2 |
| 15 |
Avrami–Erofeev equation, n = 2 |
1/2(1 – α)[−ln(1 – α)]−1 |
[−ln(1 – α)]2 |
| 16 |
Avrami–Erofeev equation, n = 3 |
1/3(1 – α)[−ln(1 – α)]−2 |
[−ln(1 – α)]3 |
| 17 |
Avrami–Erofeev equation, n = 4 |
1/4(1 – α)[−ln(1 – α)]−3 |
[−ln(1 – α)]4 |
|
|
Exponential nucleation
|
| 18 |
Mampel power, n = 1/2 |
2α1/2 |
α
1/2
|
| 19 |
Mampel power, n = 1/3 |
3α2/3 |
α
1/3
|
| 20 |
Mampel power, n = 1/4 |
4α3/4 |
α
1/4
|
Table 5 Linear fitting results of the –OH bond in coal sample L1 under different reaction mechanisms
| Kinetic model |
E
1 (kJ mol−1) |
R
2 (%) |
Kinetic model |
E
2 (kJ mol−1) |
R
2 (%) |
|
f(α)1 |
39.75 |
96.11 |
g(α)1 |
29.24 |
91.39 |
|
f(α)2 |
26.21 |
85.35 |
g(α)2 |
61.63 |
91.32 |
|
f(α)3
|
58.72
|
99.66
|
g(α)3
|
61.63
|
99.32
|
|
f(α)4 |
9.90 |
97.46 |
g(α)4 |
11.31 |
92.01 |
|
f(α)5 |
58.84 |
88.40 |
g(α)5 |
13.11 |
55.12 |
|
f(α)6 |
13.09 |
87.70 |
g(α)6 |
−6.23 |
47.85 |
|
f(α)7 |
66.15 |
91.53 |
g(α)7 |
42.79 |
90.40 |
|
f(α)8 |
69.23 |
92.70 |
g(α)8 |
48.50 |
93.50 |
|
f(α)9 |
52.50 |
86.21 |
g(α)9 |
20.34 |
60.48 |
|
f(α)10 |
26.33 |
85.67 |
g(α)10 |
−19.40 |
97.60 |
|
f(α)11 |
32.36 |
91.90 |
g(α)11 |
18.45 |
89.30 |
|
f(α)12 |
34.67 |
93.55 |
g(α)12 |
21.14 |
90.27 |
|
f(α)13 |
9.13 |
91.53 |
g(α)13 |
−1.38 |
−12.18 |
|
f(α)14 |
62.72 |
96.52 |
g(α)14 |
52.21 |
96.86 |
|
f(α)15 |
85.69 |
96.70 |
g(α)15 |
75.18 |
97.80 |
|
f(α)16 |
131.62 |
96.87 |
g(α)16 |
121.11 |
98.01 |
|
f(α)17 |
177.55 |
96.95 |
g(α)17 |
167.04 |
97.93 |
|
f(α)18 |
10.07 |
76.94 |
g(α)18 |
−24.82 |
98.25 |
|
f(α)19 |
4.65 |
59.77 |
g(α)19 |
−27.53 |
98.17 |
|
f(α)20 |
1.94 |
26.44 |
g(α)20 |
−3.27 |
−9.03 |
Table 6 Apparent activation energies and kinetic models of the functional groups
| Functional group |
Coal sample |
Activation energy (kJ mol−1) |
Kinetic model |
f(α) |
g(α) |
| –OH |
L1 |
60.17 |
Order of reaction |
(1 – α)2 |
(1 – α)−1 − 1 |
| L2 |
58.85 |
Order of reaction |
(1 – α)2 |
(1 – α)−1 − 1 |
| L3 |
55.25 |
Order of reaction |
(1 – α)2 |
(1 – α)−1 − 1 |
| L4 |
57.78 |
Order of reaction |
(1 – α)2 |
(1 – α)−1 − 1 |
| L5 |
58.10 |
Order of reaction |
(1 – α)2 |
(1 – α)−1 − 1 |
| –CH3 |
L1 |
76.02 |
Order of reaction |
(1 – α)2 |
(1 – α)−1 − 1 |
| L2 |
58.76 |
Order of reaction |
(1 – α)2 |
(1 – α)−1 − 1 |
| L3 |
55.16 |
Order of reaction |
(1 – α)2 |
(1 – α)−1 − 1 |
| L4 |
62.97 |
Order of reaction |
(1 – α)2 |
(1 – α)−1 − 1 |
| L5 |
57.89 |
Order of reaction |
(1 – α)2 |
(1 – α)−1 − 1 |
The oxidation kinetics characteristics of –OH and –CH3 in the coal samples with different pre-oxidation temperatures are similar. All the mechanism functions are order of reaction. The activation energies in Table 6 are in the range of 55 to 77 kJ mol−1. Using the FR, KAS and FWO isoconversional methods, B. Engin et al. measured the activation energies of two kinds of low-grade lignite and obtained similar results.45 In addition, the activation energy of lignite is lower than that of high metamorphic coal.31 This indicates that lignite is prone to chemical reaction with oxygen at the initial stage of reaction, and the risk of spontaneous combustion of coal is relatively high. The activation energies of the pre-oxidized coal samples are all lower than that of raw coal, among which the activation energies of –OH and –CH3 are the lowest in the coal samples with a pre-oxidation temperature of 120 °C. The activation energy represents the minimum energy required for the reactant molecules to reach the activated molecule. The spontaneous combustion risk of the pre-oxidized coal samples increased, and the coal sample with a pre-oxidation temperature of 120 °C is the most prominent.
In summary, our work focused on two novel points. One is that the experimental results show that the characteristic temperature, thermal effect and gas release of coal samples after pre-oxidation treatment mainly change at the low temperature stage. The other novel point is that the functional group changes and dynamic characteristics of the coal samples were analyzed below 150 °C.
4 Conclusion
The characteristic parameters of the spontaneous combustion of lignite were analyzed by STA-FTIR and in situ FTIR spectroscopy. Combined with the quality changes of the coal samples, thermal effects and gas release, the oxidation process of coal with different pre-oxidation temperatures was studied. As the pre-oxidation temperature increased, the critical temperatures and total heat absorption of the pre-oxidized coal samples were lower than those of the raw coal sample. For the coal with a pre-oxidation temperature of 120 °C, the critical temperature and total heat of the endothermic reaction were the lowest, which resulted in increases in CO release and CO2 gas production. CO gas is a more important indicator to evaluate the spontaneous combustion behavior of coal. CO2 gas is also a product of coal oxidation. Pre-oxidation changes the molecular structure of coal. The number and types of active groups of the sample pre-oxidized at 120 °C increased; therefore, it reacted more readily with oxygen to release gas. The participation amounts of the main functional groups were determined from in situ FTIR spectroscopy during the oxidation processes of pre-oxidized and raw coal. As the temperature increased, the active –OH and –CH3 bonds were consumed by the reaction. In the low temperature stage, for the coal sample with a pre-oxidation temperature of 120 °C, the pre-oxidation step weakened some functional groups in the coal, but the participation amount of the –CH3 structure increased. However, the C–H bond was relatively stable and did not participate in the reaction. Because free –OH was not involved in the dynamics, the change in the C–H absorbance was not obvious before 150 °C. The kinetic analysis was presented based on –OH and –CH3 during coal secondary oxidation. The reaction mechanism functions for –OH and –CH3 followed the order of reaction. The activation energies were in the range of 55 to 77 kJ mol−1. The activation energies of the pre-oxidized coal samples were lower than that of raw coal, among which the activation energies of –OH and –CH3 were the lowest in the coal sample with a pre-oxidation temperature of 120 °C. Conclusively, the risk of spontaneous combustion of pre-oxidized coal increases during secondary oxidation, and the risk is greatest when the temperature climbs to 120 °C.
Conflicts of interest
There are no conflicts to declare.
Acknowledgements
This research was supported by the National Natural Science Foundation of China [Grant No. 51404195] and the Key Projects of Prevention and Controlling Technology of Major Accidents for Safety Production Funded by State Administration of Work Safety: [Grant No. Shanxi-0008-2016AQ].
References
- Q. M. Huang, B. Wu, W. M. Cheng, B. W. Lei, H. H. Shi and L. Chen, Investigation of permeability evolution in the lower slice during thick seam slicing mining and gas drainage: a case study from the Dahuangshan coalmine in China, J. Nat. Gas Sci. Eng., 2018, 52, 141–154, DOI:10.1016/j.jngse.2018.01.036.
- B. Y. Jiang, L. G. Wang, Y. L. Lu, X. K. Sun and G. Jin, Ground pressure and overlying strata structure for a repeated mining face of residual coal after room and pillar mining, Int. J. Min. Sci. Technol., 2016, 26, 645–652, DOI:10.1016/j.ijmst.2016.05.017.
- J. M. Zhu, Z. W. Ma, J. H. Xu and J. N. Wu, Research on the technology of filling and repeated mining in thick coal seam affected by small mine gob area, ISMSSE, 2011, 26, 2011 Search PubMed.
-
Q. L. He, W. Peng and H. Y. Yuan, Technologies of Open the Fired Zone of 1504 Working Surface in Jiaxin Coalmine Safely, 2012 International Symposium on Safety Science and Technology, vol. 45, 2012, pp. 893–897, DOI:10.1016/j.proeng.2012.08.255.
-
F. B. Zhou, J. H. Li, S. He and Y. S. Liu, Experimental modeling study on the reignition phenomenon when opening a sealed fire zone, Proceedings of the International Conference on Mining Science & Technology (ICMST2009), vol. 1, 2009, pp. 161–168, DOI:10.1016/j.proeps.2009.09.027.
- Z. L. Shao, D. M. Wang, Y. M. Wang, X. X. Zhong, X. F. Tang and X. M. Hu, Controlling coal fires using the three-phase foam and water mist techniques in the Anjialing Open Pit Mine, China, Nat. Hazards, 2015, 75, 1833–1852, DOI:10.1007/s11069-014-1401-3.
- J. Deng, J. Y. Zhao, A. C. Huang, Y. N. Zhang, C. P. Wang and C. M. Shu, Thermal behavior and microcharacterization analysis of second-oxidized coal, J. Therm. Anal. Calorim., 2017, 127, 439–448, DOI:10.1007/s10973-016-5493-8.
- G. Wang, Q. Q. Liu, L. L. Sun, X. Song, W. Z. Du, D. C. Yan and Y. Wang, Secondary Spontaneous Combustion Characteristics of Coal Based on Programed Temperature Experiments, J. Energy Resour. Technol., 2018, 140, 1–8, DOI:10.1115/1.4039659.
- W. Lu, Y. J. Z. Cao and J. C. Tien, Method for prevention and control of spontaneous combustion of coal seam and its application in mining field, Int. J. Min. Sci. Technol., 2017, 27, 839–846, DOI:10.1016/j.ijmst.2017.07.018.
- D. S. Nimaje and D. P. Tripathy, Characterization of some Indian coals to assess their liability to spontaneous combustion, Fuel, 2016, 163, 139–147, DOI:10.1016/j.fuel.2015.09.041.
- Z. Y. Song and C. Kuenzer, Spectral reflectance (400–2500 nm) properties of coals, adjacent sediments, metamorphic and pyrometamorphic rocks in coal-fire areas: a case study of Wuda coalfield and its surrounding areas, Northern China, Int. J. Coal Geol., 2017, 171, 142–152, DOI:10.1016/j.coal.2017.01.008.
- C. K. Lei, J. Deng, K. Cao, Y. Xiao, L. Ma, W. F. Wang, T. Ma and C. M. Shu, A comparison of random forest and support vector machine approaches to predict coal spontaneous combustion in gob, Fuel, 2019, 239, 297–311, DOI:10.1016/j.fuel.2018.11.006.
- Y. L. Xu, L. Y. Wang, N. Tian, J. P. Zhang, M. G. Yu and M. A. Delichatsios, Spontaneous combustion coal parameters for the Crossing-Point Temperature (CPT) method in a Temperature–Programmed System (TPS), Fire Saf. J., 2017, 91, 147–154, DOI:10.1016/j.firesaf.2017.03.084.
- Z. L. Song, L. S. Yao, C. M. Jing, X. Q. Zhao, X. Q., W. L. Wang, J. Sun, Y. P. Mao and C. Y. Ma, Elucidation of the Pumping Effect during Microwave Drying of Lignite, Ind. Eng. Chem. Res., 2016, 55, 3167–3176, DOI:10.1021/acs.iecr.5b04881.
- J. Wang, Y. Q. He, H. Li, J. D. Yu, W. N. Xie and H. Wei, The molecular structure of Inner Mongolia lignite utilizing XRD, solid state 13C NMR, HRTEM
and XPS techniques, Fuel, 2017, 203, 764–773, DOI:10.1016/j.fuel.2017.05.042.
- D. Choudhury, A. Sarkar and L. C. Ram, An Autopsy of Spontaneous Combustion of Lignite, Int. J. Coal Prep. Util., 2016, 36, 109–123, DOI:10.1080/19392699.2015.1060968.
- Y. B. Tang and S. Xue, Laboratory Study on the Spontaneous Combustion Propensity of Lignite Undergone Heating Treatment at Low Temperature in Inert and Low-Oxygen Environments, Energy Fuels, 2015, 29, 4683–4689, DOI:10.1021/acs.energyfuels.5b00217.
- Y. X. Zhang, J. X. Dong, F. H. Guo, X. K. Chen, J. J. Wu, Z. Y. Miao and L. Xiao, Effects of the evolutions of coal properties during nitrogen and MTE drying processes on the spontaneous combustion behavior of Zhaotong lignite, Fuels, 2018, 232, 299–307, DOI:10.1016/j.fuel.2018.05.169.
- H. Choi, C. Thiruppathiraj, S. Kim, Y. Rhim, J. Lim and S. Lee, Moisture readsorption and low temperature oxidation characteristics of upgraded low rank coal, Fuel Process. Technol., 2011, 92 DOI:10.1016/j.fuproc.2011.05.025.
- J. H. Li, Z. H. Li, Y. L. Yang, B. Kong and C. J. Wang, Laboratory study on the inhibitory effect of free radical scavenger on coal spontaneous combustion, Fuel Process. Technol., 2018, 171, 350–360, DOI:10.1016/j.fuproc.2017.09.027.
- L. Shi, Q. Y. Liu, X. J. Guo, W. Z. Wu and Z. Y. Liu, Pyrolysis behavior and bonding information of coal—A TGA study, Fuel Process. Technol., 2013, 108, 125–132, DOI:10.1016/j.fuproc.2012.06.023.
- Y. Y. Zhang, Z. Z. Zhang, M. M. Zhu, F. Q. Cheng and D. K. Zhang, Decomposition of key minerals in coal gangues during combustion in O2/N2 and O2/CO2 atmospheres, Appl. Therm. Eng., 2019, 148, 125–132, DOI:10.1016/j.applthermaleng.2018.11.113.
- A. Iordanidis, A. Georgakopoulos, K. Markova, A. Filippidis and A. Kassoli-Fournaraki, Application of TG-DTA to the study of Amynteon lignites, northern Greece, Thermochim. Acta, 2001, 371, 137–141, DOI:10.1016/S0040-6031(01)00418-X.
- Y. T. Zhang, Y. R. Liu, X. Q. Shi, C. P. Yang, W. F. Wang and Y. Q. Li, Risk evaluation of coal spontaneous combustion on the basis of auto-ignition temperature, Fuel, 2018, 233, 68–76, DOI:10.1016/j.fuel.2018.06.052.
- S. Yuan, J. Z. Liu, J. F. Zhu, Q. Q. Zhou, Z. H. Wang, J. H. Zhou and K. F. Cen, Effect of microwave irradiation on the propensity for spontaneous combustion of Inner Mongolia lignite, J. Loss Prev. Process Ind., 2016, 44, 390–396, DOI:10.1016/j.jlp.2016.10.011.
- Y. L. Zhang, J. F. Wang, S. Xue, J. M. Wu, L. P. Chang and Z. F. Li, Kinetic study on changes in methyl and methylene groups during low-temperature oxidation of coal via in situ FTIR, Int. J. Coal Geol., 2016, 154, 155–164, DOI:10.1016/j.coal.2016.01.002.
- Y. Kadioğlu and M. Varamaz, The effect of moisture content and air-drying on spontaneous combustion characteristics of two Turkish lignites, Fuel, 2003, 82, 1685, DOI:10.1016/S0016-2361(02)00402-7.
- B. Chen, Z. J. Diao and H. Y. Lu, Using the ReaxFF reactive force field for molecular dynamics simulations of the spontaneous combustion of lignite with the Hatcher lignite model, Fuel, 2014, 116, 7–13, DOI:10.1016/j.fuel.2013.07.113.
- T. Bin, Y. Y. Qiao, L. Bai, W. Feng, Y. Jiang and Y. Y. Tian, Pyrolysis behavior and kinetics of the trapped small molecular phase in a lignite, Energy Convers. Manage., 2017, 140, 109–120, DOI:10.1016/j.enconman.2017.02.077.
- B. Engin and H. Atakül, Air and oxy-fuel combustion kinetics of low rank lignites, J. Energy Inst., 2018, 91, 311–322, DOI:10.1016/j.joei.2016.11.004.
- B. Li, G. Chen, H. Zhang and C. D. Sheng, Development of non-isothermal TGA–DSC for kinetics analysis of low temperature coal oxidation prior to ignition, Fuel, 2014, 118, 385–391, DOI:10.1016/j.fuel.2013.11.011.
- F. S. Yang, A. N. Zhou, W. Zhao, Z. Y. Yang and H. J. Li, Thermochemical behaviors, kinetics and gas emission analyses during co-pyrolysis of walnut shell and coal, Thermochim. Acta, 2019, 673, 26–33, DOI:10.1016/j.tca.2019.01.004.
- H. Li, Y. Chen, Y. Cao, G. J. Liu and B. Q. Li, Comparative study on the characteristics of ball-milled coal fly ash, J. Therm. Anal. Calorim., 2016, 124, 839–846, DOI:10.1007/s10973-015-5160-5.
- X. Y. Qi, Q. Z. Li, H. J. Zhang and H. H. Xin, Thermodynamic characteristics of coal reaction under low oxygen concentration conditions, J. Energy Inst., 2017, 90, 544–555, DOI:10.1016/j.joei.2016.05.007.
- C. P. Wang, Y. Yang, Y. T. Tsai, J. Deng and C. M. Shu, Spontaneous combustion in six types of coal by using the simultaneous thermal analysis-Fourier transform infrared spectroscopy technique, J. Therm. Anal. Calorim., 2016, 126, 1591–1602, DOI:10.1007/s10973-016-5685-2.
- B. S. Nie, X. F. Liu, L. L. Yang, J. Q. Meng and X. C. Li, Pore structure characterization of different rank coals using gas adsorption and scanning electron microscopy, Fuel, 2015, 158, 908–917, DOI:10.1016/j.fuel.2015.06.050.
- J. Deng, Y. Yang, Y. N. Zhang, B. Liu and C. M. Shu, Inhibiting effects of three commercial inhibitors in spontaneous coal combustion, Energy, 2018, 1174–1185, DOI:10.1016/j.energy.2018.07.040.
- S. R. Dindarloo, M. M. Hood, A. Bagherieh and J. C. Hower, A statistical assessment of carbon monoxide emissions from the Truman Shepherd coal fire, Int. J. Coal Geol., 2015, 144, 88–97, DOI:10.1016/j.coal.2015.03.012.
- M. G. Yu, J. Xie and H. Jia, Release laws of CO produced by coal structure destruction under mechanical force and modification method of the index for predicting coal spontaneous combustion, J. China Univ. Min. Technol., 2017, 46, 762–768 Search PubMed.
- J. H. Li, Z. H. Li, Y. L. Yang, C. J. Wang and L. T. Sun, Experimental study on the effect of mechanochemistry on coal spontaneous combustion, Powder Technol., 2018, 339, 102–110, DOI:10.1016/j.powtec.2018.08.006.
- Q. Xu, S. Q. Yang, J. W. Cai, B. Z. Zhou and Y. N. Xin, Risk forecasting for spontaneous combustion of coals at different ranks due to free radicals and functional groups reaction, Process Saf. Environ. Prot., 2018, 118, 195–202, DOI:10.1016/j.psep.2018.06.040.
- X. K. Chen, T. Ma, X. W. Zhai and C. K. Lei, Thermogravimetric and infrared spectroscopic study of bituminous coal spontaneous combustion to analyze combustion reaction kinetics, Thermochim. Acta, 2019, 676, 84–93, DOI:10.1016/j.tca.2019.04.002.
- K. Miura, K. Mae, W. Li, T. Kusakawa, F. Morozumi and A. Kumano, Estimation of Hydrogen Bond Distribution in Coal through the Analysis of OH Stretching Bands in Diffuse Reflectance Infrared Spectrum Measured by In-Situ Technique, Energy Fuels, 2001, 15, 599–610, DOI:10.1021/ef0001787.
- S. Vyazovkin, A. K. Burnham, J. M. Criado, L. A. Pérez-Maqueda, C. Popescu and N. Sbirrazzuoli, ICTAC Kinetics Committee recommendations for performing kinetic computations on thermal analysis data, Thermochim. Acta, 2011, 520, 1–19, DOI:10.1016/j.tca.2011.03.034.
- B. Engin and H. Atakül, Air and oxy-fuel combustion kinetics of low rank lignites, J. Energy Inst., 2018, 91, 311–3222, DOI:10.1016/j.joei.2016.11.004.
|
| This journal is © The Royal Society of Chemistry 2019 |
Click here to see how this site uses Cookies. View our privacy policy here. 
 Open Access Article
 This Open Access Article is licensed under a Creative Commons Attribution-Non Commercial 3.0 Unported Licence
 *ab,
Xiaokun
Chen
ab,
Xiaowei
Zhai
ab and
Ya'e
Bai
c
*ab,
Xiaokun
Chen
ab,
Xiaowei
Zhai
ab and
Ya'e
Bai
c