 Open Access Article
NiFe2O4 nanoparticles supported on cotton-based carbon fibers and their application as a novel broadband microwave absorbent
Wanxi Li *,
Hongxue Qi,
Fang Guo,
Xianjun Niu,
Yien Du and
Yongqiang Chen*
College of Chemistry and Chemical Engineering, Jinzhong University, Jinzhong 030619, China. E-mail: liwanxi1986@163.com; chenyongqiang82@126.com
First published on 23rd September 2019
Abstract
In this work, NiFe2O4 nanoparticles were successfully supported on cotton-based carbon fibers through a flexible two-step approach consisting of calcination of cotton in a N2 atmosphere and subsequent hydrothermal reaction. The incorporation of the NiFe2O4 nanoparticles into cotton-based carbon fibers resulted in better impedance matching, leading to better microwave absorption performance than cotton-based carbon fibers and NiFe2O4 nanoparticles. For NiFe2O4/carbon fibers, reflection loss (RL) values less than −10 dB were obtained in the frequency range of 11.5–18 GHz with 2.4 mm thickness, which covered the entire Ku-band (from 12 to 18 GHz). Meanwhile, when the matching thickness was 3.2 mm, the RL values less than −10 dB were in the range of 8.0–12.7 GHz, which covered the entire X-band (from 8 to 12 GHz). This excellent and interesting microwave absorption performance can satisfy multiple applications. Owing to the characteristics of a cost-effective synthetic route, low density and excellent microwave absorption, the NiFe2O4/carbon fibers have a promising future in X-band and Ku-band absorption.
1. Introduction
In recent years, the rapid development of electronic communication technology has resulted in serious electromagnetic pollution and interference problems; therefore, there is an urgent demand for high-efficiency microwave absorbing materials (MAMs) to solve these problems.1,2 Among various MAMs, carbon-based composite MAMs containing both carbon materials and magnetic components not only can overcome the disadvantage of high density of magnetic components, but also have multiform electromagnetic loss and good impedance matching, which are good for microwave absorption.3–6 So far, carbon-based composite MAMs have attracted a lot of attention, and the carbon matrix materials which were used to prepare magnetic material/carbon composite MAMs were mainly carbon fibers, carbon nanotubes, graphene and metal–organic framework compounds.7–11 For example, Cao et al. synthesized Fe3O4–MWCNTs composites through co-precipitation route, and the minimum RL value reached −52.8 dB at 12.8 GHz, which was superior to the pure MWCNTs.12 Ji et al. synthesized Fe–Co/nanoporous carbon by the method of carbonizingdehydro-ascorbic acid (DHAA) coated Fe3O4 nanoparticles encapsulated in zeolitic imidazolate framework-67, and the absorption bandwidth for RL < −10 dB covered from 12.2 to 18 GHz.13 Although some progress has been made infabricating carbon-based MAMs and studying their microwave absorption performances, the preparation methods of cheap raw materials, simple process, and high yield are still one of the challenging topics and difficulties in the field of carbon-based MAMs.Nowadays, the efficient utilization of biomass has become a hot and difficult issue of great concern, and the application prospect of carbon materials derived from natural biomaterials was very wide because the biomaterials are vastly available, accessible and renewable.14–16 As a typical natural plant material, cotton has been widely planted in China, so the output is enormous and the price is low. Moreover, cotton is composed of cellulose fiber and usually contains very few inorganic impurities, making it a promising candidate for carbon fibers.17 Thus, if we use cotton as carbon source to prepare carbon fibers, and then load magnetic components on the carbon fibers to prepare carbon-based absorbents, which will have much significance on the utilization of biomass. Although there were extensive investigations on carbon-based absorbents, only a few reports involved with cotton.18,19 Therefore, it is very valuable to prepare novel sustainable microwave absorbent with simple and facile synthetic method using cotton as carbon source.
As an important magnetic material, spinel ferrite NiFe2O4 has extensive applications because of its low cost, non-toxicity, good mechanical and chemical stability, and various magnetic behaviors. These properties give NiFe2O4 great potential for microwave absorbing application.20,21 However, some disadvantages of NiFe2O4 nanoparticles such as high density, disparity of permittivity and permeability, and limited absorption bandwidth cannot meet the requirements of lightweight and highly efficient microwave absorbent.
In this paper, we first synthesized cotton-based carbon fibers through calcination of cotton in N2 atmosphere, and then octahedral NiFe2O4 nanoparticles with different contents were successfully supported on cotton-based carbon fibers through subsequent hydrothermal reaction. The crystalline structure, morphology, and microwave absorption performances of these hybrid materials were investigated. The aim of this paper is to prepare carbon-based absorbent using cotton as carbon source and investigate its microwave absorption performance. As we expected, the NiFe2O4/carbon fibers exhibit excellent microwave absorption in X-band and Ku-band.
2. Experimental
2.1 Materials preparation
All the reagents were A.R. grade and were used without further purification. The cotton was commercially available medical absorbent cotton (Caoxian Hualu Health Materials Company). High purity water was used throughout the experiments. N2 (high purity, Shanxi Yihong Gas Industry Co.) was used as a protective gas. NiFe2O4/carbon fibers were fabricated through a two-step process.(1) In a typical procedure, 4 g cotton was annealed in a horizontal tubular furnace at 700 °C for 2 h in N2 atmosphere, and the heating rate was 5 °C min−1. The obtained sample was cotton-based carbon fibers, which was called CCF.
(2) The NiFe2O4/carbon fibers were prepared by hydrothermal method. First, 10 mmol FeCl3·6H2O and 5 mmol Ni(NO3)2·6H2O were dissolved in 30 mL high purity water under constant stirring, followed by adding 30 mL NaOH aqueous solution with the concentration of 2 mol L−1. After constant stirring for 0.5 h at room temperature, 0.6 g CCF was added to the above solution and stirred for 0.5 h. The mixture was then transferred into a 100 mL Teflon-lined stainless steel autoclave, which was treated at 200 °C for 15 h in an electric drying oven. After completion of the reaction, the autoclave was cooled to room temperature naturally. The wet CCF was taken out and washed by water for three times on the Busher funnel, subsequently dried at 60 °C. The resulting product was NiFe2O4/carbon fibers, named as NiFe2O4/CCF-1. The content of NiFe2O4 in NiFe2O4/carbon fibers can be controlled by the method of controlling the metal salt concentration. If the additive amount of FeCl3·6H2O, Ni(NO3)2·6H2O, and NaOH is doubled and other conditions do not change, the final sample was named as NiFe2O4/CCF-2. But if the solution concentration continues to increase proportionally, the loading amount of NiFe2O4 cannot increase. By comparison, pure NiFe2O4 was prepared without cotton-based carbon fibers.
2.2 Materials characterization
Crystal phase analysis of the samples was performed by X-ray diffraction (XRD-6100, Shimadzu) using Cu Kα radiation (λ = 1.5406 Å), employing a scan step of 0.01° in the 2θ rang of 10° to 80°. The morphology and structure of the samples were observed by scanning electron microscope (SEM, JSM-7001F) and high-resolution transmission electron microscope (HRTEM, JEOL-2010 at 200 kV). Thermogravimetric (TG) analysis was carried out on a STA6000 simultaneous thermal analyzer from 30 °C to 800 °C in N2 and air atmosphere at a heating rate of 10 °C min−1. The magnetic properties were measured using the Quantum Design MPMS-squid VSM-094 magnetometer at room temperature. The electromagnetic parameters of complex permittivity (εr = ε′ − jε′′) and complex permeability (μr = μ′ − jμ′′) were measured using an Agilent N5244A vector network analyzer, in which the specimens were prepared by uniformly mixing the synthesized samples in paraffin with a filling rate of 25 wt% and pressed into a cylindrical shaped compact (Φouter = 7.0 mm and Φinner = 3.0 mm).3. Results and discussion
3.1 Phase and morphology analysis
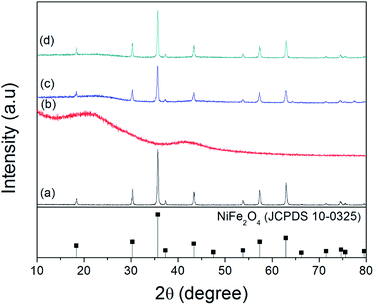
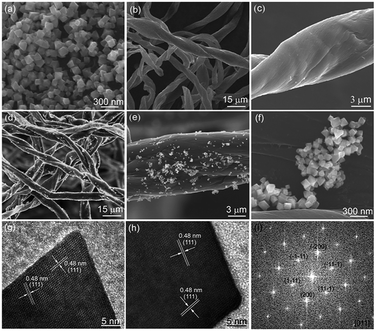
Fig. 1 shows the XRD pattern of the synthesized samples. During the hydrothermal reaction process, if we do not add cotton-based carbon fibers, all of the diffraction peaks of the final sample can be perfectly indexed to the spinel phase of NiFe2O4 (JCPDS 10-0325) (as shown in Fig. 1a). The narrow sharp peaks suggest that the NiFe2O4 is of high crystallinity. Fig. 1b shows the XRD pattern of cotton-based carbon fibers. There are two broad peaks at about 15–30° and 36–46°, which indicates an amorphous nature of the carbon component.22 Fig. 1c and d show typical XRD patterns of NiFe2O4/CCF-1 and NiFe2O4/CCF-2, and all of the diffraction peaks can be perfectly indexed to the spinel phase of NiFe2O4 (JCPDS 10-0325). In addition, it can be seen that the NiFe2O4 diffraction peaks of NiFe2O4/CCF-2 are more acute than those of NiFe2O4/CCF-1, which indicates the increase of NiFe2O4 loading amount.Fig. 2a shows the SEM image of NiFe2O4 nanoparticles. It is clear that the average diameter of NiFe2O4 nanoparticles is about 100 nm with octahedral morphology. Fig. 2b and c show the representative SEM images of cotton-based carbon fibers. It can be seen that the CCF has smooth surface with the diameter of 5–15 μm. For NiFe2O4/CCF-1, seen from the SEM images in Fig. 2d–f, the surface of the carbon fibers becomes rough, and the NiFe2O4 nanoparticles on the surface of carbon fibers are relatively dispersed, suggesting that NiFe2O4 nanoparticles are successfully loaded on the carbon fibers by hydrothermal method. Detailed crystal structure information of the NiFe2O4 nanoparticles was obtained through HRTEM technology. Fig. 2g and h shows the HRTEM images of NiFe2O4 nanoparticles in NiFe2O4/CCF-1, and two kinds of lattice fringes can be identified and the interplane distances are both 0.48 nm, which can be identified as the (111) plane of NiFe2O4. Electron diffraction (ED) pattern (Fig. 2i) further reveals that the as-formed NiFe2O4 nanoparticle is single crystalline nature. The zone axis index of [011] was calculated according to Weiss zone law.23
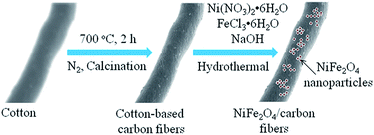
Based on the above XRD patterns and SEM images, the schematic illustration of the synthesis procedures for NiFe2O4/carbon fibers is shown in Fig. 3. At first, when cotton is put in a ceramic boat and annealed in a horizontal tubular furnace at 700 °C for 2 h in N2 atmosphere, the oxygen and hydrogen elements in the cellulose fiber of cotton will be translated to gas volatiles and released. After the calcination process is completed, the cotton could be converted into cotton-based carbon fibers. As depicted in Fig. 4a, the TG curve of cotton in N2 atmosphere shows a continuous weight loss that can be divided into three main stages: 30–300 °C, 300–400 °C, and 400–800 °C. The first stage of slight weight loss before 300 °C corresponds to the volatilization of absorbed water and other small molecule substances. During the second stage at 300–400 °C, the weight of cotton decreases sharply, owing mainly to the pyrolysis of cellulose. During the three stage at 400–800 °C, the weight loss is very small. This is because the cotton fibers have been pyrolyzed, and the remaining reactions should be the decomposition of a small amount of unstable substances in the carbonization residue under high temperature. The final carbonization residue is cotton-based carbon fibers. Since NiFe2O4 nanoparticles can be prepared through hydrothermal method, it is comprehensible that NiFe2O4 nanoparticles can be loaded on cotton-based carbon fiber when some cotton-based carbon fibers are added to the hydrothermal reactor. In a certain range, with the increase of the Fe3+, Ni2+, and OH− concentration, the contents of NiFe2O4 nanoparticles in NiFe2O4/carbon fibers would be increased. The contents of NiFe2O4 nanoparticles in NiFe2O4/carbon fibers were estimated with the weight gain of cotton-based carbon fiber in the hydrothermal reaction process. It has been calculated that the contents of NiFe2O4 nanoparticles in NiFe2O4/CCF-1 and NiFe2O4/CCF-2 were about 15.7 wt%, and 20.6 wt%, respectively. For further quantitative analysis, the TG analysis of NiFe2O4/CCF-1 and NiFe2O4/CCF-2 in air atmosphere was performed. From the TG curves in Fig. 4b, the distinct weight loss phenomenon is visible, which is dependent on the combustion of carbon. As carbon components can be completely burned in air, the residual product will be only NiFe2O4. It is clear that the weight contents of NiFe2O4 nanoparticles in NiFe2O4/CCF-1 and NiFe2O4/CCF-2 are approximately 14.3 wt%, and 20.5 wt%, respectively, which are consistent with the experimental results.
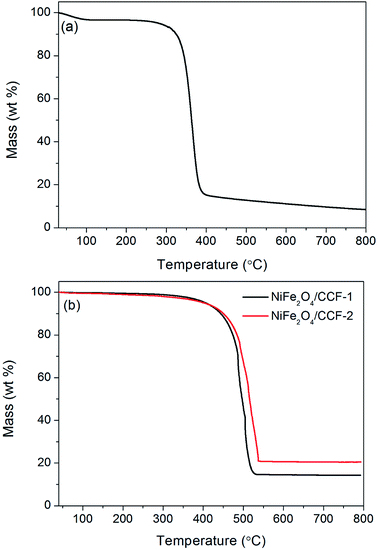 | ||
| Fig. 4 TG curves of (a) cotton in N2 atmosphere, and (b) NiFe2O4/CCF-1 and NiFe2O4/CCF-2 in air atmosphere. | ||
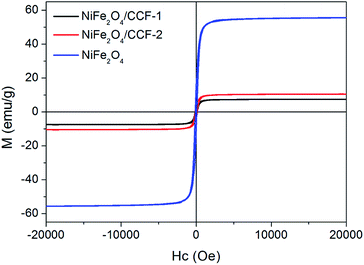
Fig. 5 shows the M–H loops of NiFe2O4/CCF-1, NiFe2O4/CCF-2 and NiFe2O4 at room temperature with the field sweeping from −20 to 20 kOe. It is clear that the three samples show ferromagnetic behavior, and the saturation magnetization (Ms) values of NiFe2O4/CCF-1, NiFe2O4/CCF-2 and NiFe2O4 are 7.49, 10.53, and 55.69 emu g−1, respectively, following the order of NiFe2O4 > NiFe2O4/CCF-2 > NiFe2O4/CCF-1, which is consistent with the content of NiFe2O4 nanoparticles.
3.2 Microwave absorption analysis
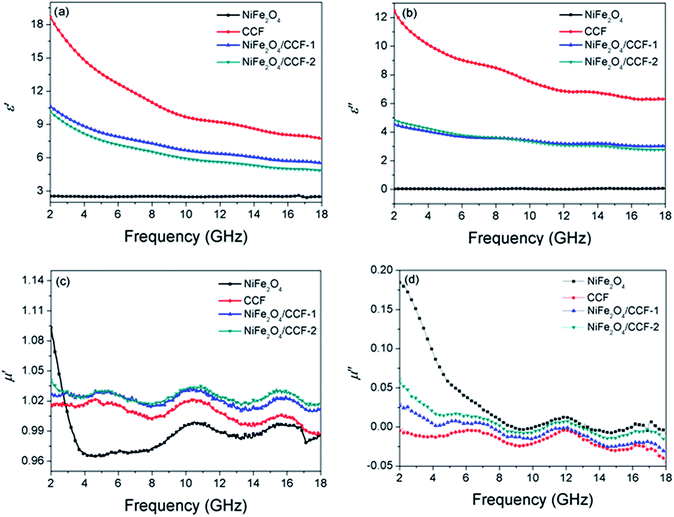
From the above analyses, NiFe2O4 nanoparticles with the size of about 100 nm were successfully supported on cotton-based carbon fibers by the present synthetic method. The electromagnetic parameters of the paraffin composites containing 25 wt% samples were measured to investigate the microwave absorption performances.Microwave absorption performance of absorbent are highly associated with its complex permittivity and complex permeability, where the real part (ε′) and imaginary part (ε′′) of relative complex permittivity reflect the storage capability and dissipation capability of electrical energy, and the real part (μ′) and imaginary part (μ′′) of relative complex permeability represent the storage capability and loss capability of magnetic energy.24,25 Fig. 6a and b show the complex permittivity of NiFe2O4, CCF, NiFe2O4/CCF-1, and NiFe2O4/CCF-2. It can be clearly seen that the ε′ value of NiFe2O4 nanoparticles remains almost constant at 2.5 with increasing frequency, and the ε′′ value is close to 0 in the range of 2–18 GHz, which mainly results from the low conductivity of NiFe2O4 nanoparticles. So the NiFe2O4 nanoparticles show very low dielectric loss. For CCF, NiFe2O4/CCF-1, and NiFe2O4/CCF-2, the values of ε′ are respectively in the range of 18.7–7.7, 10.6–5.5, and 10.1–4.8 in the frequency range of 2–18 GHz. Meanwhile, the values of ε′′ are respectively in the range of 12.5–6.3, 4.5–3.0, and 4.8–2.8. It is observed that the ε′ and ε′′ of complex permittivity of the CCF is higher than that of the NiFe2O4/carbon fibers in the range of 2–18 GHz, which is mainly because the CCF has high conductivity, and the loading of NiFe2O4 nanoparticles decrease the conductivity of samples, which finally results in lower ε′ and ε′′. The μ′ and μ′′ of complex permeability are displayed in Fig. 6c and d, it is clear that the μ′ and μ′′ of complex permeability of NiFe2O4/carbon fibers are much higher than those of CCF, which can be explained by the introduction of magnetic NiFe2O4 nanoparticles. In addition, the negative μ′′ is observed for CCF, NiFe2O4/CCF-1, and NiFe2O4/CCF-2, and similar phenomenon was also observed in other reports.26,27 Generally speaking, a negative μ′′ value denotes that the magnetic energy is radiated out from the absorbent. It can be attributed to the motion of charges in composite. According to the literature, the motion of free charges can produce an AC electric field, and a magnetic field can be induced by the AC electric field and be radiated out.28 In addition, if the μ′′ value is very small, some other reasons such as signal noise may also cause negative μ′′.
According to transmission line theory, the RL curves can be evaluated using the measured complex permittivity and complex permeability according to the following equations:29,30
Zin = (μr/εr)1/2![[thin space (1/6-em)]](https://www.rsc.org/images/entities/char_2009.gif) tanh[j(2πfd/c)(μrεr)1/2], tanh[j(2πfd/c)(μrεr)1/2],
| (1) |
RL(dB) = 20![[thin space (1/6-em)]](https://www.rsc.org/images/entities/char_2009.gif) log|(Zin − Z0)/(Zin + Z0)|, log|(Zin − Z0)/(Zin + Z0)|,
| (2) |
Fig. 7 displays the calculated RL for the absorbents consisting of NiFe2O4, CCF, NiFe2O4/CCF-1, and NiFe2O4/CCF-2 dispersed in paraffin matrix. It is well accepted that the RL is closely related to the thickness of the absorbent. Therefore, we calculated the RL curves at different thicknesses of 2.0, 2.4, 2.8, 3.2, and 3.6 mm for each specimen. In general, absorbent with RL < −10 dB is considered to be suitable for application, so the effective bandwidth represents the bandwidth of RL below −10 dB. As illustrated in Fig. 7, it is obviously that the RL curves gradually shift toward lower frequency with the increase of thickness, which can be explained by the “geometrical effect”.31 As seen in Fig. 7a, the RL of the NiFe2O4 nanoparticles is rather low, and the effective bandwidth is 0. For CCF, the minimum RL is −11.3 dB while the effective bandwidth achieves 1.6 GHz (from 9.3 to 10.9 GHz) with a matching thickness of 2 mm (as shown in Fig. 7b). When we increase the thickness, the microwave absorption becomes poor. By contrast, the microwave absorption of NiFe2O4/carbon fibers is evidently improved, as seen in Fig. 7c and d. For NiFe2O4/CCF-1, when the thickness is 2 mm, the minimum RL is as low as −55.8 dB, and the effective bandwidth achieves 4.5 GHz (from 13.5 to 18 GHz). When the matching thickness is 2.4 mm, the effective bandwidth can reach up to 5.8 GHz (from 10.9 to 16.7 GHz). For NiFe2O4/CCF-2, when the thickness is 2 mm, the minimum RL is −42.8 dB. When the matching thickness is 2.4 mm, the effective bandwidth can reach up to 6.5 GHz (11.5–18 GHz), which covers the entire Ku-band (12–18 GHz). Even more interesting is the fact that when increasing the matching thickness to 3.2 mm, the optimal microwave absorption values less than −10 dB are in the range of 8.0–12.7 GHz, which covers the entire X-band (8–12 GHz). Therefore, the microwave absorption value less than −10 dB of NiFe2O4/CCF-2 can cover both X-band and Ku-band at a certain thickness. For comparison, the microwave absorption performances of some reported absorbents were shown in Table 1. It is clear that the NiFe2O4/carbon fibers exhibit relatively wider effective bandwidth and lower RL value compared with other microwave absorbents such as NiFe2O4 hollow particle/graphene,32 NiFe2O4/polypyrrole,33 and NiFe2O4/polypyrrole.34 Moreover, the effective bandwidth of 6.5 GHz of NiFe2O4/carbon fibers is larger than the other reported carbon-based MAMs.35–38 Overall, the MAMs based on NiFe2O4/carbon fiber shave the advantages of low cost, low density, low filling rate, strong microwave absorption, and wide absorption bandwidth, so they can meet the demand of practical application.
 | ||
| Fig. 7 Frequency dependence of the reflection loss curves for (a) NiFe2O4, (b) CCF, (c) NiFe2O4/CCF-1, and (d) NiFe2O4/CCF-2 with different thicknesses. | ||
| Sample | Filling rate (wt%) | Effective bandwidth (GHz) | Minimal reflection loss value (dB) | Ref. |
|---|---|---|---|---|
| NiFe2O4 hollow particle/graphene | 15 | 4.5 | −40.9 | 32 |
| NiFe2O4/polypyrrole | 30 | 4.5 | −42.0 | 33 |
| RGO–PANI–NiFe2O4 | 30 | 5.3 | −49.7 | 34 |
| Fe3O4/carbon nanocoils | 25 | 3.5 | −28.3 | 35 |
| Nickel/carbon nanocomposites | 25 | 4.4 | −21.2 | 36 |
| MOF-derived porous Co/C nanocomposites | 60 | 5.8 | −35.3 | 37 |
| CoFe2O4/graphene | 60 | 3.7 | −24.7 | 38 |
| Ferrite/Co/porous carbon | 70 | 4.8 | −31.0 | 11 |
| NiFe2O4/C fibers | 25 | 6.5 | −55.8 | This work |
In view of the electromagnetic energy conversion principle, the impedance matching and electromagnetic loss are two crucial factors affecting the microwave absorption performance of absorbent.39,40 The impedance matching is determined by the relative complex permittivity and relative complex permeability. The electromagnetic loss is directly related with the dielectric loss factor (tan![[thin space (1/6-em)]](https://www.rsc.org/images/entities/char_2009.gif) δe) and magnetic loss factor (tan
δe) and magnetic loss factor (tan![[thin space (1/6-em)]](https://www.rsc.org/images/entities/char_2009.gif) δm), which can be expressed as tan
δm), which can be expressed as tan![[thin space (1/6-em)]](https://www.rsc.org/images/entities/char_2009.gif) δe = ε′′/ε′ and tan
δe = ε′′/ε′ and tan![[thin space (1/6-em)]](https://www.rsc.org/images/entities/char_2009.gif) δm = μ′′/μ′, respectively. However, the dielectric loss and impedance matching are usually contradicted each other.38 The carbon materials have excellent conductivity which enhance dielectric loss but decrease the impedance matching due to strong reflection. Introduction of magnetic nanoparticles can not only increase magnetic loss, but also strengthen impedance matching. Fig. 8 shows the frequency dependence of the dielectric loss factor and magnetic loss factor for NiFe2O4, CCF, NiFe2O4/CCF-1, and NiFe2O4/CCF-2. It is remarkable that the tan
δm = μ′′/μ′, respectively. However, the dielectric loss and impedance matching are usually contradicted each other.38 The carbon materials have excellent conductivity which enhance dielectric loss but decrease the impedance matching due to strong reflection. Introduction of magnetic nanoparticles can not only increase magnetic loss, but also strengthen impedance matching. Fig. 8 shows the frequency dependence of the dielectric loss factor and magnetic loss factor for NiFe2O4, CCF, NiFe2O4/CCF-1, and NiFe2O4/CCF-2. It is remarkable that the tan![[thin space (1/6-em)]](https://www.rsc.org/images/entities/char_2009.gif) δe and tan
δe and tan![[thin space (1/6-em)]](https://www.rsc.org/images/entities/char_2009.gif) δm show the opposite trend in the frequency range of 2–18 GHz. This can be attributed to the coupling of the dielectric behavior and magnetic behavior.41 From Fig. 8a, it is obvious that the tan
δm show the opposite trend in the frequency range of 2–18 GHz. This can be attributed to the coupling of the dielectric behavior and magnetic behavior.41 From Fig. 8a, it is obvious that the tan![[thin space (1/6-em)]](https://www.rsc.org/images/entities/char_2009.gif) δe of CCF is higher than that of NiFe2O4/carbon fibers and NiFe2O4 nanoparticles in the range of 2–18 GHz, showing strong dielectric loss. As depicted in Fig. 8b, the tan
δe of CCF is higher than that of NiFe2O4/carbon fibers and NiFe2O4 nanoparticles in the range of 2–18 GHz, showing strong dielectric loss. As depicted in Fig. 8b, the tan![[thin space (1/6-em)]](https://www.rsc.org/images/entities/char_2009.gif) δm follows the order of NiFe2O4 > NiFe2O4/CCF-2 > NiFe2O4/CCF-1 > CCF in the frequency range of 2–18 GHz, which is consistent with the content of NiFe2O4 nanoparticles. For NiFe2O4 nanoparticles, the low tan
δm follows the order of NiFe2O4 > NiFe2O4/CCF-2 > NiFe2O4/CCF-1 > CCF in the frequency range of 2–18 GHz, which is consistent with the content of NiFe2O4 nanoparticles. For NiFe2O4 nanoparticles, the low tan![[thin space (1/6-em)]](https://www.rsc.org/images/entities/char_2009.gif) δe and tan
δe and tan![[thin space (1/6-em)]](https://www.rsc.org/images/entities/char_2009.gif) δm mean weak electromagnetic loss, leading to weak microwave absorption. For CCF, the low tan
δm mean weak electromagnetic loss, leading to weak microwave absorption. For CCF, the low tan![[thin space (1/6-em)]](https://www.rsc.org/images/entities/char_2009.gif) δm indicates weak magnetic loss. Although it has high dielectric loss, the high permittivity of CCF is harmful to the impedance matching and could lead to strong reflection and weak microwave absorption. Therefore, due to the reasonable permittivity, high electromagnetic loss, and good impedance matching, a superior microwave absorption performance was obtained for NiFe2O4/carbon fibers. In addition, the tan
δm indicates weak magnetic loss. Although it has high dielectric loss, the high permittivity of CCF is harmful to the impedance matching and could lead to strong reflection and weak microwave absorption. Therefore, due to the reasonable permittivity, high electromagnetic loss, and good impedance matching, a superior microwave absorption performance was obtained for NiFe2O4/carbon fibers. In addition, the tan![[thin space (1/6-em)]](https://www.rsc.org/images/entities/char_2009.gif) δe and tan
δe and tan![[thin space (1/6-em)]](https://www.rsc.org/images/entities/char_2009.gif) δm of NiFe2O4/CCF-2 are a little higher than that of NiFe2O4/CCF-1, exhibiting improved microwave absorption performance.
δm of NiFe2O4/CCF-2 are a little higher than that of NiFe2O4/CCF-1, exhibiting improved microwave absorption performance.
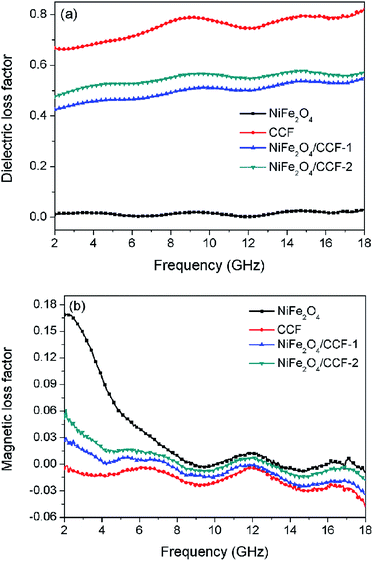 | ||
Fig. 8 Frequency dependence of (a) dielectric loss factor (tan![[thin space (1/6-em)]](https://www.rsc.org/images/entities/char_2009.gif) δe), and (b) magnetic loss factor (tan δe), and (b) magnetic loss factor (tan![[thin space (1/6-em)]](https://www.rsc.org/images/entities/char_2009.gif) δm) for NiFe2O4, CCF, NiFe2O4/CCF-1, and NiFe2O4/CCF-2. δm) for NiFe2O4, CCF, NiFe2O4/CCF-1, and NiFe2O4/CCF-2. | ||
4. Conclusions
In conclusion, NiFe2O4/carbon fibers were successfully fabricated through the calcination of cotton and the subsequent hydrothermal synthesis. Resulting from the high dielectric loss, magnetic loss, and good impedance matching, the synthesized NiFe2O4/carbon fibers exhibited excellent microwave absorption performance. The minimum RL value reached −55.8 dB, and the microwave absorption value less than −10 dB can cover both X-band and Ku-band. In addition, the synthetic route was simple, low-cost and suitable for mass production because cotton was used as carbon source. These results demonstrated the potential of NiFe2O4/carbon fibers as a novel broadband microwave absorbent, and may offer a new way to design cheap, lightweight and highly efficient microwave absorbing materials.Conflicts of interest
There are no conflicts to declare.Acknowledgements
This work was supported by the Scientific and Technological Innovation Programs of Higher Education Institutions in Shanxi, the fund for Shanxi “1331 Project” Key Innovative Research Team (PY201817) and Jinzhong University “1331 Project” Key Innovative Research Team (jzxycxtd2017004).References
- H. B. Zhao, Z. B. Fu, H. B. Chen, M. L. Zhong and C. Y. Wang, ACS Appl. Mater. Interfaces, 2016, 8, 1468–1477 CrossRef CAS PubMed.
- H. Sun, R. C. Che, X. You, Y. S. Jiang, Z. B. Yang, J. Deng, L. B. Qiu and H. S. Peng, Adv. Mater., 2014, 26, 8120–8125 CrossRef CAS PubMed.
- W. J. Ruan, C. P. Mu, B. C. Wang, A. M. Nie, C. Zhang, X. Du, J. Y. Xiang, F. S. Wen and Z. Y. Liu, Nanotechnology, 2018, 29, 405703 CrossRef PubMed.
- J. Y. Fang, T. Liu, Z. Chen, Y. Wang, W. Wei, X. G. Yue and Z. H. Jiang, Nanoscale, 2016, 8, 8899–8909 RSC.
- D. W. Liu, R. Qiang, Y. C. Du, Y. Wang, C. H. Tian and X. J. Han, J. Colloid Interface Sci., 2018, 514, 10–20 CrossRef CAS PubMed.
- F. Y. Wang, N. Wang, X. J. Han, D. W. Liu, Y. H. Wang, L. R. Cui, P. Xu and Y. C. Du, Carbon, 2019, 145, 701–711 CrossRef CAS.
- T. Wang, H. D. Wang, X. Chi, R. Li and J. B. Wang, Carbon, 2014, 74, 312–318 CrossRef CAS.
- N. Li, G. W. Huang, Y. Q. Li, H. M. Xiao, Q. P. Feng, N. Hu and S. Y. Fu, ACS Appl. Mater. Interfaces, 2017, 9, 2973–2983 CrossRef CAS PubMed.
- Z. Xu, Y. C. Du, D. W. Liu, Y. H. Wang, W. J. Ma, Y. Wang, P. Xu and X. J. Han, ACS Appl. Mater. Interfaces, 2019, 11, 4268–4277 CrossRef CAS PubMed.
- G. Z. Wang, Z. Gao, G. P. Wan, S. W. Lin, P. Yang and Y. Qin, Nano Res., 2014, 7, 704–716 CrossRef CAS.
- L. X. Wang, Y. K. Guan, X. Qiu, H. L. Zhu, S. B. Pan, M. X. Yuand and Q. T. Zhang, Chem. Eng. J., 2017, 326, 945–955 CrossRef CAS.
- Y. H. Chen, Z. H. Huang, M. M. Lu, W. Q. Cao, J. Yuan, D. Q. Zhang and M. S. Cao, J. Mater. Chem. A, 2015, 3, 12621–12625 RSC.
- X. M. Zhang, G. B. Ji, W. Liu, B. Quan, X. H. Liang, C. M. Shang, Y. Cheng and Y. W. Du, Nanoscale, 2015, 7, 12932–12942 RSC.
- Q. Xu, L. X. Wang, H. L. Zhu, Y. K. Guan and Q. T. Zhang, Nanoscale, 2017, 9, 7408–7418 RSC.
- C. Wei, J. L. Yu, X. Q. Yang and G. Q. Zhang, Nanoscale Res. Lett., 2017, 12, 379 CrossRef PubMed.
- Y. Zhang, S. S. Liu, X. Y. Zheng, X. Wang, Y. Xu, H. Q. Tang, F. Y. Kang, Q. H. Yang and J. Y. Luo, Adv. Funct. Mater., 2017, 27, 1604687 CrossRef.
- H. C. Bi, Z. Y. Yin, X. H. Cao, X. Xie, C. L. Tan, X. Huang, B. Chen, F. T. Chen, Q. L. Yang, X. Y. Bu, X. H. Lu, L. T. Sun and H. Zhang, Adv. Mater., 2013, 25, 5916–5921 CrossRef CAS PubMed.
- H. Q. Zhao, Y. Cheng, J. N. Ma, Y. N. Zhang, G. B. Ji and Y. W. Du, Chem. Eng. J., 2018, 339, 432–441 CrossRef CAS.
- W. X. Li, H. X. Qi, F. Guo, Y. E. Du, N. J. Song, Y. Y. Liu and Y. Q. Chen, J. Alloys Compd., 2019, 772, 760–769 CrossRef CAS.
- K. C. Zhang, X. B. Gao, Q. Zhang, T. P. Li, H. Chen and X. F. Chen, J. Alloys Compd., 2017, 721, 268–275 CrossRef CAS.
- X. Gu, W. M. Zhu, C. G. Jia, R. Zhao, W. Schmidt and Y. Q. Wang, Chem. Commun., 2011, 47, 5337–5339 RSC.
- Y. C. Du, W. W. Liu, R. Qing, Y. Wang, X. J. Han, J. Ma and P. Xu, ACS Appl. Mater. Interfaces, 2014, 6, 12997–13006 CrossRef CAS PubMed.
- Q. C. Meng, Transmission Electron Microscopy, Harbin Institute of Technology Press, Harbin, 1998, pp. 11–12 Search PubMed.
- D. Ding, Y. Wang, X. D. Li, R. Qiang, P. Xu, W. L. Chu, X. J. Han and Y. C. Du, Carbon, 2017, 111, 722–732 CrossRef CAS.
- Y. Cheng, G. B. Ji, Z. Y. Li, H. L. Lv, W. Liu, Y. Zhao, J. M. Cao and Y. W. Du, J. Alloys Compd., 2017, 704, 289–295 CrossRef CAS.
- J. G. Jia, C. Y. Liu, N. Ma, G. R. Han, W. J. Weng and P. Y. Du, Sci. Technol. Adv. Mater., 2013, 14, 045002 CrossRef PubMed.
- S. C. Chiu, H. C. Yu and Y. Y. Li, J. Phys. Chem. C, 2010, 114, 1947–1952 CrossRef CAS.
- K. F. Wang, Y. J. Chen, R. Tian, H. Li, Y. Zhou, H. N. Duan and H. Z. Liu, ACS Appl. Mater. Interfaces, 2018, 10, 11333–11342 CrossRef CAS PubMed.
- Y. Zhang, Y. Huang, H. H. Chen, Z. Y. Huang, Y. Yang, P. S. Xiao, Y. Zhou and Y. S. Chen, Carbon, 2016, 105, 438–447 CrossRef CAS.
- C. P. Mu, J. F. Song, B. C. Wang, C. Zhang, J. Y. Xiang, F. S. Wen and Z. Y. Liu, Nanotechnology, 2018, 29, 025704 CrossRef PubMed.
- L. J. Deng and M. G. Han, Appl. Phys. Lett., 2007, 91, 023119 CrossRef.
- F. Yan, D. Guo, S. Zhang, C. Li, C. Zhu, X. Zhang and Y. Chen, Nanoscale, 2018, 10, 2697–2703 RSC.
- Z. T. Li, M. Q. Ye, A. J. Han and H. Du, J. Mater. Sci.: Mater. Electron., 2016, 27, 1031–1043 CrossRef CAS.
- J. Yan, Y. Huang, X. F. Chen and C. Wei, Synth. Met., 2016, 221, 291–298 CrossRef CAS.
- G. Z. Wang, Z. Gao, S. W. Tang, C. Q. Chen, F. F. Duan, S. C. Zhao, S. W. Lin, Y. H. Feng, L. Zhou and Y. Qin, ACS Nano, 2012, 6, 11009–11017 CrossRef CAS PubMed.
- P. T. Xie, H. Y. Li, B. He, F. Dang, J. Lin, R. H. Fan, C. X. Hou, H. Liu, J. X. Zhang, Y. Ma and Z. H. Guo, J. Mater. Chem. C, 2018, 6, 8812–8822 RSC.
- Y. Y. Lü, Y. T. Wang, H. L. Li, Y. Lin, Z. Y. Jiang, Z. X. Xie, Q. Kuang and L. S. Zheng, ACS Appl. Mater. Interfaces, 2015, 7, 13604–13611 CrossRef PubMed.
- M. Fu, Q. Z. Jiao, Y. Zhao and H. S. Li, J. Mater. Chem. A, 2014, 2, 735–744 RSC.
- Y. J. Chen, G. Xiao, T. S. Wang, Q. Y. Ouyang, L. H. Qi, Y. Ma, P. Gao, C. L. Zhu, M. S. Cao and H. B. Jin, J. Phys. Chem. C, 2011, 115, 13603–13608 CrossRef CAS.
- R. Qiang, Y. C. Du, H. T. Zhao, Y. Wang, C. H. Tian, Z. G. Li, X. J. Han and P. Xu, J. Mater. Chem. A, 2015, 3, 13426–13434 RSC.
- L. Zhen, J. T. Jiang, W. Z. Shao and C. Y. Xu, Appl. Phys. Lett., 2007, 90, 142907 CrossRef.
| This journal is © The Royal Society of Chemistry 2019 |

