
 Open Access Article
 This Open Access Article is licensed under a Creative Commons Attribution-Non Commercial 3.0 Unported Licence
Ultrathin nickel-metal–organic framework nanobelt based electrochemical sensor for the determination of urea in human body fluids†
Cancan Baoa,
Qiangqiang Niua,
Zi-Ang Chena,
Xiaowei Cao b,
Hui Wanga and
Wenbo Lu*a
b,
Hui Wanga and
Wenbo Lu*a
aKey Laboratory of Magnetic Molecules and Magnetic Information Materials (Ministry of Education), School of Chemistry and Material Science, Shanxi Normal University, Linfen 041004, China. E-mail: luwb@sxnu.edu.cn; Fax: +86-357-2051192; Tel: +86-357-2051192
bInstitute of Translational Medicine, Medical College, Yangzhou University, Yangzhou 225001, China
First published on 18th September 2019
Abstract
Ultrathin nickel-metal–organic framework (Ni-MOF) nanobelts, [Ni20(C5H6O4)20(H2O)8]·40H2O (Ni-MIL-77), have been exploited successfully for the fabrication of a non-enzymatic urea sensor. Ni-MOF ultrathin nanobelts in alkaline media can be used as an efficient catalyst for urea electrooxidation. As a non-enzymatic urea sensor, Ni-MOF ultrathin nanobelts exhibit a high sensitivity of 118.77 μA mM−1 cm−2, wide linear range of 0.01–7.0 mM, and low detection limit of 2.23 μM (S/N = 3). The selectivity, stability and reliability of ultrathin Ni-MOF nanobelts towards urea oxidation are also investigated. Moreover, Ni-MOF ultrathin nanobelts were further used to detect urea in human body fluids. All these findings confirm that the urea sensor based on Ni-MOF ultrathin nanobelts is successfully prepared and promising for applications in medical diagnostics and environmental monitoring.
Introduction
Urea is one of the primary products of protein degradation and metabolism of nitrogen containing compounds.1 The amount of urea present in human body fluids (such as blood and urine) exceeds a certain level, which can cause damage to kidney or liver of mankind.2 If the kidneys or livers are not working properly, the concentration of urea will be abnormal in the body fluids.3 Abnormal levels of urea in human body fluids cause kidney or hepatic failure, nephritic syndrome and urinary tract obstruction.4 Furthermore, urea in industrial waste water is washed out in the environment, which can pollute the surface and the ground water.5,6 Accordingly, it is essential to monitor urea levels in the human body fluids, environment, and drinking water.Metal–organic frameworks (MOFs) have some advantages, such as high surface area and tuneable chemical structures.7 Nickel-based nanomaterials have been extensively applied for the direct electrocatalytic oxidation of biochemical molecules.8,9 The electrocatalytic performance of the nickel-based catalysts has been further improved by preparing various nano-structures such as nanoparticles,10 nanorods,11 nanowires,12 and three-dimensional networks.13,14 Nickel-based metal–organic frameworks (Ni-MOFs) have generated a large amount of interest because of their excellent structural and electrocatalytic properties.13 In particular, Ni-MOF based catalysts have exhibited excellent catalytic abilities for urea oxidation.15,16 However, few reports are available on the detection of urea by Ni-MOFs. Recently, Yoon's group synthesized Ni-MOF microparticle and multiwalled carbon nanotube composites for urea detection.17 Ni-MOF microparticles with a diameter of 1.2 μm are too big to avoid many shortcomings.17 As a result, it is very necessary to develop a new class of Ni-MOF nanomaterials for the detection of urea. Ni-MOF nanobelts possess a rectangular area on each ribbon strip, which exhibit high electrocatalytic activity because of large surface-to-volume ratio and highly active surface.17 As far as we know, Ni-MOF nanobelts for the determination of urea have not yet been reported.
For the first time, we describe our finding that Ni-MOF ultrathin nanobelts, [Ni20(C5H6O4)20(H2O)8]·40H2O (Ni-MIL-77), in alkaline media can be used as an efficient catalyst for urea electrooxidation, as shown in this article. As a non-enzymatic urea sensor, Ni-MOF ultrathin nanobelts exhibit superior urea sensing performances, such as broad detection range, low detection limit and high selectivity. Moreover, the detection of urea in human body fluids has been further explored for the sensing performance of Ni-MOFs ultrathin nanobelts.
Results and discussion
Physical characterization
The morphology and structure of Ni-MOF ultrathin nanobelts (the Ni-MOF nanobelts are synthesised by a hydrothermal method using nickel acetate and glutaric acid as main raw materials, and the relevant experimental procedure is shown in the ESI†) have been explored by scanning electron microscopy (SEM), transmission electron microscopy (TEM) and other characterization methods. The phase purity and crystallographic structure of the experimental product was characterized by XRD. As shown in Fig. S1† (before and after electrochemical testing), the peak intensity is stronger before electrochemical testing. However, the crystal plane of XRD did not change after electrochemical testing. Therefore, we can draw the conclusion that the two compounds before and after testing are the same substance, and the structure of Ni-MOF nanobelts is stable.Fig. 1A shows the SEM images of Ni-MOF and reveals the formation of ultrathin nanobelts. The nanobelt structure can be further observed clearly in the inset of Fig. 1A. In addition, the SEM of Ni-MOF is also characterized after a long-term detection of 1 mM urea in 0.1 M KOH as displayed in Fig. S2.† It can be seen that the morphology of Ni-MOF nanobelts has not changed substantially after long time detection, and its original nanobelt morphology is basically maintained. It again confirms the stability of Ni-MOF nanobelts. Fig. 1B exhibits the TEM images of Ni-MOFs from which we can achieve a deeper understanding of the structure of ultrathin nanobelts. The energy-dispersive X-ray (EDX) spectrum exhibits the rational elemental presence of Ni, C and O existing in the composites, which demonstrates that no impurity substance exists in the Ni-MOF nanobelts (Fig. 1C). The Fourier transform infrared (FT-IR) spectrum of the Ni-MOFs is revealed in Fig. 1D. The intensive and broad peak located at 3425 cm−1 is attributable to the stretching mode of the hydroxyl group (O–H) coupled to Ni(II), and the peaks located at 1309 cm−1, 1453 cm−1 and 1413 cm−1 represent the C–H bond vibrations. Moreover, an intensive band lies at 1606 cm−1 because of the representative pattern of alkene (C![[double bond, length as m-dash]](https://www.rsc.org/images/entities/char_e001.gif) C). Above results are consistent with the literature.18 The formation of Ni-MOFs is confirmed mediately indirectly by FT-IR spectroscopy. We can identify the fundamental form and composition of functional groups of Ni-MOFs through X-ray photoelectron spectroscopy (XPS). As shown in Fig. 1E, the survey of XPS shows distinct peaks located at 856.6 eV (Ni 2p3), 530.64 eV (O 1s) and 283.1 eV (C 1s), separately, demonstrating that Ni-MOFs have been successfully synthesized. A series of visible peaks of Ni 2p region spectra can be viewed in Fig. 1F. Two peaks at ca. 856.32 and 873.65 eV are assigned to Ni 2p1/2 and Ni 2p3/2, respectively.19,20 Moreover, the broad peaks at 861.69 eV and 879.9 eV represent the satellite peaks of Ni 2p1/2 and Ni 2p3/2, respectively.21 The results received from the Ni 2p spectra testified the fact that nickel ions consisted in the prepared Ni-MOFs are present in the form of Ni(II). When compared before and after urea electrooxidation in alkaline medium, it can be seen that the valence and peak position of Ni 2p regions on Ni-MOF nanobelts has not changed substantially after a long-term detection. It again demonstrates that the structure of Ni-MOF nanobelts is stable. In conclusion, all of the above characterizations confirm that the Ni-MOF nanobelts have been prepared successfully.
C). Above results are consistent with the literature.18 The formation of Ni-MOFs is confirmed mediately indirectly by FT-IR spectroscopy. We can identify the fundamental form and composition of functional groups of Ni-MOFs through X-ray photoelectron spectroscopy (XPS). As shown in Fig. 1E, the survey of XPS shows distinct peaks located at 856.6 eV (Ni 2p3), 530.64 eV (O 1s) and 283.1 eV (C 1s), separately, demonstrating that Ni-MOFs have been successfully synthesized. A series of visible peaks of Ni 2p region spectra can be viewed in Fig. 1F. Two peaks at ca. 856.32 and 873.65 eV are assigned to Ni 2p1/2 and Ni 2p3/2, respectively.19,20 Moreover, the broad peaks at 861.69 eV and 879.9 eV represent the satellite peaks of Ni 2p1/2 and Ni 2p3/2, respectively.21 The results received from the Ni 2p spectra testified the fact that nickel ions consisted in the prepared Ni-MOFs are present in the form of Ni(II). When compared before and after urea electrooxidation in alkaline medium, it can be seen that the valence and peak position of Ni 2p regions on Ni-MOF nanobelts has not changed substantially after a long-term detection. It again demonstrates that the structure of Ni-MOF nanobelts is stable. In conclusion, all of the above characterizations confirm that the Ni-MOF nanobelts have been prepared successfully.
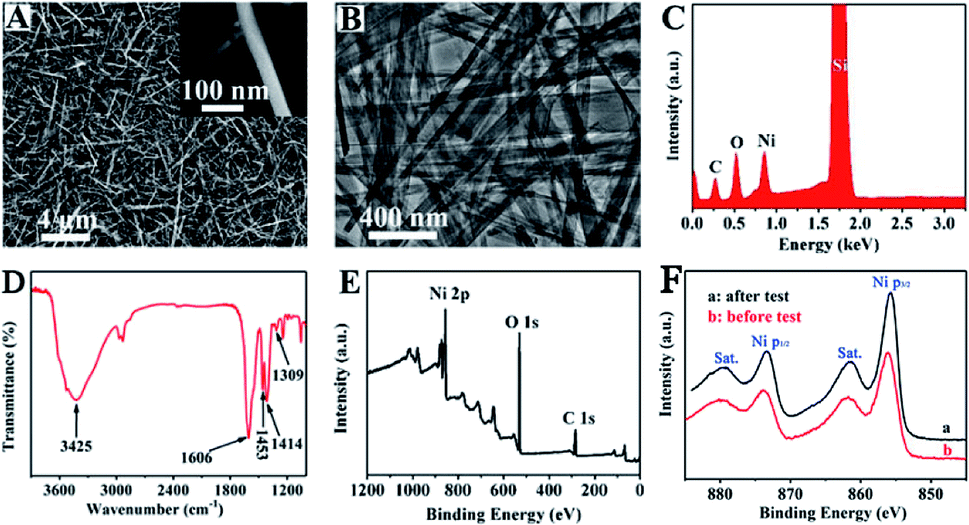 | ||
| Fig. 1 Low (A) and high (the inset) magnification SEM images of Ni-MOFs; (B) TEM image of Ni-MOFs; (C) EDX spectrum of Ni-MOFs; (D) FT-IR spectrum of Ni-MOFs; XPS patterns of survey (E) and Ni 2p regions before and after testing (F) on the Ni-MOFs. | ||
Electrochemical behaviors towards urea
To estimate the electrocatalytic property of the Ni-MOF ultrathin nanobelts toward urea, cyclic voltammetric (CV) tests of GCE, Nafion/GCE and Ni-MOF/Nafion/GCE are carried out with and without 1.0 mM urea (scan speed: 50 mV s−1). All electrooxidation behaviors of urea on the Ni-MOF/Nafion/GCE electrode in this experiment are studied in 0.1 M KOH electrolyte. As displayed in Fig. 2, a couple of characteristic redox peaks turned up immediately when the GCE surface was modified with Ni-MOF nanobelts (curve a and b); in comparison, bare GCE and Nafion/GCE show no typical peak with 1.0 mM urea (curve c and d). From the CV diagram, we can see that there is no typical redox peak (curve d), indicating that bare GCE has no catalytic performance towards urea. After modifying Nafion to the surface of GCE, there is almost no change in current, manifesting that Nafion acts only as a mediator for the transport of electrons and immobilization.22,23 On the other hand, it can be also discovered that there is a significant oxidation peak corresponding to the anode at about 0.60 V, which is attributed to the reason that Ni(II) can be rapidly converted to Ni(III) in presence of large number of OH− anions. And the result is accordant with the literature.17 At the cathode, however, a visible reduction peak appears at about 0.30 V, which can be considered as a process in which Ni(III) is reduced to Ni(II), where the process occurs opposite to the anode. At the same time, the peak current response heightens conspicuously in the anode and weakens in the cathode when 1.0 mM urea was injected (curve a). The above detecting results demonstrate that Ni-MOF nanobelts possess an excellent electro-catalytic oxidation property towards urea. The above electrochemical behaviours are in accordance with the characteristic catalytic regeneration (EC' mechanism).24 Based on theory, urea is chemically oxidized to corresponding substances accompanied with the process of Ni(III) reduction to Ni(II), and the electrochemical regeneration of Ni(II) to Ni(III) occurs simultaneously. In other words, it's the following redox transition process: Ni(II) ⇄ Ni(III). The regeneration of Ni(III) catalytic agents leads to the disappearance of invertibility and heightens the peak intensity of Ni(III)/Ni(II) with the addition of urea.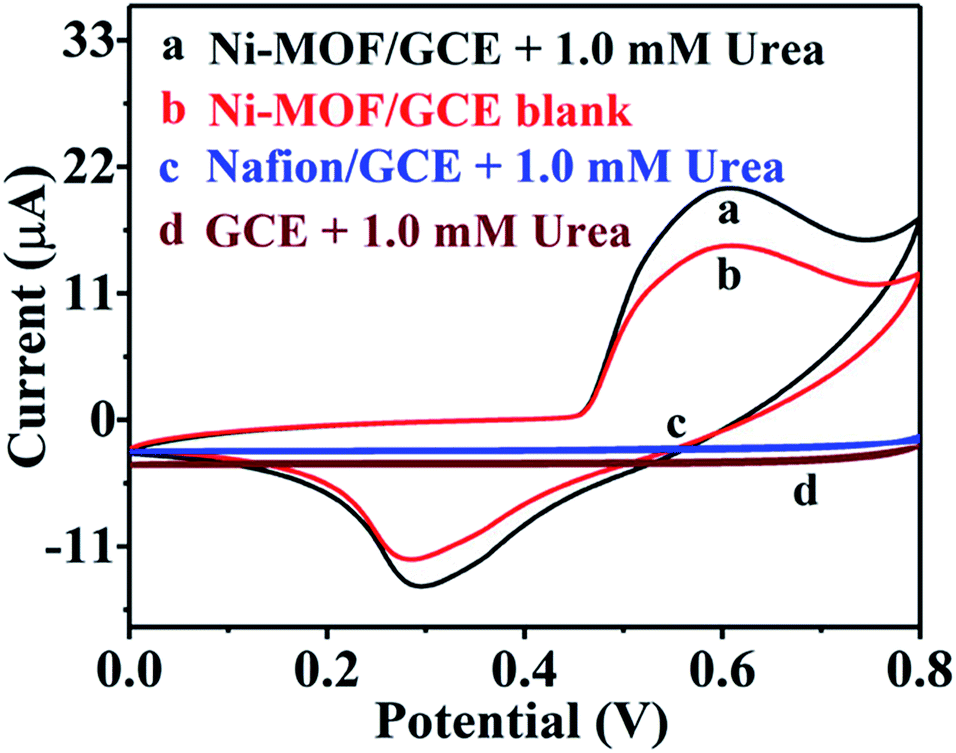 | ||
| Fig. 2 Cyclic voltammograms of Ni-MOF/Nafion/GCE (curves a and b), Nafion/GCE (curve c) and GCE (curve d) electrodes with (curves a, c and d) and without (curve b) 1.0 mM urea in 0.1 M KOH solution. Scan speed: 50 mV s−1. | ||
It has been reported that a cost-effective nickel-based catalyst can convert urea into non-poisonous and harmless nitrogen gas products under alkaline conditions by electro-oxidation,25 and the electrocatalytic process of this material towards urea may occur as follows:8,17,20,26
| Ni(II)-MOF → Ni(III)-MOF + e− | (1) |
| Ni(III)-MOF + CO(NH2)2 + 6OH−→ Ni(II)-MOF + N2 + 5H2O + CO2 + 6e− | (2) |
The above equations manifest that Ni(II) could be rapidly oxidized into active Ni(III) in an alkaline environment, which promotes the electrocatalytic oxidation procedure of urea.21
The structure of Ni-MOF is [Ni20(C5H6O4)20(H2O)8]·40H2O. It can be seen that the ligand C5H6O4 is connected to Ni successively, and finally forms a series of nanobelt tunnels. When urea is added, it is absorbed on the Ni-MOF nanobelts. Under a certain voltage, urea undergoes an electrooxidation process in the Ni-MOF nanobelt tunnel. In the tunnel, Ni(II) could be rapidly oxidized into active Ni(III) under alkaline conditions, and the urea was oxidized into N2, CO2 and H2O.
Furthermore, we studied the kinetic parameters of the process through a series of electroanalytical measurement techniques, including cyclic voltammetry (CV), linear sweep voltammetry (LSV), differential pulse voltammetry (DPV) and amperometric response curve (I–T).
Evaluation of electrochemical performances
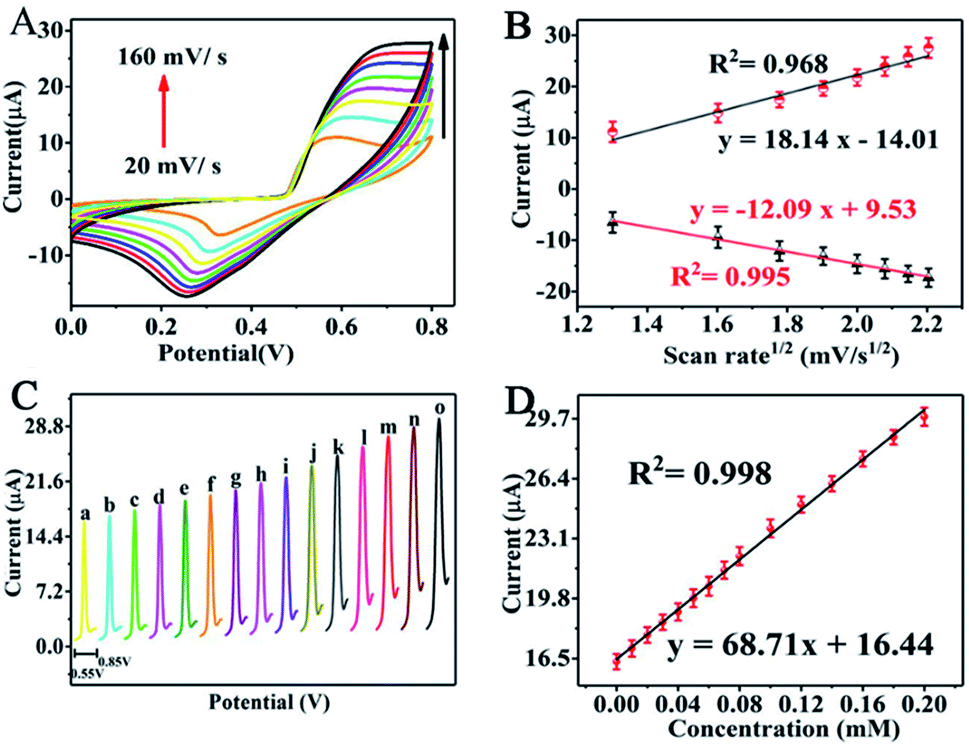 | ||
| Fig. 3 (A) CVs of the Ni-MOF/Nafion/GCE electrode with 1.0 mM urea at distinct scan speeds: 20, 40, 60, 80, 100, 120, 140, 160 mV s−1. (B) The plot of variation of anode and cathode peak currents with scanning rate. (C) DPV of the Ni-MOF/Nafion/GCE electrode at variant urea concentrations: 0–0.2 mM. Test factors: amplitude 0.05 V, pulse cycle time 0.2 s and impulse duration 0.05 s. (D) The correlation of associated response vs. the concentration. | ||
Moreover, the distance (ΔEp) between the peak potential of anode (Epa) and cathode (Epc) moves further away from each other ranging from about 248 mV to 449 mV. The reason why the oxidation potential moves in the positive direction may be due to the extraordinary sorption to urea at the position of Ni(III).27 Meanwhile, we can also observe that the peak signal response ratios (Ipc/Ipa) between the cathode and the anode are explicitly departed from 1, and the peak potential discrepancy (ΔEp) is larger than 0.059/n, manifesting the quasi-reversibility of the redox reaction.
On the other hand, there is a logarithmic relationship between the oxidation peak potential (Epa) and sweep rate. The linear relationship (Fig. S3†) between Epa and log![[thin space (1/6-em)]](https://www.rsc.org/images/entities/char_2009.gif) v can be demonstrated as follows:
v can be demonstrated as follows:
| Epa (V) = 0.794 + 0.136logv (V s−1), (R2 = 0.983) |
The electron transfer coefficient (α) can be obtained from the inferior formula between Epa and logv:17
According to the slope of Fig. S3,† α can be figured out as 0.45. The transferred electrons (n) are calculated to be close to 6. This indicates that 6 electrons are transferred on the anode during the electrochemical oxidation of urea. The total reaction is as follows:
| CO(NH2)2 + 6OH− → N2 + 5H2O + CO2 + 6e− | (3) |
| I (μA) = 16.44 + 68.71C (mmol L−1), (R2 = 0.998) |
The DPV measurements manifest that the electrooxidation course keeping accordance with the switch from Ni(II) to Ni(III) is affected by the increasing concentration of urea and it is simultaneously electro-oxidized to nitrogen gas in this process.25
 | ||
| Fig. 4 LSV curves of the Ni-MOF/Nafion/GCE electrode at varying urea concentrations rang of 0–8 mM in the potential of 0.2–0.8 V. Inset: Mutual coherence of anode peak current responses vs. the variable concentrations. | ||
Amperometric response of urea
The electrocatalytic capacity of urea is discriminatory with different amperometric response to 0.2 mM urea being injected into 0.1 M KOH consecutively, under the distinct potentials (0.50, 0.55, 060 and 0.65 V, respectively), as displayed in Fig. S5A.† Fig. S5B† indicates the linear relationship between the peak current and the corresponding concentration at distinct potentials. We can conclude that the potential of +0.60 V was chosen as the most favorable potential because of the highest response.The performance of the Ni-MOF/Nafion/GCE electrode as a urea sensor is evaluated by I–T measurements at an oxidation peak potential of +0.6 V vs. Ag/AgCl. As shown in Fig. 5A, the oxidation peak current heightens instantly and arrives at a plateau in about 10 seconds after the addition of urea solution each time. A calibration curve plot of the oxidation peak current response to the urea concentration is presented in the Fig. 5B. Dependency of the oxidation peak current on urea concentration (0.01–1.0 mM) is linear with a regression equation of Ipa (μA) = 1.08 + 3.74C (mM), and the R2 is 0.992. When the urea concentration is more than 1.0 mM, the linear analysis chart is presented in Fig. S6.† Dependency of the oxidation peak current on urea concentration (1.0–7.0 mM) is linear with a regression equation of Ipa (μA) = 4.11 + 0.893C (mM), and the R2 is 0.956. The Ni-MOF/Nafion/GCE electrode exhibits a sensitivity of 118.77 μA mM−1 cm−2. And the lowest detection limit obtained is 2.23 μM with S/N = 3, as calculated from the slope of the above linear calibration. Compared to earlier urea sensors including NiO and other electrodes (Table 1), this Ni-MOF nonenzymatic sensor exhibited a series of great performance, such as super sensitivity, wider linear range, and even lower detection limit.
 | ||
| Fig. 5 (A) Amperometric i–t curve for unceasing additions of urea into the electrolyte solution at oxidation peak potential of +0.6 V. (B) The calibration curve is shown about Ipa (μA) and C (mM). | ||
| Electrode material | Linear range (mM) | LOD (μM) | Sensitivity μA mM−1 cm−2 | Ref. |
|---|---|---|---|---|
| Rh/urease | 0.1–1.75 | 50 | 1.85 | 28 |
| 3D-graphene/NiCo2O4 | 0.06–0.30 | 5 | 166 | 17 |
| Ni-MOF/MWCNT | 0.01 × 10⁻³ to 1.12 × 10⁻³ | 6 | 685.1 | 8 |
| NiO/cellulose/CNT | 0.01–1.4 | 7 | 371 | 27 |
| Graphene-PANi/GCE | 0.01–0.2 | 5.88 | 226.9 | 29 |
| Vitamin C based NiO | 0.1–1.1 | 10 | — | 30 |
| NiO-NPs/urease | 0.83–16.65 | 830 | 21.3 | 1 |
| NiO/CTAB/GO/GCE | 0.1–1.2 | 8 | — | 31 |
| Ni-MOF/Nafion/GCE | 0.01–7 | 2.719 | 118.77 | This work |
Selectivity, long-term stability and repeatability assay
To assess the selectivity of the self-assembly sensor, we tested the current response of Ni-MOF/Nafion/GCE electrode for 0.05 mM urea and various interfering species, such as creatinine, oxalic acid, uric acid (UA), cytosine, thymine, Cl−, SO42− and adenine that coexist in human urine throughout during urea estimation. The results for the mentioned study are displayed at an oxidation peak potential of +0.6 V in Fig. 6. With respective stepwise addition of creatinine, oxalic acid, UA, cytosine, thymine, Cl−, SO42− and adenine in 0.1 M KOH solution every 60 seconds, it is clear that the current barely changed even though the interfering species were present in 2-fold or 0.2-fold concentration levels in comparison to urea (creatinine: 10 μM; oxalic acid: 10 μM; UA: 0.1 mM; cytosine: 0.1 mM; thymine: 0.1 mM; Cl−: 0.1 mM; SO42−: 0.1 mM; adenine: 0.1 mM). From Fig. S7,† we can evaluate that the current responses of all the interfering species are less than 12.5% of the urea signal. The above results are enough to prove the high selectivity of this self-assembly sensor towards urea detection. | ||
| Fig. 6 The current response of the Ni-MOF/Nafion/GCE electrode to the addition of urea and different interfering species, 0.1 M KOH solution as supporting electrolyte. | ||
Another remarkable feature of the electrodes in practical application is its prolonged stability. As displayed in Fig. S8,† the sensor response to urea was measured for one month. We keep the self-prepared urea sensor in the air and perform CV test to record the change in current value. After keeping it in the air for one week, the cathodic peak current attenuation does not reach more than 5% of the original signal. And the current response maintains 92.5% of its original current signal even after one month of air storage (I/I0 = 92.5%). These results demonstrate that the urea sensor based on Ni-MOF nanobelts has superior stability for sensing applications. The RSD is 2.41%.
In addition, the reproducibility of the sensor is also evaluated in our study. We investigate the CV responses of five electrodes prepared with the same method in 0.1 M electrolyte containing 1.0 mM urea, as displayed in Fig. S9.† The five electrodes achieve illustrious consistency, where the RSD of their current response is 2.74%. The excellent stability and repeatability of the Ni-MOF nanobelt electrode make them a promising candidate as a practical non-enzymatic urea sensor.
Determination of urea in human body fluids
Real urine samples were analysed by linear sweep voltammetry (LSV) to examine the practical feasibility of the Ni-MOF/Nafion/GCE electrode, as shown in Fig. 7. For large urea concentration ranging from 0 to 8 mM, the oxidation peak currents are strengthened gradually, with a correlation coefficient of the corresponding linear equation being 0.987. In the meantime, the peak potential shifts towards the positive direction with increasing urea concentration, which indicates that other molecules in the urine have little effect on the detection of urea for this sensor. The results are satisfactory for the detection of urea in routine samples. | ||
| Fig. 7 LSV responses of Ni-MOF nanobelts modified GCE in diluted human urine sample containing different urea concentrations: 0, 1, 2, 3, 4, 5, 6, 7, and 8 mM. Inset: Corresponding calibration plot of urea concentration vs. current response. | ||
To further estimate the functional characteristics of Ni-MOF/Nafion/GCE electrode in real urine samples, this developed sensor was applied to three real urine samples using the recovery test. The actual sample was diluted 100 times in 0.1 M KOH solution. Then, a series of known concentration of urea solution were added to the diluted urine sample and colorimetric methods were used for a comparative study with the proposed sensor. The results are presented in Table 2. The t-test results show that there is no significant difference between the two methods.
| Sample no. | Determined by standard methoda (mM) | Determined by sensor (mM) | Urea spiked sample (mM) | Founded by sensor (mM) | Recovery (%) |
|---|---|---|---|---|---|
| a Determined by colorimetric method.32 | |||||
| Sample-1 | 3.19a | 2.98 | 1.00 | 3.97 | 99.5 |
| 3.00 | 6.15 | 105.7 | |||
| 4.00 | 7.34 | 109.0 | |||
| Sample-2 | 3.75a | 3.20 | 1.00 | 4.12 | 92.0 |
| 3.00 | 6.21 | 100.3 | |||
| 4.00 | 7.66 | 111.5 | |||
| Sample-3 | 2.43a | 2.71 | 1.00 | 3.86 | 115.0 |
| 3.00 | 5.94 | 107.7 | |||
| 4.00 | 7.00 | 107.25 | |||
Therefore, the conclusions drawn from the Ni-MOF sensor have a certain degree of confidence. The Ni-MOF sensor shows excellent electrochemical performance towards urea. Recoveries of 92.0–115.0% verify the suitability of the developed enzyme-free urea sensor in real urine samples, where the presence of various impurities has negligible effect on the authenticity of the method. In view of this, the foregoing sensor can be extended to urea determination in biological samples such as milk and serum.
Conclusions
An ultrathin Ni-MOF nanobelt decorated electrode was evaluated as a novel non-enzymatic urea sensor. The urea sensor based on Ni-MOF ultrathin nanobelts exhibits superior sensing performances such as broad detection range, low detection limit and high selectivity. Furthermore, our prepared urea sensor also shows acceptable anti-interference ability, stability and reproducibility. Overall, the urea sensor based on ultrathin Ni-MOF nanobelts is successfully fabricated and found to be promising for applications in medical diagnostics and environmental monitoring.Ethical statement
The human urine samples were kindly provided by graduate students of our group in Shanxi Normal University (Linfen, China). In addition, the main purpose and application of this research have been informed, and the urine samples used in this experiment was obtained with the consent of the graduate students (Qiangqiang Niu and Zi-Ang Chen, respectively).Conflicts of interest
There are no conflicts to declare.Acknowledgements
This work was supported by the National Natural Science Foundation of China (No. 21705103), the Applied Basic Research Project of Shanxi Province (No. 201801D221392), the Graduate Education Innovation Project of Shanxi Province (2018SY057), Collaborative Innovation Center for Shanxi Advanced Permanent Materials (2019-05) and Technology and the 1331 Engineering of Shanxi Province. We appreciate Prof. Dr Xiufang Qin (Shanxi Normal University) for her help on TEM and XRD characterizations. At the same time, I sincerely deliver my thanks to graduate students of our group in Shanxi Normal University (Linfen, China) for providing human urine samples.Notes and references
- M. Tyagi, M. Tomar and V. Gupta, NiO nanoparticle-based urea biosensor, Biosens. Bioelectron., 2013, 41, 110–115 CrossRef CAS PubMed.
- M. Singh, N. Verma, A. K. Garg and N. Redhu, Urea biosensors, Sens. Actuators, B, 2008, 134, 345–351 CrossRef CAS.
- G. Dhawan, G. Sumana and B. D. Malhotra, J. Biochem. Eng., 2009, 44, 42–52 CrossRef CAS.
- M. Gutierrez, S. Alegret and M. Valle, Potentiometric bioelectronic tongue for the analysis of urea and alkaline ions in clinical samples, Biosens. Bioelectron., 2007, 22, 2171–2178 CrossRef CAS PubMed.
- B. Lakard, G. Herlem, S. Lakard, A. Antoniou and B. Fahys, Urea potentiometric biosensor based on modified electrodes with urease immobilized on polyethylenimine films, Biosens. Bioelectron., 2004, 19, 1641–1647 CrossRef CAS PubMed.
- A. Azadbakht and M. B. Gholivand, Covalent attachment of Ni-2,3-pyrazine dicarboxylic acid onto gold nanoparticle gold electrode modified with penicillamine CdS quantum dots for electrocatalytic oxidation and determination of urea, Electrochim. Acta, 2014, 125, 9–21 CrossRef CAS.
- A. Mahmood, W. Guo, H. Tabassum and R. Zou, Metal-Organic Framework-Based Nanomaterials for Electrocatalysis, Adv. Energy Mater., 2016, 1600423 CrossRef.
- Y. Miao, L. Ouyang, S. Zhou, L. Xu, Z. Yang, M. Xiao and R. Ouyang, Electrocatalysis and electroanalysis of nickel, its oxides, hydroxides and oxyhydroxides toward small molecules, Biosens. Bioelectron., 2014, 53, 428–439 CrossRef CAS PubMed.
- N. S. Nguyen and H. H. Yoon, Nickel oxide-deposited cellulose/CNT composite electrode for non-enzymatic urea detection, Sens. Actuators, B, 2016, 236, 304–310 CrossRef CAS.
- R. H. Tammam and M. M. Saleh, On the electrocatalytic urea oxidation on nickel oxide nanoparticles modified glassy carbon electrode, J. Electroanal. Chem., 2017, 794, 189–196 CrossRef CAS.
- Q. Wang, Y. Xue, S. Sun, S. Yan, H. Miao and Z. Liu, Facile synthesis of ternary spinel Co–Mn–Ni nanorods as efficient bi-functional oxygen catalysts for rechargeable zinc-air batteries, J. Power Sources, 2019, 435, 226761 CrossRef CAS.
- Y.-H. Chung, K. Gupta, J.-H. Jang, H. S. Park, I. Jang, J. H. Jang, Y.-K. Lee, S.-C. Lee and S. J. Yoo, Rationalization of electrocatalysis of nickel phosphide nanowires for efficient hydrogen production, Nano Energy, 2016, 26, 496–503 CrossRef CAS.
- P.-Q. Liao, J.-Q. Shenand and J.-P. Zhang, Metal–organic frameworks for electrocatalysis, Coord. Chem. Rev., 2018, 373, 22–48 CrossRef CAS.
- H. Liu, W. Ding, S. Lei, X. Tian and F. Zhou, Selective adsorption of CH4/N2 on Ni-based MOF/SBA-15 composite materials, Nanomaterials, 2019, 9, 149 CrossRef CAS PubMed.
- D. Zhu, C. Guo, J. Liu, L. Wang, Y. Duand and S.-Z. Qiao, Two-dimensional metal–organic frameworks with high oxidation states for efficient electrocatalytic urea oxidation, Chem. Commun., 2017, 53, 10906–10909 RSC.
- J.-Y. Zhang, T. He, M. Wang, R. Qi, Y. Yan, Z. Dong, H. Liu, H. Wang and B. Y. Xia, Energy-saving hydrogen production coupling urea oxidation over a bifunctional nickel-molybdenum nanotube array, Nano Energy, 2019, 60, 894–902 CrossRef CAS.
- T. Q. N. Tran, G. Das and H. H. Yoon, Nickel-metal organic framework/MWCNT composite electrode for non-enzymatic urea detection, Sens. Actuators, B, 2017, 243, 78–83 CrossRef CAS.
- X. Xiao, S. Zheng, X. Li, G. Zhang, X. Guo, H. Xue and H. Pang, Facile synthesis of ultrathin Ni-MOF nanobelts for high-efficiency determination of glucose in human serum, J. Mater. Chem. B, 2017, 5, 5234–5239 RSC.
- H. Yan, J. Bai, J. Wang, X. Zhang, B. Wang, Q. Liu and L. Liu, Graphene homogeneously anchored with Ni(OH)2 nanoparticles as advanced supercapacitor electrodes, CrystEngComm, 2013, 15, 10007–10015 RSC.
- J. Yang, P. Xiong, C. Zheng, H. Qiu and M. Wei, Metal–organic frameworks: a new promising class of materials for a high-performance supercapacitor electrode, J. Mater. Chem. A, 2014, 2, 16640–16644 RSC.
- J. Xu, C. Yang, Y. Xue, C. Wang, J. Cao and Z. Chen, Facile synthesis of novel metal-organic nickel hydroxide nanorods for high performance supercapacitor, Electrochim. Acta, 2016, 211, 595–602 CrossRef CAS.
- N. I. Marzuki, F. A. Bakar, A. B. Salleh, L. Y. Heng, N. A. Yusof and S. Siddiquee, Development of Electrochemical Biosensor for Formaldehyde Determination Based on Immobilized Enzyme, Int. J. Electrochem. Sci., 2012, 7, 6070–6083 CAS.
- S. Zhao, K. Zhang, Y. Bai, W. Yang and C. Sun, Glucose oxidase/colloidal gold nanoparticles immobilized in Nafion film on glassy carbon electrode: direct electron transfer and electrocatalysis, Bioelectrochemistry, 2006, 69, 158–163 CrossRef CAS PubMed.
- V. Vedharathinam and G. G. Botte, Understanding the electro-catalytic oxidation mechanism of urea on nickel electrodes in alkaline medium, Electrochim. Acta, 2012, 81, 292–300 CrossRef CAS.
- A. G. Meguerdichian, T. Jafari, M. R. Shakil, R. Miao, L. A. Achola, J. Macharia, A. A. Shirazi and S. L. Suib, Synthesis and Electrocatalytic Activity of Ammonium Nickel Phosphate, [NH4]NiPO4·6H2O, and β Nickel Pyrophosphate, β Ni2P2O7: Catalysts for Electrocatalytic Decomposition of Urea, Inorg. Chem., 2018, 57, 1815–1823 CrossRef CAS PubMed.
- B. K. Boggs, R. L. King and G. G. Botte, Urea electrolysis: direct hydrogen production from urine, Chem. Commun., 2009, 32, 4859–4861 RSC.
- Y. Velichkova, Y. Ivanov, I. Marinov, R. Ramesh, N. R. Kamini, N. Dimcheva, E. Horozova and T. Godjevargova, Amperometric electrode for determination of urea using electrodeposited rhodium and immobilized urease, J. Mol. Catal. B: Enzym., 2011, 69, 168–175 CrossRef CAS.
- N. S. Nguyen, G. Das and H. H. Yoon, Nickel/cobalt oxide-decorated 3D graphene nanocomposite electrode for enhanced electrochemical detection of urea, Biosens. Bioelectron., 2016, 77, 372–377 CrossRef CAS PubMed.
- R. Sha, K. Komori and S. Badhulika, Graphene–polyaniline composite based ultra-sensitive electrochemical sensor for non-enzymatic detection of urea, Electrochim. Acta, 2017, 233, 44–51 CrossRef CAS.
- M. Arain, A. Nafady, S. Sirajuddin, Z. H. Ibupoto, S. T. H. Sherazi, T. Shaikh, H. Khan, A. Alsalme, A. Niazf and M. Willander, Simpler and highly sensitive enzyme-free sensing of urea via NiO nanostructures modified electrode, RSC Adv., 2016, 6, 39001–39006 RSC.
- Z. Parsaee, Synthesis of novel amperometric urea-sensor using hybrid synthesized NiONPs/GO modified GCE in aqueous solution of cetrimonium bromide, Ultrason. Sonochem., 2018, 44, 120–128 CrossRef CAS PubMed.
- M. Baumgratner, M. Flock, P. Winter, W. Luf and W. Baumgartner, Evaluation of flow injection analysis for determination of urea in sheep's and cow's milk, Acta Vet. Hung., 2002, 50, 263–271 CrossRef PubMed.
Footnote |
| † Electronic supplementary information (ESI) available. See DOI: 10.1039/c9ra05716a |
| This journal is © The Royal Society of Chemistry 2019 |