 Open Access Article
Dual recognition of Al3+ and Zn2+ ions by a novel probe based on diarylethene and its application†
Yaping Zhang,
Hui Li *,
Wendan Gao and
Shouzhi Pu*
Jiangxi Key Laboratory of Organic Chemistry, Jiangxi Science and Technology Normal University, Nanchang 330013, P. R. China. E-mail: lihui5626@163.com; pushouzhi@tsinghua.org.cn; Fax: +86-791-83831996; Tel: +86-791-83831996
First published on 2nd September 2019
Abstract
We synthesized a new fluorescent probe 1O by attaching a diarylethene molecule to a functional group. The probe can be used to detect Al3+ and Zn2+ at the same time with high selectivity, and its detection limit is very low. When Al3+ was added, the fluorescence intensity was increased 310 folds, and was accompanied by a fluorescent color change from black to grass-green. Similarly, after the addition of Zn2+, the fluorescence intensity was enhanced 110 folds, with a concomitant color change from black to yellow-green. Moreover, based on the properties of 1O, we designed a logic circuit, and that also can be used for water sample testing.
Introduction
Small anions, metal cations, and neutral molecules participate in different biological activities and play various important roles in human metabolism.1 Among many metals, aluminum is the most abundant metallic element in the Earth's crust,2,3 and its compounds are widely used in dye production, and the paper and food industries.4–6 Aluminum is not a necessary element for the functioning of the human body, and it may accumulate in the organs and tissues for a long time before it is excreted, so the excessive and deficiency of aluminum will result negative effects on the human body.7–10 For instance, aluminum is linked to Alzheimer's disease, Parkinson's disease, amyotrophic lateral sclerosis, colic, rickets, gastrointestinal problems, interference with the metabolism of calcium, and memory loss.11–15 Thus, aluminum is toxic to biological systems, but it is widely found in the biosphere. It is therefore generally valuable to synthesize a probe that can detect Al3+ with high accuracy.Zinc is one of the transition metals in the human body found in quantities second only to iron, and due to its biological significance, a large body of research exists for zinc.6–18 It is well known that zinc exists in various enzymes and has multiple functions in basic biological processes, such as apoptosis, gene transcription, immune function, pathology, muscle contraction, neural signal transmission, and immune function.19–21 Therefore, the correct amount of zinc in the body is also important.22,23 As reported, a healthy human body should contain 200 to 300 mg of zinc, and a deficiency in zinc can cause physical growth retardation and nervous system disorders.24–26 Zinc can also cause some diseases, such as cerebral ischemia and Alzheimer's disease, amyotrophic lateral sclerosis, Parkinson's disease, and hypoxia-ischemia.27–30 An excess of zinc can contribute to superficial skin diseases, diabetes, and brain disease.31–33 Thus, it is imperative to use efficient tools to detect zinc to confirm the existence of proper levels.
There are numerous methods used to detect Al3+ and Zn2+, such as chromatography, potentiometric ion-selective electrodes, et al.34–36 However, they have some disadvantages compared to a fluorescent probe.37–39 Fluorescent probes have the merits of low cost, fast response, real-time detection, and high selectivity and sensitivity.40,41 Therefore, in recent years, there has been wide usage of fluorescent probes because they have been proven to be one of the most useful detection tools. Additionally, due to their cost-effectiveness and real-time application, there is greater interest in synthesizing single fluorescent probes for simultaneous multi-target detection.42,43 For reported probes based on diarylethene, most of them can only recognize one ion, and their detection limit is not low enough.44–47 There are probes that can simultaneously detect Al3+ and Zn2+, and even in two solvents,48 but they are rare. There are many other probes that can simultaneously detect Al3+ and Zn2+,49–54 and although they can simultaneously detect ions in a mixture of solvents, the detection limit is not low enough. Here, we synthesized a probe that could be used to simultaneously detect Al3+ and Zn2+, and because it has a low detection limit, it has great application prospects for multi-ion detection.
In recent years, great progress has been made in the study of molecular logic gates, and it is important to design molecules for molecular logic devices that can respond to specific ion inputs.55 Therefore, many fundamental logic gates such as a key-pad lock, multiplexer, encoder/decoder, and molecular-scale computer have been designed via fundamental molecules.56,57 As a result, molecular logic gates that respond to chemicals and biological input signals have attracted great interest.58 Among many photochromic materials, diarylethene has proven to be very useful because of its unique structure and excellent photochromic properties.59–61 Based on diarylethene, a series of probes for detecting various ions was synthesized by linking diarylethene to functional groups, such as pyrazole. Pyrazole compounds widely exist in nature and exhibit many unique biological activities and coordination functions, some of which can be used in clinical treatment.62–64 In materials science, pyrazole compounds are widely used in transition metal and rare earth organic fluorescent materials due to their coordination function.65,66
Based on the above, we were designed and synthesized a novel fluorescent probe based on a diarylethene derivative and a pyrazole functional group. The probe can detect and distinguish Al3+ and Zn2+ from each other with high selectivity and sensitivity. The properties of the probe and its selectivity towards Al3+ and Zn2+ were systematically investigated, and it was determined that it can detect Al3+ and Zn2+ by fluorescence enhancement. Also, its structure was characterized by 1H and 13C nuclear magnetic resonance (NMR) spectroscopy, and electrospray ionization-mass spectrometry (ESI-MS). A diagram of its photochromism is shown in Scheme 1.
Experimental
General methods
The chemicals used in these experiments were purchased from J&K Chemicals and Innochem Technology, and used directly without further purification. All of the solvents were analytical grade and purified by distillation before use. The ionic solutions used in the experiments were prepared by dissolving metal salts of various ions in deionized water. Among them, only Ba2+, K+, Sn2+, and Hg2+ ions are metal chlorides; the others are metal nitrates. The EDTA disodium salt solution was also dissolved in deionized water. NMR spectra were obtained with a Bruker AV400 (400 MHz) spectrometer using DMSO-d6 as the solvent and tetramethylsilane as the internal standard. UV/Vis absorption spectra were measured on an Agilent 8453 UV/Vis spectrophotometer. Fluorescent spectra were recorded with a Hitachi F4600 fluorescence spectrophotometer. The mass spectra were measured using a Bruker Amazon SL Ion Trap mass spectrometer. Elemental analysis was carried out with a PE CHN 2400 analyzer, and the melting point was measured with a WRS-1B melting point apparatus. The lighting devices used in the experiment were a MUL-165 UV lamp and a MVL-210 visible lamp.Sample pretreatment
The water samples analysed included tap water and water from Yaohu Lake in Nanchang, China. Water samples were filtered through a 0.2 mm membrane filter to remove suspended particulate matter before analysis. Then, Al3+ and Zn2+ were added to form a solution of a certain concentration.Synthesis of the target compound
The route for synthesizing the target compound, 1-(2,5-dimethyl-3-thienyl)-2-{2-methyl-5-[4-hydroxyl-3-(3-(4-methylphenyl)-1H-pyrazole-5-carbohydrazide)phenyl]-3-thienyl}perflurocyclopentene is shown in Scheme 2 (1O). Compounds 2 and 3 were facilely synthesized in high yield according to previously published procedures.67Weighed compound 3 was added to a 25 ml single-mouth bottle, and a syringe was used to add 5 ml of absolute ethanol. Then, compound 4 was added to the solution, which was heated and refluxed for 7 h. The mixture was cooled to room temperature, and then stored in a refrigerator overnight. Purification was performed by recrystallization of the anhydrous ethanol, and target compound 1O was obtained as a white solid with a yield of 79%; mp 523–524 K. Anal. calcd. for C32H22F6N2O3S2 (%): calcd: C, 58.28; H, 3.74; N, 8.0; O, 4.57; found: C, 58.60; H, 3.42; N, 8.09; O, 4.48. 1H NMR (DMSO-d6, 400 MHz), δ (ppm): 1.87 (s, 3H), 1.91 (s, 3H), 2.35 (s, 3H), 2.42 (s, 3H), 6.85 (s, 1H), 7.00 (d, 1H), 7.19 (s, 1H), 7.31 (t, 2H), 7.38 (s, 1H), 7.57 (d, 1H), 7.75 (d, 3H), 8.76 (s, 1H), 11.59 (s, 1H), 12.20 (s, 1H), 13.80 (s, 1H). 13C NMR (DMSO-d6, 100 MHz), δ (ppm): 14.38, 15.15, 21.30, 103.64, 117.78, 119.94, 121.84, 124.03, 124.67, 124.86, 125.60, 125.88, 126.28, 126.42, 128.79, 130.08, 138.63, 140.08, 140.40, 141.77, 144.36, 146.68, 147.85, 157.90, 158.63. MS (ESI−): m/z 699.1 [M − H]−.
Results and discussion
Photochromic properties of 1O
The photochromic properties of 1O were tested in methanol (2.0 × 10⁻⁵ mol L−1) at room temperature and under UV light (λ = 254 nm) and visible light (λ > 500 nm). As shown in Fig. 1, a strong absorption peak was observed at 296 nm in the initial state, and the absorption peak would decrease with irradiation of 297 nm light, which may have been caused by the result of the π → π* transition. Because of the appearance of closed-loop states 1C with π-electron intramolecular delocalization,68 a new absorption band appeared at 553 nm. At the same time, the color of the solution changed from colorless to purple. In contrast, using visible light (λ > 500 nm) to irradiate the solution of 1C, the absorption peak returned to the initial state, and the color of the solution was entirely bleached. In general, the photochromic process of 1O is a reversible process. When the photostationary state (PSS) was reached, a distinct isosbestic point of isomerization was observed at 322 nm, indicating that the photoisomerization was a unimolecular process of two species and supported the reversible two-component photo-chromic reaction scheme.69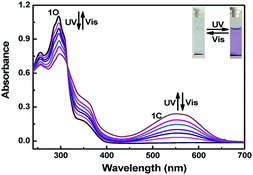 | ||
| Fig. 1 Changes in the absorption spectra of 1O upon alternating irradiation with UV and visible light in methanol (2.0 × 10⁻⁵ mol L−1). | ||
Fluorescence response to metal ions
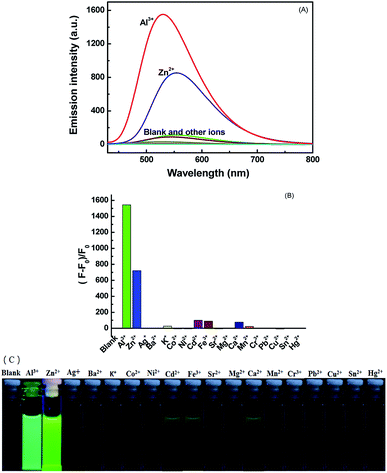
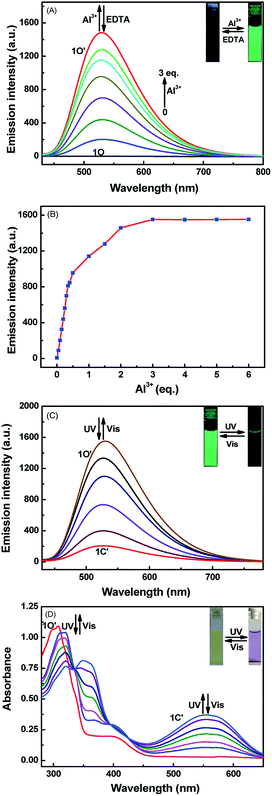
At room temperature, the selectivity of compound 1O was measured in methanol. As Fig. 2A and B show, during excitation at 420 nm, when the same amount of various metal ions (Cu2+, K+, Ni2+, Co2+, Cd2+, Ba2+, Sn2+, Mg2+, Zn2+, Hg2+, Ca2+, Mn2+, Pb2+, Sr2+, Cr3+, Al3+, and Fe3+) was added to solution 1O, only the addition of Al3+ and Zn2+ resulted in dramatic enhancement of fluorescence intensity. When Al3+ was added, a strong emission peak appeared at 530 nm, and the intensity of the fluorescence was enhanced 310-fold compared to 1O. The obvious change of color from black to grass-green may have been caused by the formation of 1O–Al3+ (1O′). After Zn2+ was added, a strong emission peak appeared at 553 nm, and compared with 1O, the intensity of the fluorescence increased by 110-fold. The change in the color from black to yellow green may be due to the 1O–Zn2+ (1O′′), as shown in Fig. 2C. Therefore, compound 1O could be used to detect Al3+ and Zn2+ in the solution of methanol.Fluorescence titration experiments were conducted in methanol at room temperature to determine the fluorescence response of Al3+, Zn2+, and UV/Vis. As Fig. 3A shows, with increasing Al3+ (0–3 eq.), the formation of 1O–Al3+ increased and led to an increase in the fluorescence intensity, but when the amount of added Al3+ reached 3.0 eq., the fluorescence intensity tended to equilibrium and reached a maximum. In the entire process, the emission peak of 1O blueshifted from 524 nm to 530 nm, and the fluorescence intensity increased by 310 fold. After the fluorescence intensity reached the maximum, an experiment was conducted to measure its reversibility. When a certain amount of EDTA was added, the state of 1O′ returned to that of the original, which suggests that EDTA can separate Al3+ from the complex, and it is a reversible process.
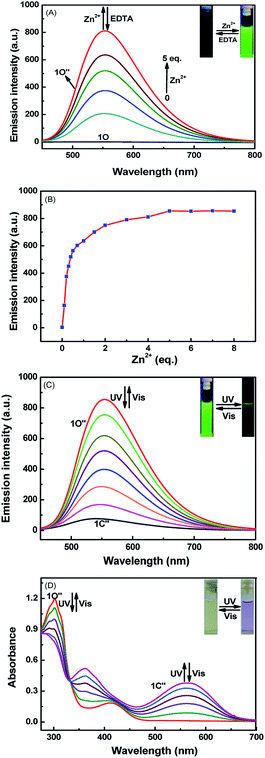
The addition of Zn2+ resulted in changes similar to those seen with Al3+. As Fig. 4A shows, when the amount of zinc ions added was from 0 to 5 eq., the fluorescence gradually increased and finally reached equilibrium. This was attributed to the production of complex 1O–Zn2+ (1O′′), which caused the isomerization of C![[double bond, length as m-dash]](https://www.rsc.org/images/entities/char_e001.gif) N to be suppressed. In this process, the fluorescence intensity enhanced 110 fold, the solution of 1O changed from black to yellow-green, and the emission peak redshifted from 524 nm to 554 nm. Then, when the aqueous solution of EDTA was added, the result is that EDTA separated Zn2+ from the complex (1O′′), and the fluorescence spectrum was recovered to the state of 1O, thus demonstrating that the process is reversible.
N to be suppressed. In this process, the fluorescence intensity enhanced 110 fold, the solution of 1O changed from black to yellow-green, and the emission peak redshifted from 524 nm to 554 nm. Then, when the aqueous solution of EDTA was added, the result is that EDTA separated Zn2+ from the complex (1O′′), and the fluorescence spectrum was recovered to the state of 1O, thus demonstrating that the process is reversible.
Fig. 3B and 4B was described the linear relationship between different Al3+ and Zn2+ concentrations and emission intensity at 530 nm and 553 nm. For Al3+, the linearity range is 0–0.45 eq., and for Zn2+, the linearity range is 0–0.35 eq. This shows that with increasing Al3+ and Zn2+, the fluorescence intensity was enhanced until the maximum was reached. The sparse fluorescence of 1O can be attributed to the isomerization of C![[double bond, length as m-dash]](https://www.rsc.org/images/entities/char_e001.gif) N, and after the addition of Al3+ and Zn2+, the fluorescence intensity gradually increased. This increase in fluorescence intensity can be explained by chelation enhancing fluorescence (CHEF).
N, and after the addition of Al3+ and Zn2+, the fluorescence intensity gradually increased. This increase in fluorescence intensity can be explained by chelation enhancing fluorescence (CHEF).
It is worth noting that due to the inhibition of C![[double bond, length as m-dash]](https://www.rsc.org/images/entities/char_e001.gif) N isomerization, the chelates 1O–Al3+ and 1O–Zn2+ exhibited obvious fluorescence switching performance under UV/Vis irradiation. As Fig. 3C shows, with irradiation at 297 nm, the fluorescence intensity gradually decreased until it reached a minimum, which may be the formation of 1C′. The 1O′ intensity was quenched by approximately 87%, and the color of the solution also turned a dark green. However, under visible light irradiation (λ > 500 nm), the fluorescence intensity and solution color were recovered to the initial state. Similarly, as Fig. 4C shows, the fluorescence intensity of 1O′′ decreased after irradiation of 297 nm. Compared with 1C′′, the 1O′′ intensity was quenched by approximately 91%. However, after being exposed to visible light (λ > 500 nm), the fluorescence intensity and solution color also returned to their initial state. Thus, from the above results, we can conclude that Al3+, Zn2+, EDTA, and UV/Vis light can be used to effectively modulate the fluorescence.
N isomerization, the chelates 1O–Al3+ and 1O–Zn2+ exhibited obvious fluorescence switching performance under UV/Vis irradiation. As Fig. 3C shows, with irradiation at 297 nm, the fluorescence intensity gradually decreased until it reached a minimum, which may be the formation of 1C′. The 1O′ intensity was quenched by approximately 87%, and the color of the solution also turned a dark green. However, under visible light irradiation (λ > 500 nm), the fluorescence intensity and solution color were recovered to the initial state. Similarly, as Fig. 4C shows, the fluorescence intensity of 1O′′ decreased after irradiation of 297 nm. Compared with 1C′′, the 1O′′ intensity was quenched by approximately 91%. However, after being exposed to visible light (λ > 500 nm), the fluorescence intensity and solution color also returned to their initial state. Thus, from the above results, we can conclude that Al3+, Zn2+, EDTA, and UV/Vis light can be used to effectively modulate the fluorescence.
Additionally, a photochromic process experiment with 1O′ and 1O′′ was conducted. As Fig. 3D shows, when 1O′ was irradiated with 297 nm light, the yellow solution would change to purple, and at 555 nm, a new peak was present and gradually increased until it reached a maximum. This occurred because of a closed-loop reaction, and a closed-loop state of 1C′ was generated. The isosbestic point of the absorption spectrum appeared at 334 nm. For zinc, the result was the same (Fig. 4D). Under irradiation of 297 nm, the yellow color of the solution turns purple, and a new absorption peak was present at 563 nm; the isosbestic point was observed at 334 nm. However, when irradiated with visible light (λ > 500 nm), the spectrum and solution color of 1C′ and 1C′′ all recovered to the initial state. Therefore, the photochromic process of 1O′ and 1O′′ is reversible under UV and visible light.
In order to further determine the binding ability of 1O to Al3+ and Zn2+, Job's plot experiment was performed, and the results are shown in Fig. S3.† Under the premise of maintaining the total molar concentration of 1O and Al3+ and Zn2+, when the value of the emission intensity reached the maximum, the corresponding molar fraction is 0.5, and this illustrates that 1O with Al3+ and Zn2+ are complexed in a 1![[thin space (1/6-em)]](https://www.rsc.org/images/entities/char_2009.gif) :
:![[thin space (1/6-em)]](https://www.rsc.org/images/entities/char_2009.gif) 1 stoichiometry. As Fig. S4† shows, based on the fluorescence titration experiment of 1O with Al3+ and Zn2+, and according to the Benesi–Hildebrand equation, the complexation constant (Ka) of 1O for Al3+ and Zn2+ was calculated, and it is 2.7 × 10⁴ L mol−1 and 1.98 × 10⁵ L mol−1, respectively. The detection limit of compound 1O for Al3+ and Zn2+ is 6.7 × 10⁻⁹ mol L−1 and 3.7 × 10⁻⁸ mol L−1, respectively. This indicates that 1O can be used to monitor Al3+ and Zn2+ with high accuracy.
1 stoichiometry. As Fig. S4† shows, based on the fluorescence titration experiment of 1O with Al3+ and Zn2+, and according to the Benesi–Hildebrand equation, the complexation constant (Ka) of 1O for Al3+ and Zn2+ was calculated, and it is 2.7 × 10⁴ L mol−1 and 1.98 × 10⁵ L mol−1, respectively. The detection limit of compound 1O for Al3+ and Zn2+ is 6.7 × 10⁻⁹ mol L−1 and 3.7 × 10⁻⁸ mol L−1, respectively. This indicates that 1O can be used to monitor Al3+ and Zn2+ with high accuracy.
It is well known that there are many fluorescent probes that have been reported to recognize Al3+ and Zn2+, as shown in Table 1, which compares the detection limit of some probes. The table shows that the detection limit of this probe is not low enough. Here, the probe we designed can recognize both ions at the same time and has a low detection limit. Thus, the probe still has the advantage of recognizing Al3+ and Zn2+ at the same time.
In addition, the dates of mass spectrometry of 1O with Al3+ and Zn2+ also proved the result of Job's plot experiment. As Fig. S5† shows, in the methanol solution of 1O, a peak appeared at 699.1 m/z, which corresponds to [1O–H+]−. When Al3+ was added, a new characteristic peak appeared at 762.0 m/z, which was due to the formation of [1O + Al3+ + 2NO3− − 2H+]−. When Zn2+ was added to the solution of 1O, a characteristic peak appeared at 762.9 m/z, which was assigned to [1O + Zn2+ + NO3− − 2H+]−. Additionally, to further explore the combination method for 1O with Al3+ and Zn2+, 1H NMR titration experiments were also conducted in DMSO-d6 solvent. As Fig. 5A shows, with the addition of Al3+, the Ha completely disappeared, which indicates that there is an interaction of Al3+–N. The peak of Hb increased, which indicates that Al3+–O was formed. The signal Hd was also enhanced, which indicates the form of Al3+–N![[double bond, length as m-dash]](https://www.rsc.org/images/entities/char_e001.gif) . The Hc signal decreased, and shifted from 11.593 to 11.522, which may be affected by the interaction of Al3+–O
. The Hc signal decreased, and shifted from 11.593 to 11.522, which may be affected by the interaction of Al3+–O![[double bond, length as m-dash]](https://www.rsc.org/images/entities/char_e001.gif) . For Zn2+, as Fig. 5B shows, upon the addition of Zn2+, the peaks of Ha and Hc were significantly decreased. For the Ha, this denoted the generation of Zn2+–O
. For Zn2+, as Fig. 5B shows, upon the addition of Zn2+, the peaks of Ha and Hc were significantly decreased. For the Ha, this denoted the generation of Zn2+–O![[double bond, length as m-dash]](https://www.rsc.org/images/entities/char_e001.gif) , which will affect the change of Ha. For Hc, it also may be affected by the interaction of Zn–N
, which will affect the change of Ha. For Hc, it also may be affected by the interaction of Zn–N![[double bond, length as m-dash]](https://www.rsc.org/images/entities/char_e001.gif) . However, the Hb was enhanced, which indicates that the interaction of Al–O occurred. Thus, the proposed sensing mechanism of Al3+ and Zn2+ by 1O is shown in Fig. 5.
. However, the Hb was enhanced, which indicates that the interaction of Al–O occurred. Thus, the proposed sensing mechanism of Al3+ and Zn2+ by 1O is shown in Fig. 5.
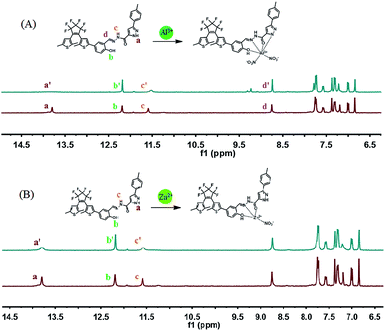 | ||
| Fig. 5 (A) 1H NMR spectra (400 MHz) measured during the titration of 1O with Al3+ in DMSO-d6. (B) 1H NMR spectra (400 MHz) measured during the titration of 1O with Zn2+ in DMSO-d6. | ||
Application in logic circuits
On the basis of the experimental results, Al3+, Zn2+, and UV/Vis can effectively regulate the photochromic and fluorescence properties of 1O. The photoswitching behaviour of compound 1O is displayed in Scheme 3. Based on these properties of 1O, a logic gate was designed. As shown in Fig. 6, the logic gate consists of four input values: UV (In 1), Vis (In 2), Al3+/Zn2+ (In 3), and EDTA (In 4), and one output: the fluorescence intensity at 530/553 nm. For the input signal, when UV, Vis, Al3+/Zn2+, and EDTA exist, this is described as the “on” state. Conversely, the case where they do not exist is defined as the “off” state. That is, when the compound is irradiated with UV, it represents that the input signal In 1 is “on” or is “off”. Vis (In 2), Al3+/Zn2+ (In 3), and EDTA (In 4) are also the same. For the output signal, the fluorescence emission intensity of compound 1O is considered to be “off” with the Boolean value “0”. After addition of Al3+/Zn2+, the fluorescence intensity is increased by 310/110 times, which is considered to be “on”, and the Boolean value is “1”. All four possible inputs are shown in Table 2, and the corresponding logic circuit diagram is shown in Fig. 6.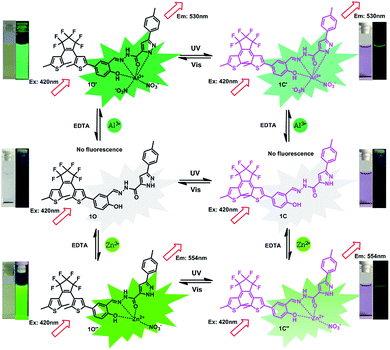 | ||
| Scheme 3 Photochromism, color, and fluorescence changes of 1O induced by Al3+/EDTA, Zn2+/EDTA, and UV/Vis lights. | ||
 | ||
| Fig. 6 The logic circuit based on the diarylethene molecule with various inputs: the combinational logic circuits equivalent to the truth table given in Table 2: In 1 (UV), In 2 (Vis), In 3 (Al3+/Zn2+), In 4 (EDTA), and OUT 1. | ||
| Input | Output (λem = 530/554 nm) | |||
|---|---|---|---|---|
| In 1 (UV) | In 2 (Vis) | In 3 (Al3+/Zn2+) | In 4 (EDTA) | |
| a When the emission intensity at 530/554 nm is more than 110 fold that of the original state, the output signal is defined as ‘1’; otherwise, it is defined as ‘0’. | ||||
| 0 | 0 | 0 | 0 | 0 |
| 1 | 0 | 0 | 0 | 0 |
| 0 | 1 | 0 | 0 | 0 |
| 0 | 0 | 1 | 0 | 1 |
| 0 | 0 | 0 | 1 | 0 |
| 1 | 1 | 0 | 0 | 0 |
| 1 | 0 | 1 | 0 | 0 |
| 1 | 0 | 0 | 1 | 0 |
| 0 | 1 | 1 | 0 | 1 |
| 0 | 1 | 0 | 1 | 0 |
| 0 | 0 | 1 | 1 | 0 |
| 1 | 1 | 1 | 0 | 1 |
| 1 | 1 | 0 | 1 | 0 |
| 1 | 0 | 1 | 1 | 0 |
| 0 | 1 | 1 | 1 | 0 |
| 1 | 1 | 1 | 1 | 0 |
Detecting Al3+ and Zn2+ in water
Considering the influence of Al3+/Zn2+ on the human body and the environment, the capability of 1O to detect Al3+/Zn2+ in crude water samples was tested with standard methods to validate its practical utility in environmental science. Water samples were prepared as described in the experimental section. As depicted in Tables 3 and 4, after adding different concentrations of Al3+/Zn2+ into the water sample, obvious fluorescence enhancement was observed, and the Al3+/Zn2+ concentration in these water samples could be accurately measured by probe 1O.70,71 The result was the average of the three parallel experiments, and the relative standard deviation (RSD) was also calculated. As shown in Tables 3 and 4, the recovery rate of Al3+ was between 96% and 105%, and the recovery rate of Al3+ was between 97% and 105%.72,73 Therefore, from the calculation results, 1O can be used for the detection of actual water samples.| Sample | Al3+ added (μM) | Al3+ determined (μM), n | Recovery (%) | RSD (%) |
|---|---|---|---|---|
| a n = the average of the three tests. | ||||
| Yaohu lake | 1 | 1.03 | 103 | 1.9 |
| 2 | 2.08 | 105 | 1.45 | |
| 3 | 3.06 | 102 | 2 | |
| Tap water | 1 | 0.96 | 96 | 4.1 |
| 2 | 1.93 | 97 | 1.6 | |
| 3 | 2.93 | 98 | 1.1 | |
| Sample | Zn2+ added (μM) | Zn2+ determined (μM), n | Recovery (%) | RSD (%) |
|---|---|---|---|---|
| a n = the average of the three tests. | ||||
| Yaohu lake | 1 | 1.05 | 105 | 1.9 |
| 2 | 2.06 | 103 | 2.1 | |
| 3 | 3.05 | 102 | 1.5 | |
| Tap water | 1 | 0.99 | 99 | 3 |
| 2 | 1.94 | 97 | 2.1 | |
| 3 | 2.93 | 98 | 0.6 | |
Conclusions
We have synthesized a fluorescent probe 1O by attaching a diarylethene molecule to a functional group, and it can be used to detect Al3+ and Zn2+ at the same time by enhanced fluorescence intensity. When Al3+ was added, the fluorescence intensity increased 310 folds and was accompanied by a fluorescent color change from black to grass-green. Similarly, after the addition of Zn2+, the fluorescence intensity was enhanced 110 folds, with a concomitant color change from black to yellow-green. The probe can simultaneously recognize Al3+ and Zn2+ and has a low detection limit. Moreover, based on the properties of 1O, we have designed a logic circuit, and it also can be used for water sample testing. These results indicate that diarylethene-based fluorescent probes have great potential as a dual sensor.Conflicts of interest
There are no conflicts of interest to declare.Acknowledgements
The authors are grateful for financial support from the National Natural Science Foundation of China (21861017, 41867052, 41867053), the “5511” Science and Technology Innovation Talent Project of Jiangxi, and the Open Project Program of “311 High Level Engineering Center”, Jiangxi Science & Technology Normal University (No. KFGJ19004).Notes and references
- L. Yu, S. L. Wang, K. Z. Huang, Z. G. Liu, F. Gao and W. B. Zeng, Tetrahedron, 2015, 71, 4679 CrossRef CAS.
- L. K. Kumawat, M. Kumar and P. Bhatt, Anal. Methods, 2016, 8, 7369 RSC.
- M. Mukherjee, S. Pal and S. Lohar, Analyst, 2014, 139, 4828 RSC.
- A. S. M. Islama, R. Bhowmicka and H. Mohammada, New J. Chem., 2016, 40, 4710 RSC.
- A. Gupta and N. Kumar, RSC Adv., 2016, 6, 106413 RSC.
- S. Samanta, U. Manna and T. Ray, Dalton Trans., 2015, 44, 18902 RSC.
- N. Behera and V. Manivannan, J. Photochem. Photobiol., A, 2018, 353, 77 CrossRef CAS.
- E. Serkan and K. Ozcan, Sens. Actuators, B, 2018, 273, 56 CrossRef.
- Z. Shuang, J. L. Shi and J. S. Xue, Spectrochim. Acta, Part A, 2018, 205, 276 CrossRef PubMed.
- H. Y. Lei, H. P. Diao, W. Liu, J. Xie, Z. J. Wang and L. H. Feng, RSC Adv., 2016, 6, 77291 RSC.
- J. Sun, Z. Liu and Y. Wang, RSC Adv., 2015, 5, 100873 RSC.
- H. Li, J. Z. Wang and S. J. Zhang, RSC Adv., 2018, 8, 31889 RSC.
- C. Kim, T. G. Jo and J. Lee, New J. Chem., 2016, 40, 8918 RSC.
- G. Yang, X. Meng and Z. Z. Wang, New J. Chem., 2018, 42, 14630 RSC.
- Y. Chen, Y. Mi and Q. Xie, Anal. Methods, 2013, 5, 4818 RSC.
- J. H. Kim, I. H. Hwang and S. P. Jang, Dalton Trans., 2013, 42, 5500 RSC.
- S. BasuRoy, C. Prodhan and K. Chaudhuri, Photochem. Photobiol. Sci., 2017, 14, 1103 RSC.
- L. Zhang, X. Cui and J. Sun, Bioorg. Med. Chem. Lett., 2013, 23, 3511 CrossRef CAS PubMed.
- M. Patil, S. Bothra, S. K. Sahoo, H. A. Rather, R. Vasita, R. Bendre and A. Kuwar, Sens. Actuators, B, 2018, 270, 200 CrossRef CAS.
- X. X. He, X. M. Wang, L. Zhang, G. Z. Fang, J. F. Liu and S. Wang, Sens. Actuators, B, 2018, 287, 289 CrossRef.
- S. Sun, Q. Shu and P. Lin, RSC Adv., 2016, 6, 93826 RSC.
- J. Li, Y. Chen and T. Chen, Sens. Actuators, B, 2018, 268, 446 CrossRef CAS.
- H. Liu, Y. Tan and Q. Dai, Dyes Pigm., 2018, 158, 312 CrossRef CAS.
- Y. Kun, J. X. Fu and Y. X. Chang, Spectrochim. Acta, Part A, 2018, 205, 410 CrossRef.
- H. J. Jang, J. H. Kang and M. Lee, Ind. Eng. Chem. Res., 2018, 57, 54 CrossRef CAS.
- K. Aich, S. Goswami, S. Das and C. D. Mukhopadhyay, RSC Adv., 2015, 5, 31189 RSC.
- S. Marzieh, A. Mehdi and M. Soraia, New J. Chem., 2018, 42, 12595 RSC.
- J. M. Jung, J. H. Kang, J. Han, H. Lee, M. H. Lim, K. T. Kim and C. Kim, Sens. Actuators, B, 2018, 267, 58 CrossRef CAS.
- J. H. Kang, J. Han and H. Lee, Dyes Pigm., 2018, 152, 131 CrossRef CAS.
- K. Du, S. Z. Niu and L. Qiao, RSC Adv., 2017, 7, 40615 RSC.
- Z. L. Lu, Y. N. Lu and W. L. Fan, Spectrochim. Acta, Part A, 2019, 206, 295 CrossRef CAS PubMed.
- F. G. Huo, Q. Wu, J. Kang, Y. B. Zhang and C. X. Yin, Sens. Actuators, B, 2018, 262, 263 CrossRef CAS.
- L. Somenath, P. Siddhartha and M. Manjira, RSC Adv., 2017, 7, 25528 RSC.
- P. Hou, J. Wang and S. Fu, Anal. Bioanal. Chem., 2019, 411, 935 CrossRef CAS PubMed.
- J. H. Hu, J. B. Li, J. Qi and J. J. Chen, New J. Chem., 2015, 39, 843–848 RSC.
- Y. P. Xuan and J. B. Qu, RSC Adv., 2018, 8, 4125 RSC.
- N. Thirumalaivasan, P. Venkatesan and S. P. Wu, New J. Chem., 2017, 41, 13510 RSC.
- J. Li, C. Yin and T. Liu, Sens. Actuators, B, 2017, 252, 1112 CrossRef CAS.
- J. Kang, F. J. Huo, Y. B. Zhang, J. B. Chao, T. E. Glass and C. X. Yin, Spectrochim. Acta, Part A, 2019, 209, 95 CrossRef CAS PubMed.
- X. Ding, F. Zhang and Y. Bai, Tetrahedron Lett., 2017, 58, 3868 CrossRef CAS.
- H. Seo, M. An and B. Y. Kim, Tetrahedron, 2017, 73, 4684 CrossRef CAS.
- B. Gu, L. Huang and W. Su, Anal. Chim. Acta, 2017, 954, 97 CrossRef CAS PubMed.
- Y. Tang, Y. Y. Li, J. Han, Y. L. Mao, L. Ni and Y. Wang, Spectrochim. Acta, Part A, 2019, 208, 299 CrossRef CAS PubMed.
- Z. L. Shi, Y. Y. Tu and S. Z. Pu, RSC Adv., 2018, 8, 6727 RSC.
- E. T. Feng, C. B. Fan, N. S. Wang, G. Liu and S. Z. Pu, Dyes Pigm., 2018, 15, 22 CrossRef.
- S. Q. Cui, S. Y. Qiu, R. M. Lu and S. Z. Pu, Tetrahedron Lett., 2018, 59, 3365 CrossRef CAS.
- R. J. Wang, L. Diao, Q. W. Ren, G. Liu and S. Z. Pu, ACS Omega, 2019, 4, 309 CrossRef CAS.
- Z. Wang, S. Q. Cui, S. Y. Qiu and S. Z. Pu, J. Photochem. Photobiol., A, 2019, 376, 185 CrossRef CAS.
- H. Y. Liu, T. Q. Liu and J. Li, et al., J. Mater. Chem. B, 2018, 6, 5435 RSC.
- Y. Tang, J. Sun and B. Yin, Anal. Chim. Acta, 2016, 942, 104 CrossRef CAS PubMed.
- H. Ananta, R. Ankita and M. Abhishek, et al., Dalton Trans., 2018, 47, 13972 RSC.
- J. C. Qi, L. Fan and B. D. Wang, et al., Anal. Methods, 2015, 7, 716 RSC.
- A. Roy, U. Shee and A. Mukherjee, et al., ACS Omega, 2019, 4, 6864 CrossRef CAS.
- B. J. Pang, C. R. Li and Z. Y. Yang, Spectrochim. Acta, Part A, 2018, 59, 929 Search PubMed.
- S. Karmakar, S. Mardanya, D. Maity and S. Baitalik, et al., Sens. Actuators, B, 2016, 226, 388 CrossRef CAS.
- Y. Han, Y. Niu and M. Liu, et al., J. Mater. Chem. B, 2019, 7, 897 RSC.
- S. Erbas-Cakmak, S. Kolemen and A. C. Sedgwick, et al., Chem. Soc. Rev., 2018, 47, 2228 RSC.
- D. Mondal, P. Pal and S. Baitalik, Sens. Actuators, B, 2017, 242, 746 CrossRef CAS.
- W. D. Gao, Y. P. Zhang, H. Li and S. Z. Pu, Tetrahedron, 2019, 75, 2538 CrossRef CAS.
- L. H. Zhai, Y. Y. Tu, Z. L. Shi and S. Z. Pu, Spectrochim. Acta, Part A, 2019, 218, 171 CrossRef CAS PubMed.
- F. F. Liu, C. B. Fan and S. Z. Pu, J. Photochem. Photobiol., A, 2019, 371, 248 CrossRef CAS.
- J. M. Wolfand, G. H. LeFevre and R. G. Luthy, Environ. Sci.: Processes Impacts, 2016, 18, 1256 RSC.
- Y. Guo, X. G. Wang, L. L. Qu, S. N. Xu, Y. Zhao, R. Q. Xie, M. X. Huang and Y. B. Zhang, RSC Adv., 2017, 7, 11796 RSC.
- H. G. Bonacorso, G. M. D. Forno, C. Wiethan, A. Ketzer, N. Zanatta, C. P. Frizzo, M. A. P. Martins and M. Stradiotto, RSC Adv., 2017, 7, 43957 RSC.
- D. R. Boyd, N. D. Sharma, G. P. Coen, F. Hempenstall, V. Ljubez, J. F. Malone, C. C. R. Allen and J. T. G. Hamilton, Org. Biomol. Chem., 2008, 6, 3957 RSC.
- V. Novohradsky, A. Zamora, A. Gandioso, V. Brabec, J. Ruiz and V. Marchán, Chem. Commun., 2017, 53, 5523 RSC.
- W. D. Gao, Y. P. Zhang, H. Li and S. Z. Pu, Tetrahedron, 2018, 74, 6299 CrossRef CAS.
- Q. H. You, P. S. Chan and W. H. Chan, RSC Adv., 2012, 2, 11078–11083 RSC.
- S. Goswami, K. Aich, A. K. Das, A. Manna and S. Das, RSC Adv., 2013, 3, 2412 RSC.
- L. Xiong, J. Ma and Y. Huang, et al., ACS Sens., 2017, 2, 599 CrossRef CAS PubMed.
- Q. Sun, S. H. Yang and L. Wu, et al., Anal. Chem., 2016, 88, 2266 CrossRef CAS PubMed.
- F. Tan, L. Cong and N. M. Saucedo, et al., J. Hazard. Mater., 2016, 320, 226 CrossRef CAS PubMed.
- Z. Wang, D. M. Han and W. P. Jia, et al., Anal. Chem., 2012, 84, 4915 CrossRef CAS PubMed.
Footnote |
| † Electronic supplementary information (ESI) available. See DOI: 10.1039/c9ra05652a |
| This journal is © The Royal Society of Chemistry 2019 |


