DOI:
10.1039/C9RA05581A
(Paper)
RSC Adv., 2019,
9, 28525-28533
Plasmonic Ag decorated CdMoO4 as an efficient photocatalyst for solar hydrogen production†
Received
19th July 2019
, Accepted 19th August 2019
First published on 10th September 2019
Abstract
The synthesis of Ag-nanoparticle-decorated CdMoO4 and its photocatalytic activity towards hydrogen generation under sunlight has been demonstrated. The CdMoO4 samples were synthesized by a simple hydrothermal approach in which Ag nanoparticles were in situ decorated on the surface of CdMoO4. A morphological study showed that 5 nm spherical Ag nanoparticles were homogeneously distributed on the surface of CdMoO4 particles. The UV/DRS spectra show that the band gap of CdMoO4 was narrowed by the incorporation of a small amount of Ag nanoparticles. The surface plasmonic effect of Ag shows broad absorption in the visible region. The enhanced photocatalytic hydrogen production activities of all the samples were evaluated by using methanol as a sacrificial reagent in water under natural sunlight conditions. The results suggest that the rate of photocatalytic hydrogen production using CdMoO4 can be significantly improved by loading 2% Ag nanoparticles: i.e. 2465 μmol h−1 g−1 for a 15 mg catalyst. The strong excitation of surface plasmon resonance (SPR) absorption by the Ag nanoparticles was found in the Ag-loaded samples. In this system, the role of Ag nanoparticles on the surface of CdMoO4 has been discussed. In particular, the SPR effect is responsible for higher hydrogen evolution under natural sunlight because of broad absorption in the visible region. The current study could provide new insights for designing metal/semiconductor interface systems to harvest solar light for solar fuel generation.
1. Introduction
Rapid energy consumption and decreasing natural resources of fossil fuels and extensive global energy demands have stimulated the development of sustainable energy production systems from renewable sources.1,2 It is high time that eco-friendly and cost-effective, alternative energy is made a key target for the development of renewable energy sources. Among various renewable resources, solar light assisted hydrogen (H2) generation using semiconductors is an attractive step in the direction of sustainable energy production.3–5 Sunlight is the most abundant, highly energy efficient, nonpolluting, inexpensive source for harvesting and conversion into storable chemical energy by mirroring the natural photosynthesis process. It can address our future energy demands since photocatalytic H2 generation under sunlight is considered to be a “fuel for the future”.6 The sunlight assisted water-splitting reaction in the hydrogen evolution reaction (HER) (HER: 2H+ + 2e− → H2), requires a large free energy change to trigger the reaction.7
This can be made possible only by using the narrow band gap of a semiconductor which can absorb light under sunlight.8 However, ideal semiconductor photocatalysts for hydrogen generation from water are limited, due to several requirements such as good absorption capability, suitable band edge position, efficient charge separation and transport, chemical stability in an aqueous environment, which are basic challenges in achieving solar energy conversion efficiency.9,10 To overcome these issues, developing a highly active semiconductor photocatalyst is still a great challenge worldwide. In the past, various semiconductors have been reported for photocatalytic hydrogen generation, such as ZnO,11 TiO2,12 Ta2O5,13 CdS,14 ZnS,15 Nb2O5,16 and WO3,17. These binary metal oxides show great potential for solar energy conversion efficiency. However, their activity for hydrogen generation is not economical due to their unsuitable indirect band edge position, low charge transport, high resistivity, poor stability etc.18,19 Earlier reports show that anion doping in potential catalysts such as TiO2,20 or ZnO,21 tunes the band gap in the visible region and significantly improves photocatalytic activity, but doping sites act as recombination centers, leading to poor activity and poor sustainability due to photo-corrosion. To overcome the problems of binary metal oxides, it is crucial to develop a multicomponent photocatalyst which shows good photocatalytic activity in the visible region with excellent stability. In the past, molybdenum-based semiconductors gained a lot of attention because of their wide range of technological applications, such as hydrogen generation,22 organic pollutant degradation,23 Li-ion batteries,24 and solar cells.25 Among all molybdenum-based semiconductors, CdMoO4 is an interesting semiconductor due to its unique scheelite-type structure, exotic electronic structure, and better optical properties.26 Historically, there have been only a few reports available on the photocatalysis by CdMoO4 such as CdS/CdMoO4 (ref. 27 and 28a) being used for dye degradation. Our group has reported CdMoO4–graphene for the water splitting reaction.28b However, photocatalysis applications have been less explored due to its wide band gap (3.2 eV). Previous reports show that the integration of plasmon active metals (Ag, Au, Cu) on the surface of passive oxide semiconductors also helps to enhance charge transfer kinetics.29a
The enhancement of the photocatalytic activity of a semiconductor due to noble metals may take place in the following ways. (1) The noble metal NPs absorb visible light, in which photogenerated electrons and holes are separated by the metal–semiconductor interface, and the oxidation and/or reduction reactions take place on the surface of the noble metal–semiconductor. This mechanism involves the transfer of photogenerated electrons and/or holes from the noble metal NPs to the semiconductors. (2) Radiative energy transfer can take place from the noble metal NPs to the semiconductor through the interaction of the semiconductor with the strong SPR-induced electric field localized in the immediate vicinity of the noble metal NPs. This SPR-induced electric field can enhance the rate of electron–hole formation, especially on the surface of the semiconductor. Then the photogenerated electrons and holes are easily transferred to the semiconductor/liquid interface, enhancing the photocatalytic efficiency.29b,29c The surface plasmon resonance (SPR) transfers electrons from the metal to the semiconductor and tunes the optical properties of the semiconductor photocatalyst.30 Therefore, one approach to overcoming a wide band gap semiconductor is to decorate noble metal nanoparticles onto its surface. According to Adhikari et al.,31 the presence of Ag nanoparticles on CdMoO4 enhances the charge carrier separation efficiency and photocatalytic activity for dye degradation. An optimum and designed nanocomposite would result in strong electronic interaction between CdMoO4 and Ag nanoparticles that would show enhanced photocatalytic activity in visible light.
In this context, we have successfully synthesized an Ag@CdMoO4 heterostructured photocatalyst through a facile hydrothermal method by decorating Ag nanoparticles onto the surface of CdMoO4. The as-prepared heterostructure photocatalyst was examined for hydrogen generation under natural sunlight. The resultant Ag@CdMoO4 heterostructured photocatalyst exhibits significantly enhanced photocatalytic activity for hydrogen evolution under solar light irradiation.
2. Experimental sections
Sodium molybdate di-hydrate (Na2MoO4)·2H2O, cadmium nitrate (Cd(NO)2·4H2O) and Ag(NO)3 silver nitrate used for the preparation of the catalysts are of analytical grade (SD Fine-Chem Limited, India) and used without any further purification.
2.1 Synthesis of Ag@CdMoO4
All the chemicals used for the synthesis of Ag–CdMoO4 were analytical grade and used without further purification. Ag–CdMoO4 photocatalysts were synthesized by a hydrothermal method and the procedure is briefly described as follows: firstly, 0.05 mole of cadmium nitrate tetrahydrate (Cd(NO3)2·4H2O) (99.99%) and 0.05 mole of sodium molybdate Na2MoO4 (99.99%) were mixed in 50 mL of water in a separate beaker (a). Similarly, 0.5 wt% silver nitrate solution was prepared in 10 mL double distilled water in another beaker (b) and added to the above mixture (a). The clear solution was then transferred to a 200 mL capacity Teflon autoclave and kept at 180 °C for 24 h in an electric oven. The synthesized catalyst was washed several times with absolute ethanol and deionized water, and a brown-colored powder was obtained. This sample was marked CMAg-0 and used for further analysis and comparison. Similarly, different concentrations of silver nitrate solution, 0, 0.5, 1, 2, and 3 wt%, were prepared and a procedure similar to that mentioned above was followed in order to synthesize the other samples. Hence, five samples were prepared for comparative purposes and each sample obtained was labelled CMAg-0, CMAg-0.5, CMAg-1, CMAg-2, CMAg-3, respectively, for convenience.
2.2 Photocatalytic study
2.2.1 Photocatalytic hydrogen generation from water. The photochemical reaction was carried in a 70 mL total volume air-tight cylindrical quartz reactor with a cooling jacket for water circulation. All the reactions were carried out under ambient conditions under natural sunlight on sunny days (March to May) between 10 am and 3 pm at Pune, located in the Maharashtra state of India. The intensity of solar light was measured using a digital lux meter. The measured average intensity of solar light reaching the surface of the earth was 145![[thin space (1/6-em)]](https://www.rsc.org/images/entities/char_2009.gif) 000 lux. In a typical photocatalytic experiment, 15 mg of the photocatalyst was dispersed in 25 mL total volume containing 20% methanol (v/v) in aqueous solution. The 45 mL free space of the photoreactor was made airtight with a rubber septum followed by ultrasonication for 5 min for the uniform dispersion of catalyst. The solution mixture was then purged with Ultra High Purity nitrogen gas (UHP 99.999%) to remove all the gases in the headspace of the reactor and dissolved oxygen from the reaction mixture. Before and after irradiation with solar light, the gas in the free space of the reactor was analyzed using gas chromatography (GC). The generated gas was analyzed immediately using GC over a specific time interval.
000 lux. In a typical photocatalytic experiment, 15 mg of the photocatalyst was dispersed in 25 mL total volume containing 20% methanol (v/v) in aqueous solution. The 45 mL free space of the photoreactor was made airtight with a rubber septum followed by ultrasonication for 5 min for the uniform dispersion of catalyst. The solution mixture was then purged with Ultra High Purity nitrogen gas (UHP 99.999%) to remove all the gases in the headspace of the reactor and dissolved oxygen from the reaction mixture. Before and after irradiation with solar light, the gas in the free space of the reactor was analyzed using gas chromatography (GC). The generated gas was analyzed immediately using GC over a specific time interval.
2.3 Sample characterization
The phase formation and crystallite size of all synthesized samples were estimated via X-ray diffractometry (XRD-D8, Advance, Bruker-AXS) with Ni-filtered Cu-Kα radiation (λ = 1.5418 Å). Optical properties of the bare and Au loaded samples were studied by a UV-Vis-DRS spectrophotometer (UV 2600 spectrometer, Lambda-950, PerkinElmer) in the spectral range 200–800 nm. The surface morphology was characterized using field emission scanning electron microscopy (FESEM; Hitachi, S-4800 II) and field emission transmission electron microscopy (FETEM; JEM-2000 FS). Image processing and interplanar distance (d) evaluation were performed with the help of micrograph Gatan software. Raman scattering (RS) was performed at room temperature using an HR 800-Raman spectrometer (Horiba Jobin Yvon, France) with excitation at 532 nm by a coherent He–Ne ion laser and a liquid nitrogen cooled CCD detector to collect and process the backscattered data. Surface characterization of all Ag@CdMoO4 samples was carried out using X-ray photoelectron spectroscopy (XPS, ESCA-3000, VG Scientific Ltd.) at a pressure of >1 × 10⁻⁹ Torr. The general scan C 1s, O 1s, Ag 1s, and Cd 2p core level spectra were recorded with non-mono-chromatized Mg-Kα radiation (photon energy 1253.6 eV). Baseline correction and peak fitting for all the samples were done using the software package XPS Peak. The core level binding energies (BEs) were aligned with respect to the C 1s binding energy of 285 eV. The collected gas sample was analyzed using a gas chromatography system (GC, Shimadzu GC- 2014) with a Porapak-Q packed column coupled with a TCD detector and using nitrogen (N2-UHP) as a carrier gas.
3. Results and discussion
3.1 Structural study
The CdMoO4 and Ag loaded CdMoO4 samples were synthesized by a hydrothermal method at 180 °C for 24 h. The phase purity of pristine CdMoO4 and Ag decorated CdMoO4 were investigated by their powder X-ray diffraction pattern. Fig. 1 shows the powder XRD patterns of bare CdMoO4 and Ag decorated CdMoO4 samples. Fig. 1(a) shows the XRD pattern of bare CdMoO4 (CMAg-0) which matches well with (JCPDS no. 00-007-0209) of tetragonal phase CdMoO4 having a scheelite-type structure.32 Fig. 1(b–e) show XRD patterns of Ag decorated CdMoO4, compared with pure CdMoO4. Additional reflection peaks at 2θ = 38.37°, 44.78°, and 64.81° are observed, which indicate the presence of Ag and are indexed as the (1 1 1), (2 0 0) and (2 2 0) crystallographic planes of Ag NPs, respectively. These peaks match well with face centered cubic (FCC) metallic Ag NPs (JCPDS card no. 04-0783). For a lower Ag concentration (0.5%) the separate peaks are not clearly observed as it is below the detection limit. Further, it is observed that, with an increase in the concentration of Ag on CdMoO4 the intensity of the Ag peaks increases. It is also observed that there are no large shifts in the positions of the diffraction peaks, which further confirms that the as-synthesized samples are composed of CdMoO4 and Ag phases.
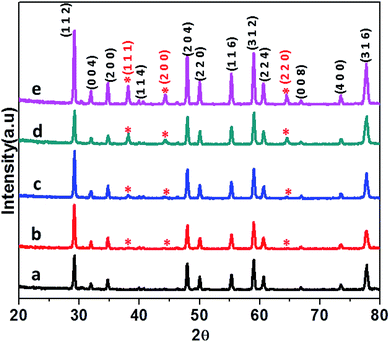 |
| | Fig. 1 XRD patterns of (a) pure CdMOO4, (b) 0.5% Ag@CdMoO4, (c) 1% Ag@CdMoO4, (d) 2% Ag@CdMoO4, (e) 3% Ag@CdMoO4 sample photocatalyst. | |
3.2 Surface and morphological studies
Fig. 2(a–j) show FE-SEM images of the as-prepared CdMoO4 as well as Ag–CdMoO4. The morphology can be seen in a different magnification. From the panoramic view (Fig. 2), it can be seen that the samples are composed of a uniform polyhedron with a relatively regular size distribution and a large aspect ratio. The magnified FE-SEM image (Fig. 2(b)) of the sample (CMAg-0) shows polyhedron-shaped particles of CdMoO4 with sizes in the range 900–1000 nm. Furthermore, Fig. 2(c and d) show the same particle morphology with sizes in the range 800–1000 nm along with the rear density of Ag nanoparticles of 50–100 nm (sample CMAg-0.5). With an increase in the Ag content, agglomeration and coalescence have occurred. Also, the Ag particle density has increased. For sample CMAg-1, the same particle morphology was observed in Fig. 2(e and f), having sizes of 900–1000 nm for CdMoO4 along with dense Ag nanoparticles of sizes 50–100 nm. These particles are uniformly distributed with a smooth and flat surface. The increase in Ag content will increase the rate of diffusion with the coalescence process of neighboring grains which effects an increase in particle size and crystal growth. Moreover, XPS and EDS mapping analysis were performed to support the chemical composition and elemental analysis of the CdMoO4 samples and the results show the presence of Ag, Cd, Mo and O elements.
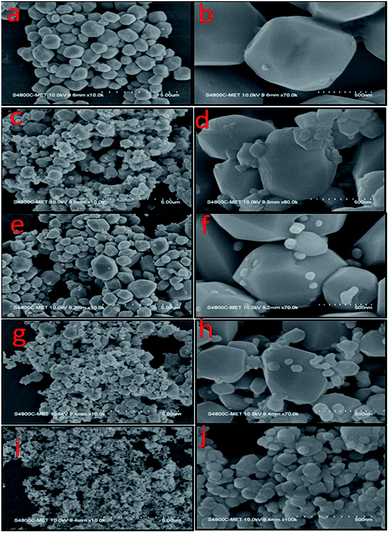 |
| | Fig. 2 FESEM images of (a and b) pure CdMoO4, (c and d) 0.5% Ag@CdMoO4, (e and f) 1% Ag@CdMoO4, (g and h) 2%, (i and j) 3% Ag @CdMoO4 sample photocatalyst. | |
Further, FETEM investigations were performed in order to determine the morphology and crystalline nature of the pristine CdMoO4 microsphere sample and the results are shown in Fig. 3(a–d). The microspheres can be seen in the TEM image in Fig. 3(a). The corresponding TEM images of the CdMoO4 microspheres show an ordered uniform structure. A nanoprism is observed at the edge of a CdMoO4 microsphere, which clearly reveals that the microspheres are composed of nanoprisms (Fig. 3b and c). The measured size of the prism is 800–1000 nm (Fig. 3a and b), which is also in good agreement with the results from the FE-SEM analysis. Fig. 3(c) clearly resolves the lattice fringes of the CMAg-0 sample. The interplanar spacing, i.e. 0.305 nm, can be indexed to the (1 1 2) plane of tetragonal CdMoO4. Fig. 3(d) shows the selected area electron diffraction (SAED) pattern of the CdMoO4 sample, which clearly shows the crystalline nature of the sample. Fig. 4(a–d) show the FETEM images of Ag decorated CdMoO4 microspheres. Fig. 4(a–b) show the polyhedron of CdMoO4 of size 500–900 nm along with the Ag nanoparticles of size 30–40 nm decorated on its surface. Fig. 4(c–d) show the high-resolution transmission electron microscope (HRTEM) images taken from the edge of a nanoparticle, which provide more detailed structural information. Fig. 4(c and d) reveal the lattice fringes of the heterostructure. The interplanar spacing, i.e. 0.305 nm, can be indexed to the (1 1 2) plane of tetragonal CdMoO4, while 0.250 nm corresponds to that of the (1 1 1) lattice plane of cubic Ag. The corresponding SAED pattern of the heterostructure represents the crystalline nature of the material (Fig. 4d). Furthermore, Fig. 5(a–d) show TEM mapping results of Ag@CdMoO4 and clearly show the presence of Cd, Mo, O, and Ag. Fig. 6 clearly shows the presence of Ag on the surface of the CdMoO4 polyhedron.
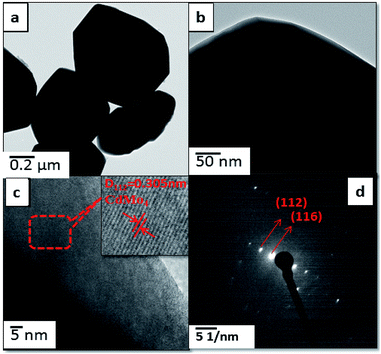 |
| | Fig. 3 FE-TEM images of pure CdMoO4: (a and b) TEM images, (c) HR-TEM image and (d) SAED pattern. | |
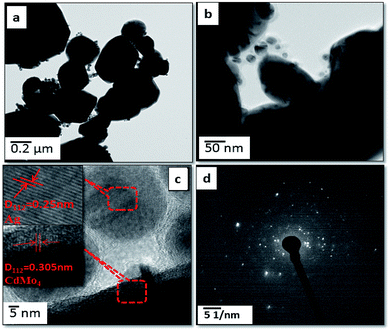 |
| | Fig. 4 FE-TEM images of 2% Ag @CdMoO4: (a and b) TEM images, (c) HR-TEM image and (d) SAED pattern. | |
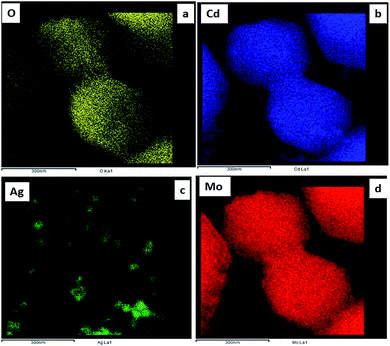 |
| | Fig. 5 FE-TEM mapping images of (a–d) 2% Ag@CdMoO4 (CMAg-2). | |
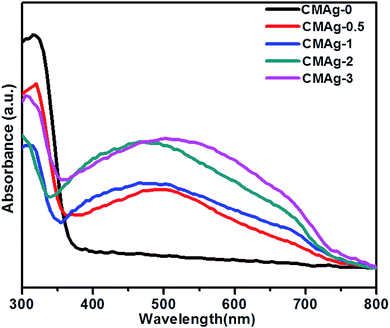 |
| | Fig. 6 UV-Vis absorption spectra of CdMoO4 and Ag decorated CdMoO4. | |
3.3 Optical and electronic studies
The optical properties of CdMoO4 and Ag@CdMoO4 were studied by UV-Vis spectroscopy (Fig. 6). As shown in Fig. 6, a significant absorption edge at wavelength 380 nm was observed, which is assigned to the band gap absorption edge of CdMoO4 and the band gap is calculated to be 3.2 eV, which is slightly lower than the previously reported band gap.33 The slight deviation in band gap is due to the larger particle size. Fig. 6 (CMAg-1 to CMAg-3), shows alignment with the absorption edge of the CdMoO4 (∼420 nm) band gap of 2.9 eV. Also, Ag NP decorated CdMoO4 samples show a strong broad absorption band at around 480 nm, which is attributed to the surface plasmon resonance (SPR) effect caused by the Ag nanoparticles.34 The strong appearance of SPR at 480 nm further confirms the presence of Ag on CdMoO4. The higher value of SPR (480 nm) is due to the size and shape of the Ag nanoparticles and the surrounding liquid medium. It is also observed that, with an increase in Ag concentration, the intensity of the SPR peak with respect to the intensity of the absorption edge at 380 nm also increases in the visible region, which may be due to lowering of the CdMoO4 surface for photon absorption as Ag nanoparticles cover a greater surface area of CdMoO4.
Photoluminescence (PL) is a unique tool to study the migration separation recombination process of photogenerated charge carriers from semiconductor materials. Fig. 7 shows a comparative study of the PL spectra of CdMoO4 and Ag decorated CdMoO4 excited at a wavelength of 325 nm at room temperature. Pure CdMoO4 shows a strong UV emission peak at 340 nm, which is regarded as coming from the charge transfer transition between the O 2p orbital and Mo 3d orbital from the MoO42− ions complex from CdMoO4.36,37 The UV emission peak could be assigned to the near band edge emission of the CdMoO4 band gap. The Ag decorated CdMoO4 shows a strong emission peak at 530–540 nm along with some weak peaks also observable at 450–500 nm.35 The peak could be assigned to the presence of Ag NPs on the surface of CdMoO4 decreasing surface defects and suppressing charge carrier recombination, which is good for improving the photocatalytic activity. In addition to that, the emission peak intensity of CdMoO4 is lowered with the addition Ag NPs, which is in accordance with Stern–Volmer quenching.38,39 The lower peak intensity indicates a lower electron–hole pair recombination rate, and an increase in the lifetime of photogenerated charge carriers is expected to enhance photocatalytic activity.40 In general, photocatalytic activity depends mainly upon the electron–hole pair separation rate, and an optimized amount of Ag NPs shows a large charge utilization for the redox reaction compared with bare CdMoO4.
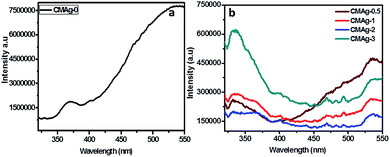 |
| | Fig. 7 PL spectra of (a) CdMoO4, (b) Ag decorated CdMoO4. | |
3.4 Raman study
Raman spectroscopy is an important and powerful tool to characterize the crystallinity of a material and for phase identification. Fig. 8 shows the Raman spectra of pure and Ag decorated CdMoO4 using a 532 nm laser source. Raman spectra with different concentrations of Ag decorated on CdMoO4 and pure CdMoO4 show some additional absorption bands, apart from those recorded for Ag–CdMoO4. In general, for molybdates with a scheelite-type crystal structure the active frequencies in Raman spectra are observed in the range of wavenumbers 900 to 750 cm−1 (stretching modes ν1 and ν3) and 450–250 cm−1 (bending modes ν2 and ν4).41 The observed peaks for the stretching modes of Mo–O bonds in MoO4 tetrahedra are at 867, 825 and 761 cm−1, and the absorption bands with their maxima at 399, 310, 309, and 277 cm−1 can be related to the bending modes of Mo–O bonds in distorted MoO4 tetrahedra with a cationic vacancy near one or two corners of the MoO4 tetrahedron, which are characteristic of CdMoO4.42,43 Similar results were observed in 0.5% Ag decorated CdMoO4. But, at a high concentration of Ag (2%) only the characteristics peaks of CdMoO4 were observed: i.e. 867 cm−1 stretching Mo–O bonds and 310 cm−1 bending Mo–O bonds in distorted MoO4 tetrahedra were observed, but minor peaks were not observed because of the high concentration of Ag on the CdMoO4 surface. Similar results were observed in case of Ag–TiO2.44
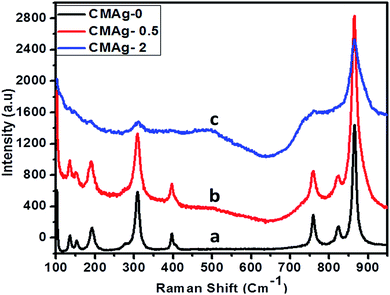 |
| | Fig. 8 Raman spectra of (a) CMAg-0, (b) CMAg-0.5, (c) CMAg-2. | |
3.5 XPS study
The chemical composition and binding energy states of pristine CdMoO4 and Ag decorated CdMoO4 were investigated by X-ray photoelectron spectroscopy. Fig. 9(a) shows a comparative survey spectrum of CdMoO4 and Ag decorated CdMoO4, which indicates the existence of Ag, Cd, Mo and O elements. Fig. 9(b) shows the high-resolution spectra of sample CMAg-0 for the Cd 3d state at a binding energy of 403.01 eV, whereas for sample CMAg-2 a Cd 3d peak was located at a binding energy of 402.91 eV.45 Fig. 9(c) shows the peaks for Mo 3d in sample CMAg-0 located at binding energies of 230.28 and 232.12 eV, attributed to Mo 3d5/2 and Mo 3d3/2 states of the Mo(VI) orbital, respectively.46 Similarly, peaks in the spectrum sample CMAg-2 shifted to 232.0 and 235.2 eV and are ascribed to Mo 3d5/2 and Mo 3d3/2 of the Mo(VI) orbital, respectively, being 0.1 eV higher than the corresponding two peaks in the Mo(VI) in the CMAg-0 sample.47 Fig. 9(d) shows the O 1s spectra for pure CdMoO4 and the Ag decorated CdMoO4 samples CMAg-0 and CMAg-2 both show a strong symmetric peak at a binding energy of 528 eV, which may be due to Cd–O and Mo–O bonds, respectively. Fig. 9(d) shows Ag 3d peaks located at a binding energy of 368.82 eV, and splitting of the 3D doublet at 374 eV is attributed due to presence of reduced silver nanoparticles on the surface of CdMoO4.48 From the above results it is clear that there is a marginal difference in the binding energies, which shows the very slight influence of Ag decoration on the CdMoO4 surface, with an upshift in binding energies of ∼0.3. This shows that the coordination environment surrounding Ag was not influenced by CdMoO4.
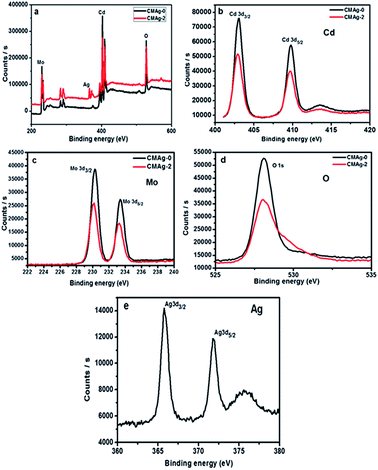 |
| | Fig. 9 XPS spectra of the as-prepared CdMoO4 (black line) and Ag@CdMoO4 (red line) sample: (a) survey, (b) Cd, (c) Mo, (d) O (e) Ag. | |
3.6 Photocatalytic study: photocatalytic activity measurements
As discussed earlier, Ag decorated CdMoO4 is a semiconductor with a narrow band gap that lies in the visible region at room temperature. Considering the good response towards visible light, the photocatalytic activities of Ag decorated CdMoO4 were investigated. Here, we report photocatalytic H2 evolution from water under natural solar light irradiation.
3.6.1 Photocatalytic H2 evolution from H2O splitting. The photocatalytic activity of hydrogen generation of CdMoO4 and Ag decorated CdMoO4 were studied under solar light irradiation using methanol as a scavenger electron donor. A series of experiments were performed using different concentrations of Ag nanoparticles on the surface of CdMoO4 and the results are given in Table 1. The experimental results showed that the maximum hydrogen generation, i.e. 2465 μmol h−1 g−1, is obtained for sample CMAg-2, whereas pure CdMoO4 (CMAg-0), O.5% Ag decorated CdMoO4 (CMAg-0.5), 1% Ag decorated CdMoO4 (CMAg-1) and 3% Ag decorated CdMoO4 (CMAg-3) give 177, 455, 1078, and 2194 μmol h−1 g−1, respectively. Fig. 11 shows time-dependent hydrogen generation using as-synthesized CdMoO4 and Ag decorated CdMoO4 nanostructures. The linearity of the graph shows the continuous and stable hydrogen rate for hydrogen generation. However, pure CdMoO4 shows poor hydrogen evolution due to its wide band gap (3.2 eV).49 In the present case, the maximum hydrogen production, i.e. 2465 μmol h−1 g−1, was obtained for sample 2% Ag decorated CdMoO4 (CMAg-2), which reveals that most charge carrier electrons are available for proton reduction. In the past, Guzman et al.50 reported that methanol suppresses the oxygen evolution rate through the formation of free radicals and also reacts with VB holes irreversibly to reduce the charge carrier recombination rate, which affects quantum efficiency. The mechanism of photocatalytic hydrogen generation from water has been well reported. In this, the semiconductor photocatalyst after interaction with solar light with an energy greater than or equal to the band gap energy generates electrons (in the CB) and holes (in the VB). It causes redox reactions of adsorbed species on a semiconducting material. The photogenerated holes from VB oxidize methanol and get adsorbed on the surface of the semiconductor, producing protons (H+) and free radicals, while the electrons from CB reduce H+ ions into molecular hydrogen.51| |
 | (1) |
Table 1 The H2 generation rates for as-synthesized CdMoO4 and Ag–CdMoO4
| Sr. no. |
Sample |
H2 evolution rate (μmol h−1 g−1) |
| 1 |
CMAg-0 |
177 |
| 2 |
CMAg-0.5 |
455 |
| 3 |
CMAg-1 |
1078 |
| 4 |
CMAg-2 |
2465 |
| 5 |
CMAg-3 |
2194 |
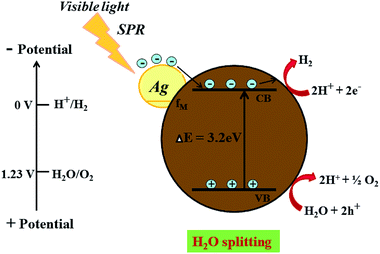 |
| | Fig. 10 Schematic representation for the proposed photocatalysis mechanism of H2 generation on an Ag @cdMoO4 nanocomposite photocatalyst under natural solar light. | |
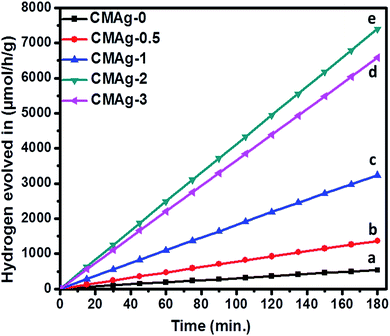 |
| | Fig. 11 Photocatalytic hydrogen generation via H2O splitting with (a) CMAg-0 (black) (b) CMAg-0.5 (red) (c) CMAg-1 (blue), (d) CMAg-2 (green), (e) CMAg-3 (pink). | |
Oxidation:
| | |
CH3OH + h+ → CH2OH + H+
| (2) |
| | |
CH2OH + h+ → HCHO + H+
| (3) |
Reduction:
It is exciting to discuss the improved photocatalytic activity in the present case. It has been well reported that the photocatalytic activity of a photocatalyst depends on its hierarchical morphology, specific surface area, visible light absorption capability, the diffusion rate of charge carriers, electronic structure and, more specifically, on the charge carrier separation rate. The effective separation of electron–hole pairs is attributed to enhanced optical absorption, which is caused by the SPR effect of Ag NPs and high conductivity due to the interaction between metallic Ag and CdMoO4. Previous reports show that decoration of Ag clusters on the surface of the semiconductor tunes the surface properties and improves the interfacial charge separation efficiency between the noble metal and the semiconductor photocatalyst.52,53 Furthermore, the band structure of the semiconductor also affects the photocatalytic activity. In the case of CdMoO4, the VB is predominantly contributed by occupied O 2p orbitals and Cd 4S orbitals, whereas the bottom of the conduction band consists of empty Mo 4d orbitals. Thus, the HOMO (highest occupied molecular orbital) consists of O 2p and the LUMO (lowest unoccupied molecular orbital) consists of Mo 4d. CdMoO4 absorbs light in the UV region (3.2 eV) due to charge transfer between Mo and O atoms from MoO42−.54,55
On the other hand, after the decoration of Ag nanoparticles on the surface of CdMoO4 the band gap energy is enhanced towards a higher wavelength, which might accelerate the photoreduction reaction under sunlight. The enhanced photocatalytic activity being ascribed to the charge carrier recombination rate being effectively suppressed by the decoration of Ag on CdMoO4 is supported by the PL study. However, it is expected that there will be defect states within the CdMoO4 semiconductor. These defects states have low density limiting the visible light absorption. However, Ag decoration on CdMoO4 offers a platform for combining together semiconducting properties with the SPR synergistic behavior of the noble metal to improve overall photocatalytic performance, which could lead to an enhanced electric field in the visible region, which would enhance photoactivity.56,57 Ag was used to produce a Schottky barrier to facilitate electron capture by providing chemically active sites where relevant chemical transformations can take place with lower activation energy barriers than in the semiconductor material. A photocatalysis mechanism for H2 generation under natural solar light is proposed in Fig. 10. This indicates that the recombination rate of the CB electrons with the VB holes was retarded significantly by Ag inlay and the electron lifetime was extended. In this type of system, both charge carriers (electrons and holes) diffuse to the surface of the semiconductor where they drive the two half reactions at the specifically designed sites. The presence of Ag(0) favours absorption in the visible region and proceeds with the migration of photo-induced electrons to the CB of CdMoO4.58 Therefore, energetic charge carrier electrons reach the surface of the semiconductor to be involved in the reduction process to produce H2.59 2% Ag shows good photocatalytic activity while 3% Ag shows lower photocatalytic activity due to the high concentration of Ag, which may act as a recombination center. Furthermore, a reusability study clearly shows the stable evolution of hydrogen. (ESI-S1 and Table S2†).
4. Conclusions
In summary, we have demonstrated a facile hydrothermal route for the synthesis of CdMoO4 with in situ decoration by Ag nanoparticles. A morphological study shows that 5 nm sized spherical Ag nanoparticles are decorated on a CdMoO4 nanoprism. The photocatalytic hydrogen generation activity of the as-synthesized Ag@CdMoO4 photocatalyst was found to be higher than that of pristine CdMoO4. Among all the photocatalysts, 2% Ag decorated CdMoO4 shows enhanced hydrogen generation: i.e. 2465 μmol h−1 g−1 under natural sunlight. Moreover, it was found that, as the concentration of Ag nanoparticles increases, the photocatalytic hydrogen generation rate increases. Thus, the presence of Ag nanoparticles on CdMoO4 promotes the effective separation of photogenerated electron–hole pairs and also shows surface plasma resonance excitation, which enhances the hydrogen generation rate.
Conflicts of interest
No conflict of interest.
Acknowledgements
BBK would like to thank the Ministry of Electronics and Information Technology (MeitY), Government of India for financial support and C-MET Pune for providing research facilities. YAS would like to thank the CSIR for financial support (File no. 09/882(0011)/2017-EMR-I). The authors would like to thank the nanocrystalline materials group for their kind support.
References
- J. A. Turner, Science, 1999, 285, 687–689 CrossRef CAS PubMed.
- M. Faraji, M. Yousefi, S. Yousefzadeh, M. Zirak, N. Naseri, T. H. Jeon, W. Choi and A. Z. MoshfeghIt, Energy Environ. Sci., 2019, 12, 59–95 RSC.
- A. Fujishima and K. Honda, Nature, 1972, 238, 37–38 CrossRef CAS PubMed.
- R. Liu, Z. Zheng, J. Spurgeon and X. Yang, Energy Environ. Sci., 2014, 7, 2504–2517 RSC.
- X. Zou, X. Huang, A. Goswami, R. Silva, B. R. Sathe, E. Mikmeková and T. Asefa, Angew. Chem., Int. Ed., 2014, 53, 4372–4376 CrossRef CAS PubMed.
- S. Sharma and S. K. Ghoshal, Renewable Sustainable Energy Rev., 2015, 43, 1151–1158 CrossRef CAS.
- T. R. Cook, D. K. Dogutan, S. Y. Reece, Y. Surendranath, T. S. Teets and D. G. Nocera, Chem. Rev., 2010, 110, 6474–6502 CrossRef CAS PubMed.
- A. K. Kulkarni, C. S. Praveen, Y. A. Sethi, R. P. Panmand, S. S. Arbuj, S. D. Naik, A. V. Ghule and B. B. Kale, Dalton Trans., 2017, 46, 14859–14868 RSC.
- V. S. Haussener, C. Xiang, J. M. Spurgeon, S. Ardo, N. S. Lewis and A. Z. Weber, Energy Environ. Sci., 2012, 5, 9922–9935 RSC.
- H. G. Park and J. K. Holt, Energy Environ. Sci., 2010, 3, 1028–1036 RSC.
- B. Archana, K. Manjunath, G. Nagaraju, K. B. Chandra Sekhar and N. Kottam, Int. J. Hydrogen Energy, 2017, 42, 5125–5131 CrossRef CAS.
- P. A. Bharad, A. V. Nikam, F. Thomas and C. S. Gopinath, ChemistrySelect, 2018, 3, 12022–12030 CrossRef CAS.
- S. P. Adhikari, Z. D. Hood, K. L. More, I. Ivanov, L. Zhang, M. Gross and A. Lachgar, RSC Adv., 2015, 5, 54998–55005 RSC.
- Y. A. Sethi, R. P. Panmand, S. R. Kadam, A. K. Kulkarni, S. K. Apte, S. D. Naik, N. Munirathnam, M. V. Kulkarni and B. B. Kale, J. Colloid Interface Sci., 2017, 487, 504–512 CrossRef CAS PubMed.
- J. Zhang, Y. Wang, J. Zhang, Z. Lin, F. Huang and J. Yu, ACS Appl. Mater. Interfaces, 2013, 5, 1031–1037 CrossRef CAS PubMed.
- M. Li, X. He, Y. Zeng, M. Chen, Z. Zhang, H. Yang, P. Fang, X. Lu and Y. Tong, Chem. Sci., 2015, 6, 6799–6805 RSC.
- S. Sfaelou, L. C-Pop, O. Monfort, V. Dracopoulos and P. Lianos, Int. J. Hydrogen Energy, 2016, 41, 5902–5907 CrossRef CAS.
- F. E. Osterloh, Chem. Mater., 2008, 20, 35–54 CrossRef CAS.
- X. Chen, S. Shen, L. Guo and S. S. Mao, Chem. Rev., 2010, 110(11), 6503–6570 CrossRef CAS PubMed.
- M. Sathish, B. Viswanathan, R. P. Viswanath and C. S. Gopinath, Chem. Mater., 2005, 17, 6349–6353 CrossRef CAS.
- A. Bhirud, S. Sathaye, R. Waichal, C.-J. Park and B. Kale, J. Mater. Chem. A, 2015, 3, 17050–17063 RSC.
- Q. Xiang, J. Yu and M. Jaroniec, J. Am. Chem. Soc., 2012, 134, 6575–6578 CrossRef CAS PubMed.
- W. Zhao, W. Ma, C. Chen, J. Zhao and Z. Shuai, J. Am. Chem. Soc., 2004, 126, 4782–4783 CrossRef CAS PubMed.
- Y. Shi, Y. Wang, J. I. Wong, A. Y. S. Tan, C.-L. Hsu, L.-J. Li, Y.-C. Lu and H. Y. Yang, Sci. Rep., 2013, 3, 2169–2177 CrossRef PubMed.
- M.-L. Tsai, S.-H. Su, J.-K. Chang, D.-S. Tsai, C.-H. Chen, C.-I. Wu, L.-J. Li, L.-J. Chen and J.-H. He, ACS Nano, 2014, 8, 8317–8322 CrossRef CAS PubMed.
- Q. Dai, G. Zhang, P. Liu, J. Wang and J. Tang, Inorg. Chem., 2012, 51, 9232–9239 CrossRef CAS PubMed.
- L. Zhou, W. Wang, H. Xu and S. Sun, Cryst. Growth Des., 2008, 8, 3595–3601 CrossRef CAS.
-
(a) Y. Liu, L. Ren, X. Qi, Y. Wang, X. Liu and J. Zhong, RSC Adv., 2014, 4, 8772–8776 RSC;
(b) S. R. Kadam, R. P. Panmand, S. P Tekale, S. K. Khore, C. Terashima, S. W. Gosavi, A. Fujishima Bharat and B. Kale, RSC Adv., 2018, 8(25), 13764–13771 RSC.
-
(a) P. A. Bharad, K. Sivaranjania and C. S. Gopinath, Nanoscale, 2015, 7, 11206–11215 RSC;
(b) P. Wang, B. Huang, Y. Dai and M.-H. Whangbo, Phys. Chem. Chem. Phys., 2012, 14, 9813–9825 RSC;
(c) X. Zhang, Y. L. Chen, R.-S. Liu and D. P. Tsai, Rep. Prog. Phys., 2013, 76, 046401 CrossRef PubMed.
- J. Xiong, Z. Li, J. Chen, S. Zhang, L. Wang and S. Dou, ACS Appl. Mater. Interfaces, 2014, 6, 15716–15725 CrossRef CAS PubMed.
- R. Adhikari, S. Malla, G. Gyawali, T. Sekino and S. W. Lee, Mater. Res. Bull., 2013, 48, 3367–3373 CrossRef CAS.
- S. R. Shieh, L. C. Ming and A. Jayaraman, J. Phys. Chem. Solids, 1996, 57, 205–209 CrossRef CAS.
- Y. Liu, L. Ren, X. Qi, Y. Wang, X. Liu and J. Zhong, RSC Adv., 2014, 4, 8772–8778 RSC.
- S. M. H-Mashkani, M. Maddahfar and A. S-Nasab, J. Mater. Sci.: Mater. Electron., 2016, 27, 467–474 Search PubMed.
- P. V. Pimpliskar, S. C. Motekar, G. G. Umarji, W. Lee and S. S. Arbuj, Photochem. Photobiol. Sci., 2019, 18, 1503–1511 RSC.
- R. Grasser, E. Pitt, A. Scharmann and G. Zimmerer, Phys. Status Solidi B, 1975, 69, 359–368 CrossRef CAS.
- Y. Li, S. Tan, J. Jiang, Z. Huang and X. Tan, CrystEngComm, 2011, 13, 2649–2655 RSC.
- F. X. Redl, K.-S. Cho, C. B. Murray and S. O'Brien, Nature, 2003, 423, 968–971 CrossRef CAS PubMed.
- S. Link and M. A. El-Sayed, J. Phys. Chem. B, 1999, 103, 8410–8426 CrossRef CAS.
- S. S. Patil, M. G. Mali, M. S. Tamboli, D. R. Patil, M. V. Kulkarni, H. Yoon, H. Kim, S. S. Al-Deyab, S. S. Yoon, S. S. Kolekar and B. B. Kale, Catal. Today, 2016, 260, 126–134 CrossRef CAS.
- Z. Zhao, Z. Sui, X. Wei, J. Zuo, X. Zhang, R. Dai, Z. Zhang and Z. Dinga, CrystEngComm, 2015, 17, 7905–7914 RSC.
- P. Godlewska, E. Tomaszewicz, L. Macalik, J. Hanuza, M. Ptak, P. E. Tomaszewski, M. Mączka and P. Ropuszyńska-Robak, Mater. Chem. Phys., 2013, 139, 890–896 CrossRef CAS.
- P. Godlewska, E. Tomaszewicz, L. Macalik, J. Hanuza, M. Ptak, P. E. Tomaszewski and P. Ropuszyńska-Robak, J. Mol. Struct., 2013, 1037, 332–337 CrossRef CAS.
- L. Yang, X. Jiang, W. Ruan, J. Yang, B. Zhao, W. Xu and J. R. Lombardi, J. Phys. Chem. C, 2009, 113, 16226–16231 CrossRef CAS.
- J. Bi, Z. Zhou, M. Chen, S. Liang, Y. He, Z. Zhang and L. Wu, Appl. Surf. Sci., 2015, 349, 292–298 CrossRef CAS.
- A. K. Kulkarni, R. P. Panmand, Y. A. Sethi, S. R. Kadam, D. R. Patil, A. V. Ghule and B. B. Kale, New J. Chem., 2018, 42, 17597–17605 RSC.
- H. Zhang, C.-G. Niu, X.-J. Wen, Y. Wang and G.-M. Zeng, Catal. Commun., 2016, 86, 124–128 CrossRef CAS.
- P. Thakur, S. S. Joshi and K. R. Patil, Appl. Surf. Sci., 2010, 257, 1390–1394 CrossRef CAS.
- L. R. Lou, L. Lian, L. H. Zhang and J. Y. Li, Mater. Lett., 2013, 109, 306–308 CrossRef.
- F. Guzman, S. S. C. Chuang and C. Yang, Ind. Eng. Chem. Res., 2013, 52, 61–65 CrossRef CAS.
- A. K. Kulkarni, R. P. Panmand, Y. A. Sethi, S. R. Kadam, S. P. Tekale, G.-H. Baeg, A. V. Ghule and B. B. Kale, Int. J. Hydrogen Energy, 2018, 43, 19873–19884 CrossRef CAS.
- Y. Chen, Y. Wang, W. Li, Q. Yang, Q. Hou, L. Wei, L. Liu, F. Huang and M. Ju, Appl. Catal., B, 2017, 210, 352–367 CrossRef CAS.
- S. Zhao, Z. Cheng, L. Khang, M. Li and Z. Gao, RSC Adv., 2017, 7, 50064–50071 RSC.
- L. Zhen, W. S. Wang, C. Y. Xu, W. Z. Shao, M. M. Ye and Z. L. Chen, Scr. Mater., 2008, 58, 461–464 CrossRef CAS.
- M. Fujita, M. Itoh, T. Katagiri, D. Iri, M. Kitaura and V. B. Mikhailik, Phys. Rev. B: Condens. Matter Mater. Phys., 2008, 77, 155118 CrossRef.
- Y.-C. Pu, G. Wang, K.-D. Chang, Y. Ling, Y.-K. Lin, B. C. Fitzmorris, C.-M. Liu, X. Lu, Y. Tong, J. Z. Zhang, Y.-J. Hsu and Y. Li, Nano Lett., 2013, 13, 3817–3823 CrossRef CAS PubMed.
- Z. W. Seh, S. Liu, M. Low, S. Y. Zhang, Z. Liu, A. Mlayah and M. Y. Han, Adv. Mater., 2012, 24, 2310–2314 CrossRef CAS PubMed.
- S. K. Khore, S. R. Kadam, S. D. Naik, B. B. Kale and R. S. Sonawane, New J. Chem., 2018, 42, 10958–10968 RSC.
- S. S. Rayalu, D. Jose, M. M. Joshi, P. A. Mangrulkar, K. Shrestha and K. Klablunde, Appl. Catal., B, 2010, 257, 1390–1394 Search PubMed.
Footnote |
| † Electronic supplementary information (ESI) available. See DOI: 10.1039/c9ra05581a |
|
| This journal is © The Royal Society of Chemistry 2019 |
Click here to see how this site uses Cookies. View our privacy policy here.  Open Access Article
 c,
Sandip C. Kanaded,
Suresh W. Gosavie,
Milind V. Kulkarni*a and
Bharat B. Kale
 *a
*a
![[thin space (1/6-em)]](https://www.rsc.org/images/entities/char_2009.gif) 000 lux. In a typical photocatalytic experiment, 15 mg of the photocatalyst was dispersed in 25 mL total volume containing 20% methanol (v/v) in aqueous solution. The 45 mL free space of the photoreactor was made airtight with a rubber septum followed by ultrasonication for 5 min for the uniform dispersion of catalyst. The solution mixture was then purged with Ultra High Purity nitrogen gas (UHP 99.999%) to remove all the gases in the headspace of the reactor and dissolved oxygen from the reaction mixture. Before and after irradiation with solar light, the gas in the free space of the reactor was analyzed using gas chromatography (GC). The generated gas was analyzed immediately using GC over a specific time interval.
000 lux. In a typical photocatalytic experiment, 15 mg of the photocatalyst was dispersed in 25 mL total volume containing 20% methanol (v/v) in aqueous solution. The 45 mL free space of the photoreactor was made airtight with a rubber septum followed by ultrasonication for 5 min for the uniform dispersion of catalyst. The solution mixture was then purged with Ultra High Purity nitrogen gas (UHP 99.999%) to remove all the gases in the headspace of the reactor and dissolved oxygen from the reaction mixture. Before and after irradiation with solar light, the gas in the free space of the reactor was analyzed using gas chromatography (GC). The generated gas was analyzed immediately using GC over a specific time interval.


