
 Open Access Article
 This Open Access Article is licensed under a Creative Commons Attribution-Non Commercial 3.0 Unported Licence
Barrier effect of coal bottom ash-based geopolymers on soil contaminated by heavy metals†
Yiqie Donga,
Min Zhouab,
Yuwei Xianga,
Sha Wana,
He Lia and
Haobo Hou *ab
*ab
aSchool of Resource and Environmental Sciences, Wuhan University, Wuhan, China. E-mail: houhb@whu.edu.cn
bHubei Environmental Remediation Material Engineering Technology Research Center, Wuhan, China
First published on 12th September 2019
Abstract
Coal bottom ash (CBA) was modified on the basis of the engineering problems of low resource utilization of CBA and difficulty in treating HMS through alkali activation to synthesize geopolymers and solidify heavy metal-contaminated soil (HMS). The optimal values of geopolymers were selected through response surface methodology. Their mineral compositions, microstructure, and binding energy were determined through X-ray diffraction, X-ray photoelectron spectroscopy, and scanning electron microscopy tests, respectively. The stress–strain curve, the leaching concentration and fraction of heavy metals, and the solidifying mechanism for remolded soil were determined through unconfined compressive strength, leaching toxicity, sequential chemical extraction, and infrared (IR) spectroscopy tests, respectively. Based on these experiments, the following conclusions were presented. The optimum ratios of CBA-based geopolymers were n(Si)![[thin space (1/6-em)]](https://www.rsc.org/images/entities/char_2009.gif) :n(Al) = 2.666, n(Na):n(Al) = 0.687, and n(water):n(binder) = 2.422. The X-ray curves of the geopolymers were obvious hump-like protuberances at diffraction angles of 20–35° and had a dense amorphous structure on the surface. The maximum binding energies of Si 2p and Al 2p decreased to 101.03 and 72.89 eV, respectively. A 3D network polymerized because of strong geopolymerization. The maximum axial stress of the remolded soil was 104.91% higher than that of the undisturbed soil, and the leaching concentration decreased by more than 45.88%. The leaching toxicity met the requirements of standard GB 5085.3-2007. The proportion of the acid-extractable fraction of heavy metals in the remolded soil decreased, whereas the proportion of residual fraction increased. The stretching vibration of Si–O–Si (Al) and the bending vibration of Si–O–Si appeared in the IR spectrum. The soil particles were completely encapsulated by a hardened geopolymer structure, thereby forming a multilayer space-skeleton barrier structure that could greatly improve the mechanical properties.
:n(Al) = 2.666, n(Na):n(Al) = 0.687, and n(water):n(binder) = 2.422. The X-ray curves of the geopolymers were obvious hump-like protuberances at diffraction angles of 20–35° and had a dense amorphous structure on the surface. The maximum binding energies of Si 2p and Al 2p decreased to 101.03 and 72.89 eV, respectively. A 3D network polymerized because of strong geopolymerization. The maximum axial stress of the remolded soil was 104.91% higher than that of the undisturbed soil, and the leaching concentration decreased by more than 45.88%. The leaching toxicity met the requirements of standard GB 5085.3-2007. The proportion of the acid-extractable fraction of heavy metals in the remolded soil decreased, whereas the proportion of residual fraction increased. The stretching vibration of Si–O–Si (Al) and the bending vibration of Si–O–Si appeared in the IR spectrum. The soil particles were completely encapsulated by a hardened geopolymer structure, thereby forming a multilayer space-skeleton barrier structure that could greatly improve the mechanical properties.
1 Introduction
Coal is the main raw material for electric power production. In 2017, 4.49 billion tons of standard coal was consumed in China. Coal combustion can provide power and generate a considerable amount of coal bottom ash (CBA). Many spaces are occupied by stacks of CBA, and rain erosion will cause significantly polluted soil and surface water.1–3 Soil pollution is an important problem worldwide, and 82.8% of soil pollution is caused by heavy metals. The natural environment and human health are seriously threatened by heavy metal-contaminated soil (HMS), and polluted soil needs to be remediated urgently.4,5Poykio et al.6 found that CBA has an environmental risk, especially cadmium in CBA, and the value of the leaching concentration of heavy metals of CBA is higher than the risk assessment criteria. Therefore, scholars investigated harmless-based treatment and resource-based utilization of CBA. Kinnarinen7 developed a new treatment sequence enabling the straightforward and effective recovery of hazardous trace elements from CBA and obtained a positive effect. Samiullah8 studied the adsorption behavior of CBA to purify nickel heavy metal ion-bearing water and verified that CBA has a good effect on water purification. Scientists also found that CBA can be used as a modifier for building materials. Park et al. and Lin et al.9,10 investigated the feasibility of CBA as concrete aggregate and cement mixture. Singh11 utilized CBA in recycled concrete aggregate-based self-compacting concrete blended with metakaolin. Poinot12 synthesized alkali-activated bricks by using CBA, and the compressive strength of bricks reached 11–15 MPa after 28 days of maintenance. Previous studies indicated that CBA has a high utility value.
Soil leaching, phytoremediation, and solidification and stabilization (S/S) are common remediation technologies for HMS. In soil-leaching technology, Isoyama13 used inorganic compounds, such as acid, alkali, and salt, as eluents to remediate HMS. They showed that the binding state of functional groups on soil surface and heavy metals can be broken through acidolysis, complexation, or ion exchange reaction, and pollutants are dissolved from soil. Luo and Tandy14,15 found that EDTA and chelating agents are effective in leaching heavy metals. However, soil-leaching technology has some defects, such as the high costs and secondary treatment of eluents. In phytoremediation technology, Gu and Luo16,17 used various plants to remediate mine soils and industrial sites polluted by heavy metals and achieved obvious effects. Nevertheless, phytoremediation is generally a long process. S/S can reduce the migration of heavy metals by mixing cementitious materials and soil.18,19 Yin20,21 synthesized a new cementitious material containing industrial or agricultural wastes and cement to solidify HMS. The leaching concentration of heavy metals of HMS is greatly reduced, and the unconfined compressive strength is increased obviously. S/S has the advantages of low cost, short treatment time, wide application range, and no pretreatment requirement.
Geopolymers are aluminosilicate inorganic polymers with an amorphous or partially crystallized structure and a 3D spatial network structure;22 they are considered new building materials and environmental functional materials due to their excellent strength and ability of solidified contaminants. Traditional geopolymers are made of calcined kaolin as the main material and silica sand as an auxiliary material; their compressive strength reaches 82.5 MPa.23 Scientists investigated the adsorption of pollutants by geopolymers. Wang24 compound a fly ash-based geopolymer under various conditions to adsorb Cu2+ in water and confirmed that the adsorption properties of the fly ash-based geopolymer are better than those of natural zeolite and fly ash. Geopolymers also have good performance in acid, alkali, and corrosive radiation resistance.25,26
High amounts of SiO2 and Al2O3 are found in CBA,27 and geopolymers can be synthesized by using CBA. However, few studies have focused on solidifying HMS by geopolymers. In the present study, CBA-based geopolymers were synthesized through alkali excitation with reference to traditional synthesis methods for geopolymers. The effects of the strength of the geopolymers were investigated with Design Expert 9.0.5. X-ray diffraction (XRD), X-ray photoelectron spectroscopy (XPS), and scanning electron microscopy (SEM) were performed to analyze the reaction of the CBA-based geopolymers, explore the mechanism of polymerization reaction, and select the best ratio of the geopolymers. HMS with high contents of total cadmium (Cd), total chromium (Cr), and total lead (Pb) was solidified by the CBA-based geopolymers. Unconfined compressive strength and leaching toxicity tests were conducted to evaluate macromechanical and leaching properties, and sequential chemical extraction test (BCR), infrared (IR) spectroscopy test, and SEM were performed to examine the solidifying mechanism.
2 Materials and methods
2.1 Testing materials
CBA was collected from a power plant in Shandong, China. The chemical compositions of CBA are shown in Table S1,† and the particle size distribution is depicted in Fig. S1.† The median diameter of the CBA was 35.687 micron. Before the test was performed, CBA was crushed into powder by using a planetary ball mill, dried at 105 °C until a constant weight was obtained, and stored sealed.HMS was collected from the center of an abandoned chemical site (CLA) and 1 km around the site center (CLB) in Wuhan, China. The selected soil had 1 m depth and belonged to shallow soil, and the natural moisture was 13%. In sampling, the soil was collected longitudinally and sealed in a bag to reduce disturbance caused by external conditions. The content of heavy metals in the soil is shown in Table S2,† and total Cd, total Cr, and total Pb in CLA and CLB exceeded the upper limits of standards (“Environmental quality standard for soils” (GB 15618-1995) and “Soil environmental quality risk control standard for soil contamination of development land” (GB36600-2018)).
2.2 Experimental design
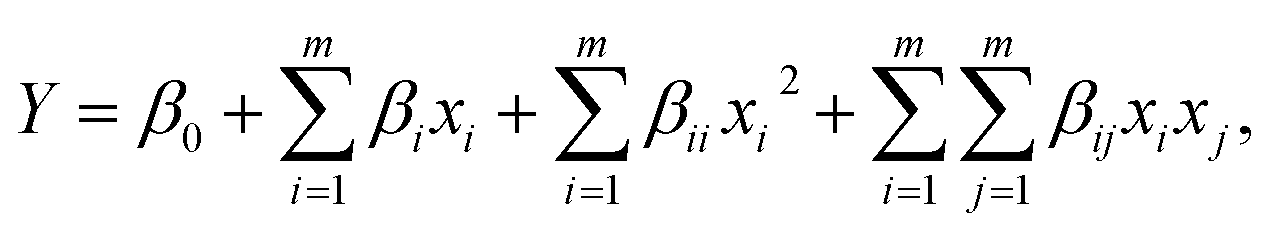
A Box–Behnken experimental design28 and response surface methodology (RSM)29 were used to evaluate the combined effects at three levels. The relationship between factors and response values were expressed via the multivariate quadratic regression equation, and the optimum technological parameters were determined by analyzing the regression equation.30 In the experiment, the molar ratios of silicon to aluminum (n(Si):n(Al)), sodium to aluminum (n(Na):n(Al)), and water to binder (n(water):n(binder)) were chosen as impact factors, and the geopolymer strength was selected as the response value. The experimental range and levels of independent variables are shown in Table S3.† Design Expert 9.0.5 was used to determine the following equation:
 | (1) |
2.3 Material synthesis
The raw materials of the CBA-based geopolymers were CBA, sodium silicate (Na2O3·3SiO2), aluminum correction material (NaAlO2), sodium hydroxide (NaOH), and deionized water. The CBA-based geopolymers were prepared as follows: CBA powder was mixed with an alkali solution and stirred with a magnetic bar for 15 min to ensure sufficient reactions between the particles and the solution. The resulting slurry was cast in cubic molds (20 mm × 20 mm × 20 mm),31 cured in an oven at 80 °C for 24 h, and cured again at ambient conditions for the next 27 days before the test.2.4 Analysis of synthesis mechanism
The geopolymer samples were placed in anhydrous ethanol at the age of 28 days32 and removed after 24 h to terminate the hydration reaction. An unconfined compressive strength test was performed on the cured geopolymer samples by using a universal compression test machine with a capacity of 60 kN at the age of 28 days according to the Chinese Standard JGJ/T 70-2009. The samples of each ratio were tested three times, and the average was taken as the compressive strength after the abnormal value was removed.Chemical and microstructural changes in the raw powdered samples and geopolymers were detected through XRD, XPS, and SEM. Before the test was performed, the geopolymers were dried at 40 °C until a constant weight was achieved. For SEM analysis, the geopolymers were broken into blocks artificially, and the magnification in the test was 5000 times. For XRD and XPS analyses, the geopolymers were broken into powder and passed through a 45 μm sieve. XRD was performed with an X'Pert Pro X-ray diffractometer (Panalytical, Netherlands) with a scan step size of 0.026° per step for 2 h from 10° to 80°, and phase was identified using Jade 6. The samples were subjected to XPS measurements with an ESCALAB 250Xi spectrometer and Al K radiation. The testing conditions were a source power of 400 W and a pass energy of 37.25 eV.
2.5 Effect and mechanism of remolded soils
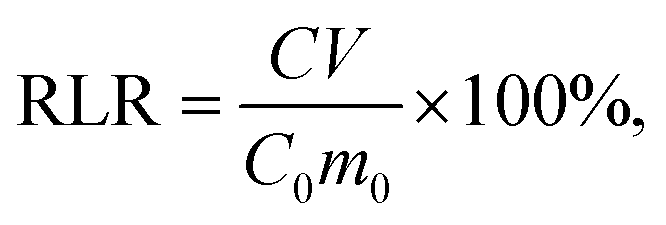
CLA and CLB were undisturbed soils without geopolymer solidification. The optimum ratios of various factors in the geopolymers were selected. The contents of geopolymers and HMS in remolded soils are shown in Table S4.† The remolded soils were formed by pressure under the conditions of maximum compactness and optimum moisture content in accordance with the Chinese Standard JTG E40-2007, and steel mold with a size of φ 50 × 50 mm was used in the test. The remolded soils were maintained for 28 days under the standard conditions of 20 °C and 95% humidity. The unconfined compressive strength test was performed to evaluate the strength of remolded soils, and the speed of load application was 0.5 mm s−1.“Solid waste-extraction procedure for leaching toxicity, sulfuric acid, and nitric acid method” (HJ/T 299-2007) was used to evaluate the leaching characteristics of remolded soils. The leaching solution was a mixture solution with 66.7% sulfuric acid and 33.3% nitric acid, and the liquid–solid ratio was 10:1. The supernatant was taken after 18 h of rotary oscillation, and the content of heavy metals was measured through ICP-AES. The relative leaching rate (RLR) of heavy metals was calculated using the following equation:
 | (2) |
BCR was utilized to detect the heavy metal fraction in remolded soils, Table S5† describes the procedure of chemical fraction distribution. Four fractions of the metals, including acid extractable, reducible, oxidizable, residual were categorized following the methods mentioned below. The liquid–solid mixture produced in each step was centrifuged for 20 minutes. The residue was washed twice with 5 ml of deionized water and centrifuged for the next step, the washing liquid was mixed with the supernatant in each step, and was analyzed for the concentrations of trace elements via ICP-AES. Parallel tests were conducted twice, and the average value was taken as the test result. IR spectroscopy was conducted to characterize the composition of functional groups in remolded soils.
3 Results and discussion
3.1 Synthesis of geopolymers
| Y = −196.48056X12 − 332.325X22 − 27.56719X32 + 47.41667X1X2 − 16.875X1X3 − 106.75X2X3 + 1055.99083X1 + 588.9425X2 + 251.885X3 − 1884.403, | (3) |
:n(Al), n(Na):n(Al), and n(water):n(binder), respectively.Table 1 presents the ANOVA of the response surface model. The F-value denotes the significance in the model equation.33 The model F-value of 168.13 showed that the quadratic model was highly significant. Only a 0.01% chance that a large F-value could occur due to noise was determined.
| Source | Sum of squares | df | Mean square | F-Value | Prob > F |
|---|---|---|---|---|---|
| Model | 1733.66 | 9 | 192.63 | 168.13 | <0.0001 |
| X1 n(Si):n(Al) |
109.15 | 1 | 109.15 | 95.27 | <0.0001 |
| X2 n(Na):n(Al) |
1.61 | 1 | 1.61 | 1.41 | 0.2744 |
| X3 n(water):n(binder) |
0.67 | 1 | 0.67 | 0.59 | 0.4685 |
| X1X2 | 8.09 | 1 | 8.09 | 7.06 | 0.0326 |
| X1X3 | 16.40 | 1 | 16.40 | 14.32 | 0.0069 |
| X2X3 | 72.93 | 1 | 72.93 | 63.66 | <0.0001 |
| X12 | 1316.62 | 1 | 1316.62 | 1149.15 | <0.0001 |
| X22 | 46.50 | 1 | 46.50 | 40.59 | 0.0004 |
| X32 | 81.91 | 1 | 81.91 | 71.50 | <0.0001 |
| Residual | 8.02 | 7 | 1.15 | ||
| Lack of fit | 6.55 | 3 | 2.18 | 5.96 | 0.0588 |
| Pure error | 1.47 | 4 | 0.37 |
The regression and corresponding value of “Prob. > F” less than 0.0500 indicated that the model terms were significant. In this case, X1, X1X2, X1X3, X2X3, X12, X22, and X32 were significant model terms.34 The “Pred. R2” of 0.9385 was in reasonable agreement with the “Adj. R2” of 0.9895, which suggested a good consistency between experimental and predicted values.
The 3D response surfaces were generated with Design Expert (Fig. 1). When interactions of two variables were discussed, the third factor was kept at the zero level. 3D response surfaces and their corresponding contour plots can facilitate the straightforward examination of the effects of experimental variables on responses.35
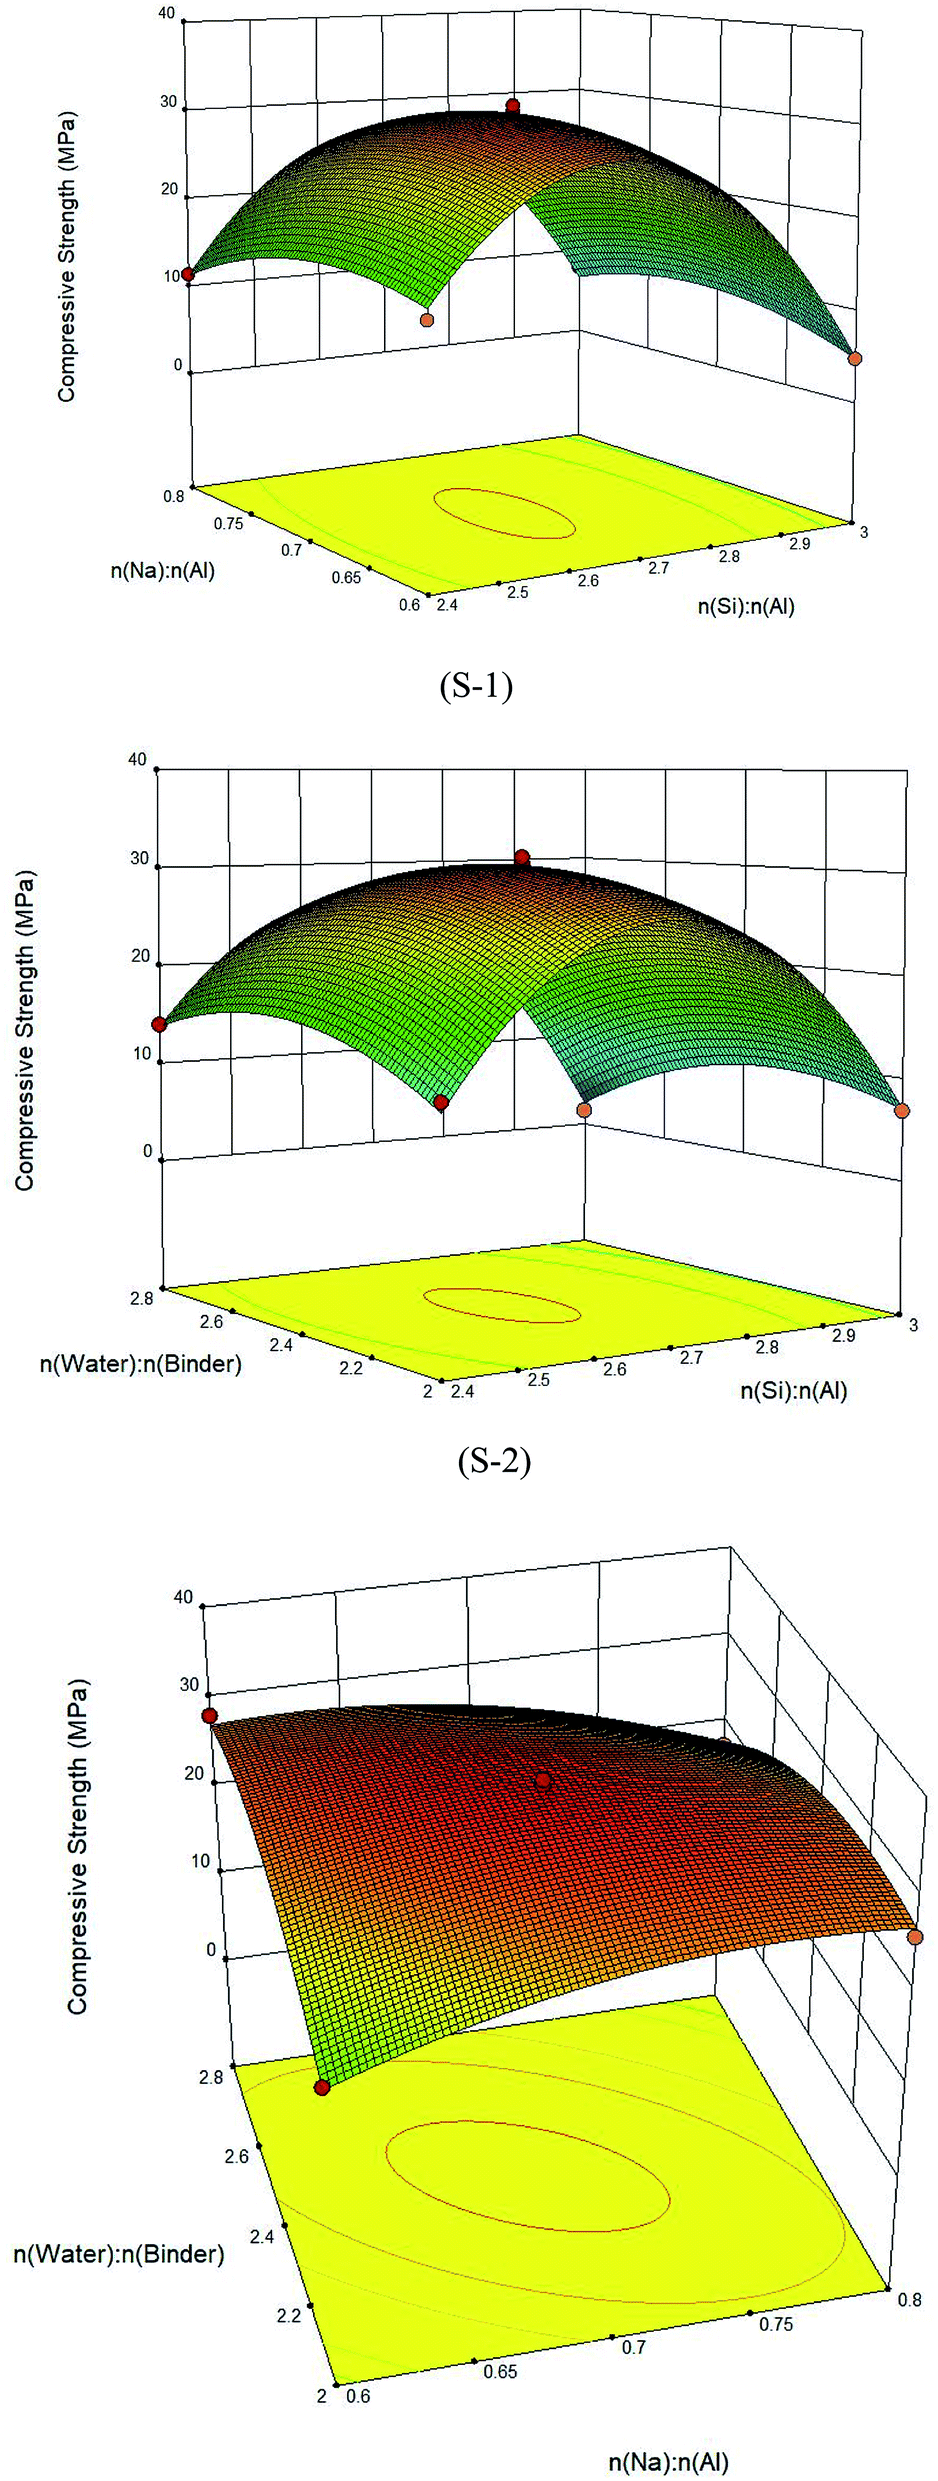 | ||
| Fig. 1 Three-dimensional response surface plots: S-1 n(Si):n(Al) and n(Na):n(Al); S-2 n(Si):n(Al) and n(water):n(binder); and S-3 n(Na):n(Al) and n(water):n(binder). | ||
S-1 reveals that n(Si):n(Al) and n(Na):n(Al) had a strong synergistic effect on strength reduction. The surface shown in the figure was obviously spherical. When n(Si):n(Al) and n(Na):n(Al) increased, the strength first increased and then decreased. The maximum strength appeared at the vertex of the surface. S-2 shows that the influence of n(Si):n(Al) on strength was greater than that of n(water):n(binder). At n(water):n(binder) of 2–2.8, a minimal increase in n(Si):n(Al) had an obvious effect on strength. At n(Si):n(Al) of 2.4–3.0, the change in strength was relatively weak. S-3 depicts the interactive influence between n(Na):n(Al) and n(water):n(binder). At low n(Na):n(Al), strength increased as n(water):n(binder) increased. At n(Na):n(Al) = 0.7, an opposite effect was observed. In Fig. 1, the peak appeared in the middle of the surface, showing that the range of the factors selected was reasonable.
On the basis of the calculation steps defined for the optimization algorithm, we found the following optimal values of the test variables: n(Si):n(Al) = 2.666, n(Na):n(Al) = 0.687, and n(water):n(binder) = 2.422, with strength = 30.74 MPa.
Several additional batch tests were performed in the experimental area of the Box–Behnken design to verify the validity of the proposed model. Three groups were randomly selected to carry out the experiment, and the results were compared with the predicted values of the model. The test results are listed in Table 2. The geopolymer of S1 is shown in Fig. S2.† The tests were in close agreement with the model prediction and showed that the model was effective.
| Sample | n(Si):n(Al) |
n(Na):n(Al) |
n(water):n(binder) |
Strength | |
|---|---|---|---|---|---|
| Predicted | Experimental | ||||
| S1 | 2.666 | 0.687 | 2.422 | 30.74 | 30.4 ± 0.8 |
| S2 | 2.732 | 0.618 | 2.770 | 26.92 | 26.3 ± 0.8 |
| S3 | 2.854 | 0.763 | 2.045 | 22.91 | 23.5 ± 0.7 |
| S4 | 2.471 | 0.719 | 2.816 | 18.31 | 17.9 ± 0.6 |
Mineral facies, such as quartz, mullite, and pyrophyllite, in CBA are binary compounds in the Al2O3–SiO2 system, and silica–aluminate easily decomposes in an alkali solution, thereby increasing the active monomers of Al and Si in the reaction system and promoting polymerization.36,37 CBA is composed of a large amount of iron compounds, which are dissolved by a strong alkali solution and gradually transformed into elemental iron in geopolymers.38 The curves of S1 and S2 were smoother than those of S3 and S4, with fewer diffraction peaks. The curves indicated that the polymerization of S1 and S2 was more intense, which confirmed the trend of strength (Table 2).
Fig. S5† presents the energy spectrum curves of the characteristic points in S1 and S4. S1 was mainly composed of Na, Al, Si, and O. The amorphous substance of aluminosilicate is formed through geopolymerization.40 The element composition of S4 was similar to that of S1, but Fe and K existed in the gaps. The CBA composition was complex. The geopolymer did not completely encapsulate impurities because of the inadequate geopolymerization, and this observation was consistent with the results of XRD analysis.
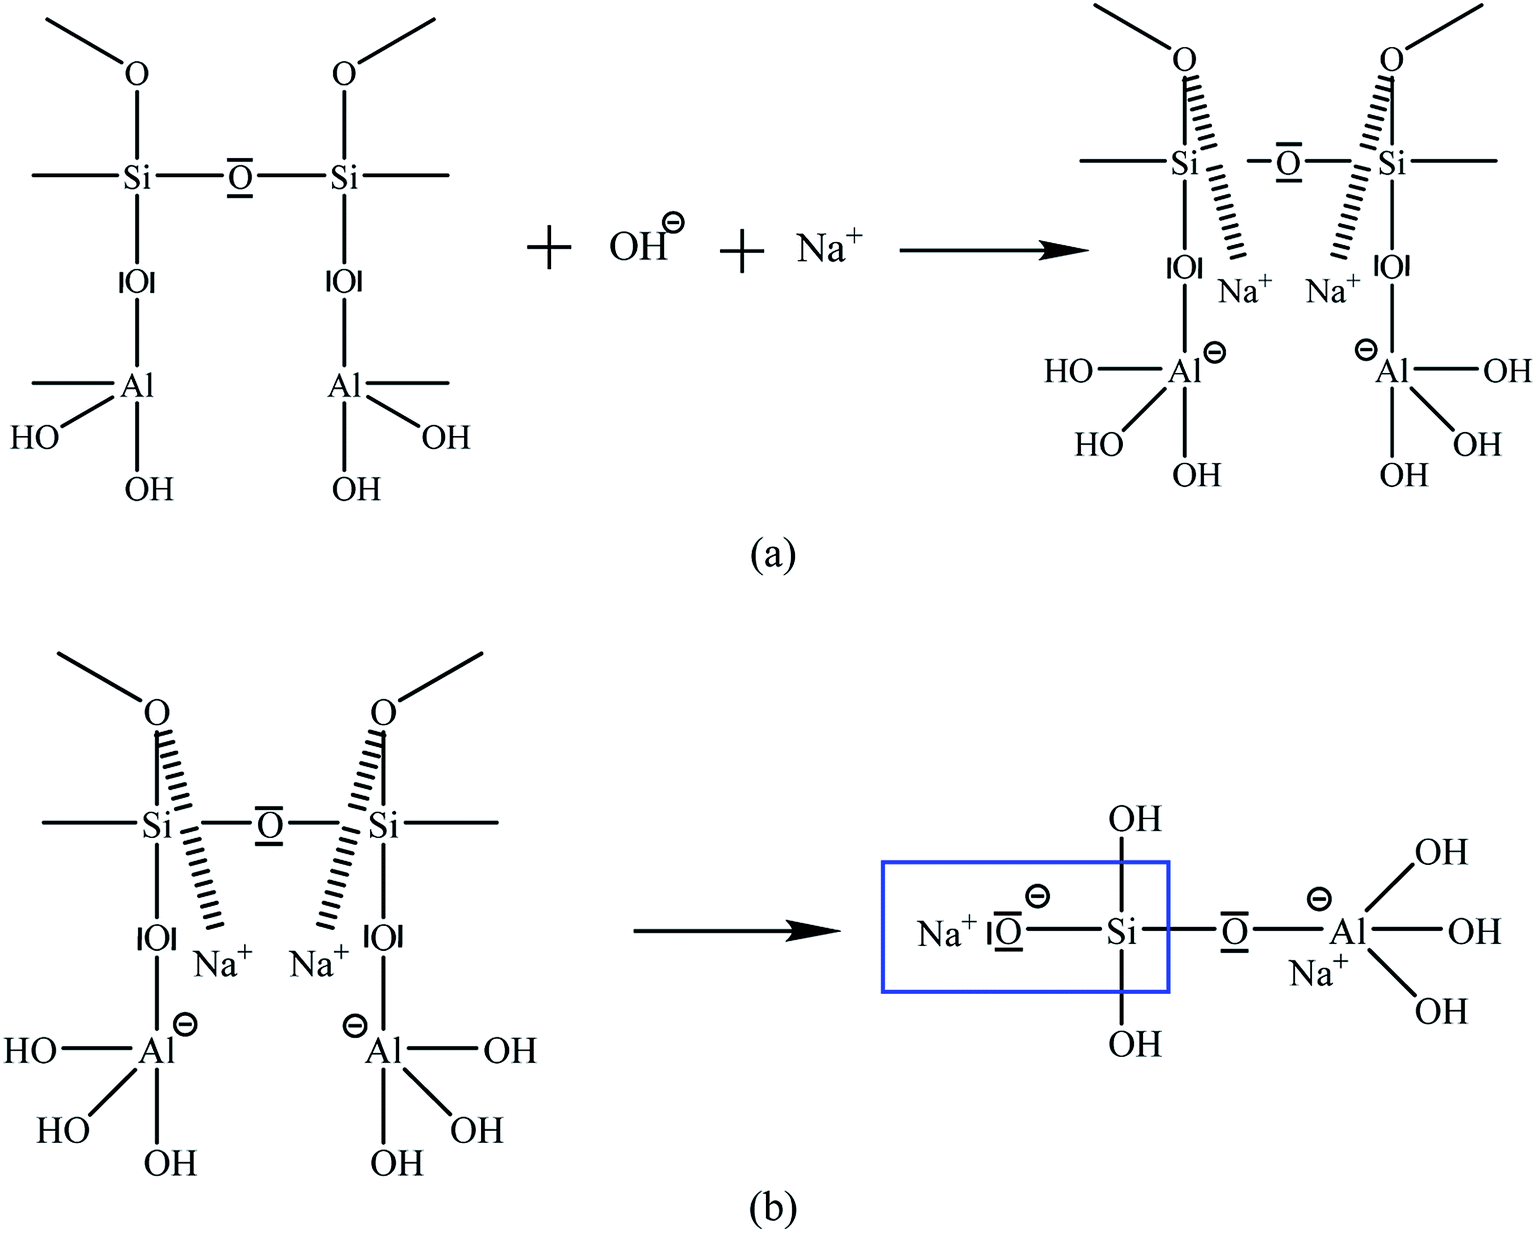
The decrease in maximum binding energies of Si 2p and Al 2p caused coordination forms of Si and Al. Part of the Si in CBA existed in the form of SiO1.02–SiO1.49; with the progress of geopolymerization, the degree of polymerization of Si–O changed. Si–O bond broken down and recombined, and the structures of silicon–oxygen tetrahedron and silicon–oxygen octahedron formed (binding energy: 100.4–101.9). Crystalline-phase Si transformed into polymer or amorphous state.41 Table S1† and the maximum binding energy of CBA present that the other Si and Al existed in the form of SiO2(Al2O3)X (Si 2p binding energy: 102.0–102.6, Al 2p binding energy: 74.1–74.6).42 The chemical bonds were destroyed to form AlOx/Al, Na12[Al12Si12O48]·18H2O, and other structures after alkaline excitation,43 and an amorphous system with 3D network polymerization was formed.44
Each stage of geopolymer formation was not isolation, but it existed in the reaction system as a whole. Fig. 2 demonstrates that after the minerals were attacked by alkali, the crystal structure destroyed from side to inner layer, and alkaline dissociation occurred in the polysiloxane layer, which is the basic unit of geopolymers.45 In Fig. 3, with continuous polymerization, the active monomers of Si and Al polymerized to form a silica aluminum complex gel. Si–O reacted with Na+ to form Si–ONa+ end group in the presence of an alkali activator, and the structure transformed to an aluminosilicate polymer network structure and eventually formed a stable 3D network polymerization structure.46
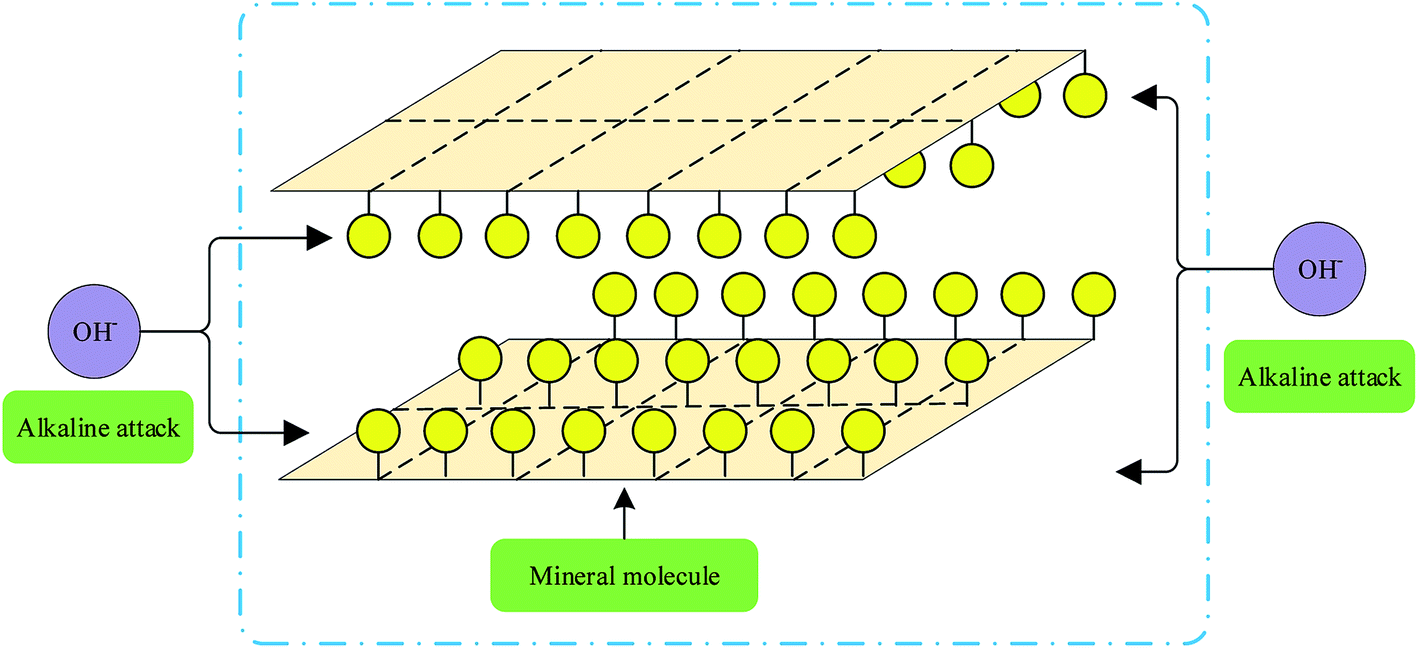 | ||
| Fig. 2 Mineral molecules attacked by alkalinity. | ||
 | ||
| Fig. 3 Synthesis mechanism. | ||
3.2 Effect and mechanism of solidified HMS
The results implied that geopolymer improved the mechanical properties of HMS. The undisturbed soils showed a strong resistance to axial deformation during axial stress loading, indicating that the undisturbed soils had structurality and high ultimate strength. The failure form of the undisturbed soils was plastic failure.
The deformation speed of remolded soils increased linearly as the axial strain increased before the maximum axial stress. When the failure stress was reached, fracture occurred, and the axial stress decreased greatly. The structurality of the remolded soils decreased. The failure form of the remolded soils was brittle fracture. A high content of geopolymer led to an obvious brittle fracture, which was consistent with the destruction of geopolymers.47
The leaching concentration of CLA1 was 58.74–76.25% lower than that of CLA, whereas the leaching concentration of CLA3 was only 22.26–51.63% lower than that of CLA1. The leaching concentration of heavy metals could be greatly reduced by adding 10% geopolymer in HMS. As the geopolymer content increased, the leaching concentration reduction rate decreased. The trends of CLB and CLA were similar. The leaching concentration of CLA was 1.35–2.05 times that of CLB, whereas the leaching concentration of CLA3 was only 1.19–1.53 times that of CLB3. As the geopolymer content increased, the difference in leaching concentration was insignificant.
When geopolymer entered the soil medium, it could fully come in contact with the effective components of soil particles and form a geopolymer layer out of soil particles and heavy metals. Geopolymer could block the leaching of heavy metals due to the stability effect, and the leaching concentration of metals could be greatly reduced. As the geopolymer content increased, the thickness of the geopolymer layer increased. Consequently, the leaching solution experienced difficulty in causing heavy metals to erode.
The RLRs of Cd, Cr, and Pb are shown in Table 3. The RLRs of Cr and Pb were less than that of Cd, indicating that Cr and Pb were stable under a strongly acidic environment, and a strongly acidic leaching solution could not increase their leaching rate. Cr and Pb were incompletely released due to the limited buffer capacity of the leaching solution, resulting in a low reduction rate of leaching concentration. Disturbing ions (such as PO43−, Cl−, and NO3−) in HMS can also react with the effective components in geopolymer, and the RLR can be affected.
| Sample | CLA | CLA1 | CLA2 | CLA3 | CLB | CLB1 | CLB2 | CLB3 |
|---|---|---|---|---|---|---|---|---|
| Cd | 46.51 | 11.04 | 6.71 | 5.34 | 41.90 | 13.10 | 8.96 | 8.29 |
| Cr | 21.04 | 6.74 | 5.92 | 4.35 | 26.88 | 7.69 | 5.11 | 4.89 |
| Pb | 5.38 | 2.22 | 2.02 | 1.73 | 9.52 | 5.15 | 4.39 | 3.77 |
The leaching behavior of heavy metals was determined by the chemical occurrence forms, not by the total amount of heavy metals. The acid-extractable fraction was the heavy metals adsorbed on the mineral surface; with precipitation or coprecipitation, these forms of heavy metals strongly migrate and easily flow into soil or water to cause environmental pollution.48 Residual fraction is stable and difficult to leach.49 As the geopolymer content increased, heavy metals entered the structure system of the solidified blocks through chemical bonding or physical coating; consequently, the content of residual fraction increased gradually.50
The band at 1650 cm−1 reflected the stretching vibration of H2O. The spectral peak of CLA1 at 1650 cm−1 band was sharper than that of CLA3, indicating that some excess water in CLA1 did not participate in the geopolymer reaction.
The micromorphology of remolded soils is depicted in Fig. S12.† Amorphous substances (spot I, spot II) and penetrating gap (spot III) can be clearly observed in the figure. Regular smooth sheet materials appeared at spots IV and V and should be soil particles covered with geopolymer gel. The particles in CLA3 were closely connected, and no gap existed among particles; only a small amount of irregular debris was free on the surface.40
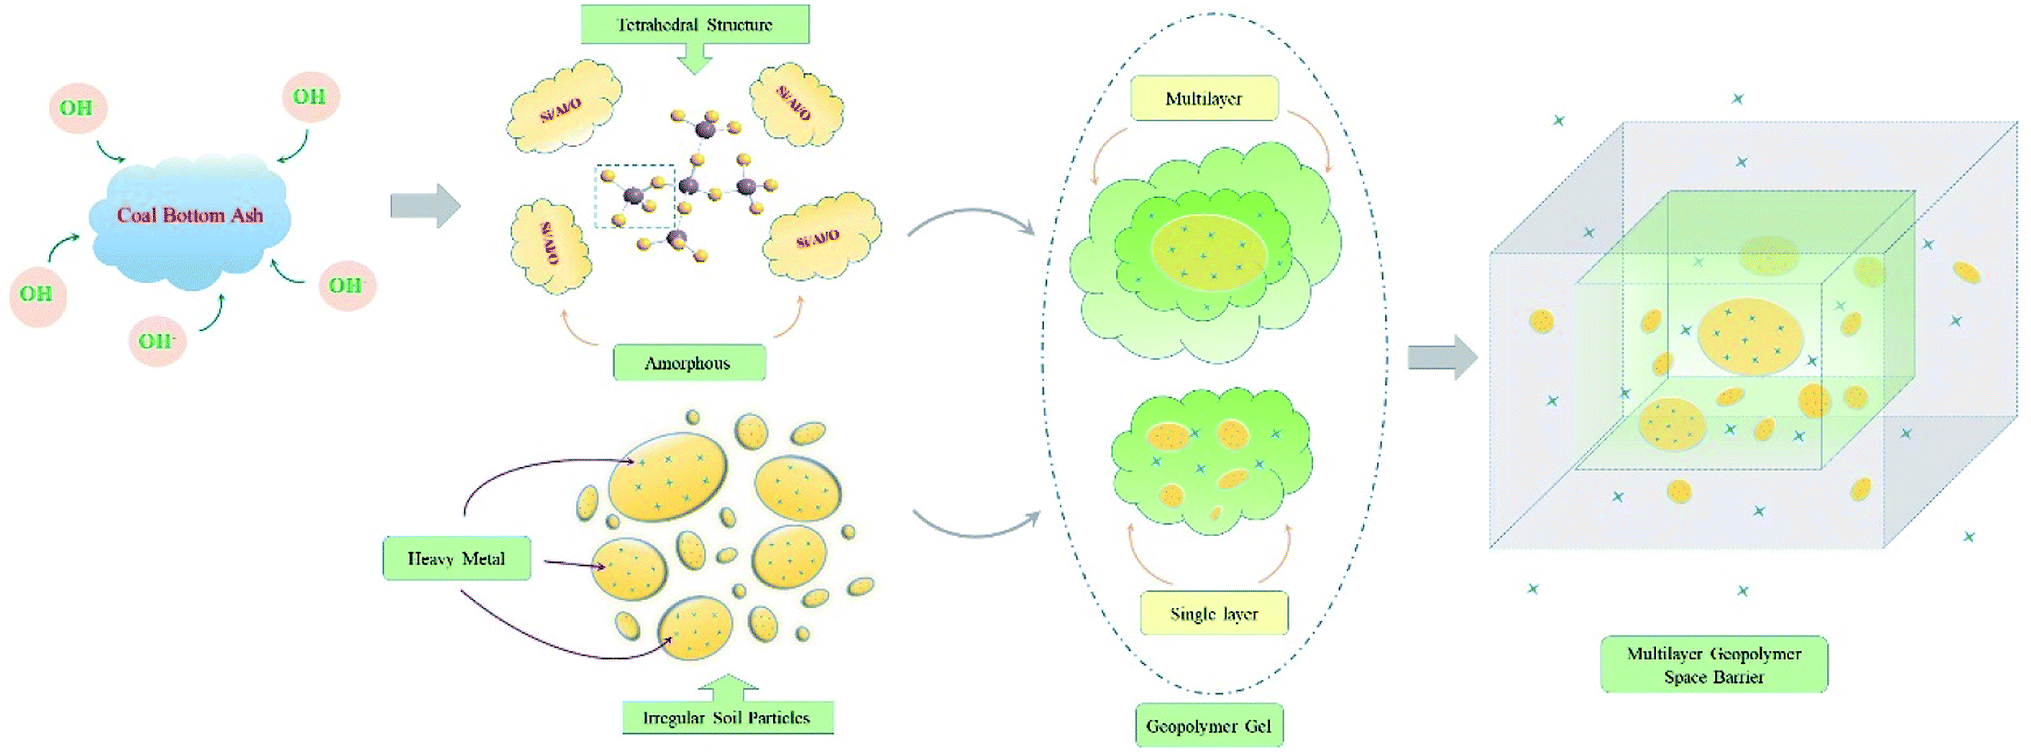
In Fig. 4, heavy metals in soils were mainly concentrated on the surface and in the gaps of particles, and most of them were in a free form. With the infiltration of geopolymer slurry, the soil particles were wrapped by the geopolymer. The particles on the surface were covered with gelatinous slurry, and some heavy metals were absorbed into the gelatinous slurry.51,52 As the maintenance time was extended, the gelatinous slurry gradually hardened to form amorphous geopolymers. Influenced by gravity and intermolecular diffusion forces, some of the slurry would migrate slowly in the soil gaps when the geopolymer content was high. The surface of some particles would be covered with a multilayer geopolymer gel due to differences in slurry hardenability in different positions.
 | ||
| Fig. 4 Solidification mechanism. | ||
After 28 days of maintenance, soil particles were completely encapsulated by the hardened geopolymer, forming a multilayer space-skeleton barrier structure, which could greatly improve the mechanical properties.53 During the maintenance, most of the heavy metals were retained in the soil particles and the inner geopolymer structure, and only a small amount of heavy metals were free from the surface geopolymer structure. The leaching toxicity was consequently reduced, and this observation was consistent with the results described in the previous section.
4 Conclusions
Based on the results of this study, the following conclusions were obtained:(1) The theoretical maximum strength of the geopolymers was 30.74 MPa when n(Si):n(Al), n(Na):n(Al), and n(water):n(binder) were 2.666, 0.687, and 2.422, respectively. The validation value of the ratio was 30.4 ± 0.8. In XRD, no obvious diffraction peak existed in the geopolymers, but obvious hump-like protuberances appeared at diffraction angles of 20–35°. The geopolymers had a dense and uniform amorphous structure. The geopolymers were composed of Na, Al, Si, and O. CBA geopolymerized under alkaline conditions, the chemical bonds were destroyed to form AlOx/Al, Na12[Al12Si12O48]·18H2O, and other structures, and an amorphous system with 3D network polymerization was formed.
(2) The macromechanical property and leaching toxicity of the solidified HMS were significantly improved. The axial stress of the remolded soil with 30% geopolymer was 91.06–104.91% higher than that of the undisturbed soil. The leaching concentration of heavy metals in CLA1 was 58.74–76.25% lower than that in CLA. As the geopolymer content increased, the difference in leaching concentration was insignificant. The leaching toxicity of the remolded soils was lower than the limit set by the standard GB 5085.3-2007.
(3) The proportion of the acid-extractable fraction of heavy metals in the remolded soils decreased, whereas the proportion of the residual fraction increased. The stretching vibration of Si–O–Si (Al) and the bending vibration of Si–O–Si appeared in the IR spectrum. As the geopolymer content increased, the peaks sharpened. The soil particles were completely encapsulated by the hardened geopolymer structure, forming a multilayer space-skeleton barrier structure that could greatly improve the mechanical properties.
Conflicts of interest
There are no conflicts to declare.Acknowledgements
The authors acknowledge the National Key Research and Development Program of China (2017YFC0703307, 2018YFC1801703).References
- S. Oruji, N. A. Brake, L. Nalluri and R. K. Guduru, Constr. Build. Mater., 2017, 153, 317–326 CrossRef CAS.
- X. Ge, M. Zhou, H. Wang, L. Chen, X. Li and X. Chen, Ceram. Int., 2019, 45, 12528–12534 CrossRef CAS.
- H. Koca, D. O. Aksoy, R. Ucar and S. Koca, Environ. Technol., 2017, 38, 1673–1678 CrossRef CAS PubMed.
- Y. Huang, Q. Q. Chen, M. H. Deng, J. Japenga, T. Q. Li, X. E. Yang and Z. He, J. Environ. Manage., 2018, 207, 159–168 CrossRef CAS PubMed.
- W. Han, G. Gao, J. Geng, Y. Li and Y. Wang, Chemosphere, 2018, 197, 325–335 CrossRef CAS PubMed.
- R. Poykio, M. Makela, G. Watkins, H. Nurmesniemi and O. Dahl, Trans. Nonferrous Met. Soc. China, 2016, 26, 256–264 CrossRef CAS.
- T. Kinnarinen, M. Golmaei, E. Jernstrom and A. Hakkinen, J. Hazard. Mater., 2018, 344, 770–777 CrossRef CAS PubMed.
- M. Samiullah, Z. Aslam, A. G. Rana, A. Abbas and W. Ahmad, Water, Air, Soil Pollut., 2018, 229, 113 CrossRef.
- S. B. Park, Y. Il Jang, J. Lee and B. J. Lee, J. Hazard. Mater., 2009, 166, 348–355 CrossRef CAS PubMed.
- K. L. Lin, W. C. Chang and D. F. Lin, Constr. Build. Mater., 2008, 22, 324–329 CrossRef.
- N. Singh, M. Mithulraj and S. Arya, Resour., Conserv. Recycl., 2019, 144, 240–251 CrossRef.
- T. Poinot, M. E. Laracy, C. Aponte, H. M. Jennings, J. A. Ochsendorf and E. A. Olivetti, Resour., Conserv. Recycl., 2018, 128, 1–10 CrossRef.
- M. Isoyama and S.-I. Wada, J. Hazard. Mater., 2007, 143, 636–642 CrossRef CAS PubMed.
- C. L. Luo, Z. G. Shen and X. D. Li, Chemosphere, 2005, 59, 1–11 CrossRef CAS PubMed.
- S. Tandy, A. Ammann, R. Schulin and B. Nowack, Environ. Pollut., 2006, 142, 191–199 CrossRef CAS PubMed.
- L.-P. Gu, J.-J. Kong, K. Chen and Y.-Q. Guo, Ecotoxicol. Environ. Saf., 2019, 180, 130–138 CrossRef CAS PubMed.
- J. Luo, L. Cai, S. Qi, J. Wu and X. S. Gu, J. Environ. Manage., 2017, 204, 17–22 CrossRef CAS PubMed.
- D. H. Moon, M. Wazne, I.-H. Yoon and D. G. Grubb, J. Hazard. Mater., 2008, 159, 512–518 CrossRef CAS PubMed.
- D. Dermatas, D. H. Moon, N. Menounou, X. G. Meng and R. Hires, J. Hazard. Mater., 2004, 116, 25–38 CrossRef CAS PubMed.
- C. Y. Yin, H. Bin Mahmud and M. G. Shaaban, J. Hazard. Mater., 2006, 137, 1758–1764 CrossRef CAS PubMed.
- D. Dermatas and X. G. Meng, Eng. Geol., 2003, 70, 377–394 CrossRef.
- H. Xu and J. S. J. Van Deventer, Int. J. Miner. Process., 2000, 59, 247–266 CrossRef CAS.
- A. Fernandez-Jimenez, A. Palomo and M. Criado, Cem. Concr. Res., 2005, 35, 1204–1209 CrossRef CAS.
- S. Wang, L. Li and Z. H. Zhu, J. Hazard. Mater., 2007, 139, 254–259 CrossRef CAS PubMed.
- M. B. M. Salahuddin, M. Norkhairunnisa and F. Mustapha, Ceram. Int., 2015, 41, 4273–4281 CrossRef.
- F. Pacheco-Torgal, Z. Abdollahnejad, A. F. Camoes, M. Jamshidi and Y. Ding, Constr. Build. Mater., 2012, 30, 400–405 CrossRef.
- Z. Ma, X. Shan and F. Cheng, ACS Omega, 2019, 4, 6854–6863 CrossRef CAS PubMed.
- M. Raynaud, J. Vaxelaire, P. Heritier and J. C. Baudez, Asia-Pac. J. Chem. Eng., 2010, 5, 785–790 CAS.
- M. Pirsaheb, S. Moradi, M. Shahlaei and N. Farhadian, J. Hazard. Mater., 2018, 353, 444–453 CrossRef CAS PubMed.
- K. Yetilmezsoy, S. Demirel and R. J. Vanderbei, J. Hazard. Mater., 2009, 171, 551–562 CrossRef CAS PubMed.
- N. Zhang, H. Li and X. Liu, J. Hazard. Mater., 2016, 314, 172–180 CrossRef CAS PubMed.
- Y. C. Chen, X. Zhou, S. Wan, R. Zheng, J. Tong, H. B. Hou and T. Wang, Constr. Build. Mater., 2019, 211, 646–658 CrossRef CAS.
- H. L. Liu, Y. W. Lan and Y. C. Cheng, Process Biochem., 2004, 39, 1953–1961 CrossRef CAS.
- L.-P. Wong, M. H. Isa and M. J. K. Bashir, Process Saf. Environ. Prot., 2018, 114, 123–132 CrossRef CAS.
- X. Ke, S. A. Bernal, N. Ye, J. L. Provis and J. Yang, J. Am. Ceram. Soc., 2015, 98, 5–11 CrossRef CAS.
- J. He, J. Zhang, Y. Yu and G. Zhang, Constr. Build. Mater., 2012, 30, 80–91 CrossRef.
- N. Ye, J. Yang, S. Liang, Y. Hu, J. Hu, B. Xiao and Q. Huang, Constr. Build. Mater., 2016, 111, 317–325 CrossRef CAS.
- R. Cetintas and S. Soyer-Uzun, J. Build. Eng., 2018, 20, 130–136 CrossRef.
- J. N. Y. Djobo, A. Elimbi, H. K. Tchakoute and S. Kumar, Physical and mechanical properties, RSC Adv., 2016, 6, 39106–39117 RSC.
- J. He, Y. Jie, J. Zhang, Y. Yu and G. Zhang, Cem. Concr. Compos., 2013, 37, 108–118 CrossRef CAS.
- K. Okada, Y. Kameshima and A. Yasumori, J. Am. Ceram. Soc., 1998, 81, 1970–1972 CrossRef CAS.
- A. Ayame and T. Kitagawa, Bunseki Kagaku, 1991, 40, 673–678 CrossRef CAS.
- H. Y. He, T. L. Barr and J. Klinowski, J. Phys. Chem., 1994, 98, 8124–8127 CrossRef CAS.
- C. Li, J. Wan, H. Sun and L. Li, J. Hazard. Mater., 2010, 179, 515–520 CrossRef CAS PubMed.
- M. R. North and T. W. Swaddle, Inorg. Chem., 2000, 39, 2661–2665 CrossRef CAS PubMed.
- A. Bauer, B. Velde and G. Berger, Appl. Geochem., 1998, 13, 619–629 CrossRef CAS.
- G.-H. Cai, S.-Y. Liu and X. Zheng, Constr. Build. Mater., 2019, 204, 84–93 CrossRef CAS.
- C. Chen, P. Zhang, G. Zeng, J. Deng, Y. Zhou and H. Lu, Chem. Eng. J., 2010, 158, 616–622 CrossRef CAS.
- Z. Abbas, A. P. Moghaddam and B. M. Steenari, Waste Manag., 2003, 23, 291–305 CrossRef CAS PubMed.
- W. Shin and Y.-K. Kim, J. Soils Sediments, 2016, 16, 726–735 CrossRef CAS.
- A. I. Badanoiu, T. H. A. Al Saadi, S. Stoleriu and G. Voicu, Constr. Build. Mater., 2015, 84, 284–293 CrossRef.
- P. Duxson, A. Fernandez-Jimenez, J. L. Provis, G. C. Lukey, A. Palomo and J. S. J. van Deventer, J. Mater. Sci., 2007, 42, 2917–2933 CrossRef CAS.
- J. G. Jang, S. M. Park and H. K. Lee, J. Hazard. Mater., 2016, 318, 339–346 CrossRef CAS PubMed.
Footnote |
| † Electronic supplementary information (ESI) available. See DOI: 10.1039/c9ra05542h |
| This journal is © The Royal Society of Chemistry 2019 |