DOI:
10.1039/C9RA05425A
(Paper)
RSC Adv., 2019,
9, 28704-28717
A low molecular weight OLED material: 2-(4-((2-hydroxyethyl)(methyl)amino)benzylidene)malononitrile. Synthesis, crystal structure, thin film morphology, spectroscopic characterization and DFT calculations†
Received
15th July 2019
, Accepted 5th September 2019
First published on 12th September 2019
Abstract
2-(4-((2-Hydroxyethyl)(methyl)amino)benzylidene)malononitrile (HEMABM) was synthesized from 4-[hydroxymethyl(methyl)amino]benzaldehyde and propanedinitrile to obtain a low molecular weight fluorescent material with an efficient solid-state emission and electroluminescence properties comparable to the well-known poly(2-methoxy-5(2′-ethyl)hexoxyphenylenevinylene) (MEH-PPV). The HEMABM was used to prepare an organic light-emitting diode by a solution process. Despite the title compound being a small molecule, it showed optical properties and notable capacity to form a film with smooth morphology (10.81 nm) closer to that of polymer MEH-PPV (10.63 nm). The preparation of the device was by spin coating, the electrical properties such as threshold voltage were about 1.0 V for both HEMABM and MEH-PPV, and the luminance 1300 cd m−2 for HEMABM and 2600 cd m−2 for MEH-PPV. This low molecular weight compound was characterized by SCXRD, IR, NMR, and EI. Besides a quantitative analysis of the intermolecular interactions by PIXEL, density functional theory (DFT) calculations are reported.
1 Introduction
The utilization of soluble conjugate polymers as active materials in optoelectronic applications has opened the possibility of fabricating many different devices. Soluble conjugated polymers, with their advantages of low cost, flexibility, and high absorption coefficient, have shown a possibility for photodetection and photovoltaic applications.1–5 In the past few years, poly(2-methoxy-5(2′-ethyl)hexoxy phenylenevinylene) (MEH-PPV) has been considered as one of the most useful conducting polymers for various optoelectronic applications, such as sensors, organic solar cells, and organic light emitting diodes (OLED) because of its environmental stability, easy conductivity properties and processable deposition.6,7 The MEH-PPV acts as an electron donor (p-type semiconducting polymer) with a relatively low conductivity due to its low hole and electron mobilities when compared to inorganic semiconductor materials.8,9
Soluble organic semiconductors for OLEDs have received important attention since they offer a potential for the production by solution processing techniques such as spin-coating, ink-jet printing or drop casting.10,11 Within this, the conjugated organic polymers have been generally considered as a suitable material for these techniques because of their good film forming capacity.12,13 In recent research, the numerous organic electroluminescent (EL) materials including polymers has focused on solution processable of small molecules which possess advantages of having well-defined structures and being uniformly reproducible.14,15 The parameters for the manufacture conditions such as the dye device, quantum yield, solvent or vacuum deposition, size of the films, etc. are very important to design a new compound with adequate optical properties and to understand structure–properties relationships.16,17 In this manner, synthesis of molecules with a substituent that interacted with the solvents, it's able to form films might be a valuable approach to solution processed OLEDs.18,19 The extended conjugated structures of well-defined small molecules involving alkyl and alkoxyl chains15,20,21 may provide better solubility and higher glass thermal stability while maintaining high purity and reliable molecular structure–property correlations.22
On the other hand, the molecular orientation of organic semiconductors play an important role on small-molecule light-emitting diodes (OLEDs), i.e. the films morphology. Molecular orientation at the microscopic level can be reached in vacuum-deposited amorphous films or in spin coating for a better device performance.23,24 Thin films based on organic small-molecule consist of single units, and each one has specific characteristics, such as geometric and electronic structures, as well as absorption and emission spectra. Therefore, the properties as solids came from of single molecule before fabricating the thin films or crystals. This means that the properties are shifted or changed depending on intermolecular interactions they form. Also, it is interesting that although most chemical phenomena take place in solution, the solvent is usually thought of as a spectator, acting merely as a medium to hold the reactants and allow them to encounter each other by diffusion.25 It well known cases as solvated electrons26 and the charge transfer to solvent transitions27 of simple anions, the solvent creates the electronic states that are of importance, primarily because the electrons of interest are not otherwise bound without the stabilizing presence of the solvent. Moreover, in electron transfer and related reactions, reorganization of the surrounding solvent molecules is the driving force to move the electron from the donor to the acceptor, and thus determines the reaction rate.28–30 Dielectric effects from collective solvent motions can lead to solvatochromic shifts in the electronic absorption spectra of solutes,31,32 and solvent molecules can provide viscous drag that changes the dynamics and thus the branching ratios of unimolecular isomerization reactions.33
Recently, the thin-film assemblies, most of which are amorphous in nature, are easily broken up by trying to deposit electron transporting layer (ETL), because small molecules are typically attached to each other only by weak intermolecular forces such as van der Waals, H-bonding and π stacking interactions. Consequently, the highest reported efficiency of solution-processed small molecule OLEDs still relies on a vacuum-evaporated films, which is not practical for low-cost mass production of scalable devices. The solution process of small molecules encounters major difficulties to fabricate multilayers architectures because of redissolution of underlying layers. This problem can be avoided using orthogonal solvents,34,35 or by cross-linkable the organic functional materials36,37 or designing a compound that showing a highly efficient solution-processed small-molecule for OLEDs.
Alternatively, cyano-substituted pyridine derivatives have been reported as electron-transporting (ET) properties and have been used in OLED devices showing acceptable efficiency.38,39 Herein, malononitrile based HEMABM derivative (Fig. 1) was developed by introducing two electron-withdrawing cyano-group substituents on the HEMAB. Emphasis is in comparing with the commercial polymer MEH-PPV, because it exhibits a long-conjugated system contrary to the title molecule, but the optical properties are very similar.
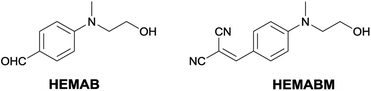 |
| | Fig. 1 Structure of the HEMAB and HEMABM. | |
In this study, it was prepared a small molecular weight compound with orange emission and it can be deposited as thin film by solution process. Their optical and luminance properties are compared with MEH-PPV. The electroluminescent behavior of the emitting material was studied in devices showing a wide spectral to orange. We focused on the study on the effect of the morphology development of solution processed OLEDs and to evaluate the manufacturing related to physical properties. The solvent study with 2-(4-((2-hydroxyethyl)(methyl)amino)benzylidene)malononitrile (HEMABM) was carried out before fabrication of OLED, for which we have chosen different polarities solvents such as MeOH, isopropyl alcohol (IPA), ethyl acetate (EtOAc), THF, chlorobenzene (Ph-Cl), CHCl3, 1,4-dioxane and toluene. It was investigated the morphological and photophysical properties of the solution-processed films by atomic force microscopy (AFM), and the electrical and electro-optical properties of solution-processed, as well as their current–voltage–luminance characteristics are reported. Finally, to identify the origin of optical properties, electronic structure calculations were performed. Further, the intermolecular interactions existing in the crystal structures and their energies were quantified for various dimers by PIXEL and DFT approaches in order to correlate with the intermolecular interaction that play role in solution and in the films.
2 Result and discussion
The HEMABM was obtained by a green synthetic methodology from the 4-((2-hydroxyethyl)(methyl)-amino)benzaldehyde HEMAB with good yield and the corresponding scheme and characterization are shown in ESI†40 (Fig. 1).
2.1 Optical properties of HEMABM in different media
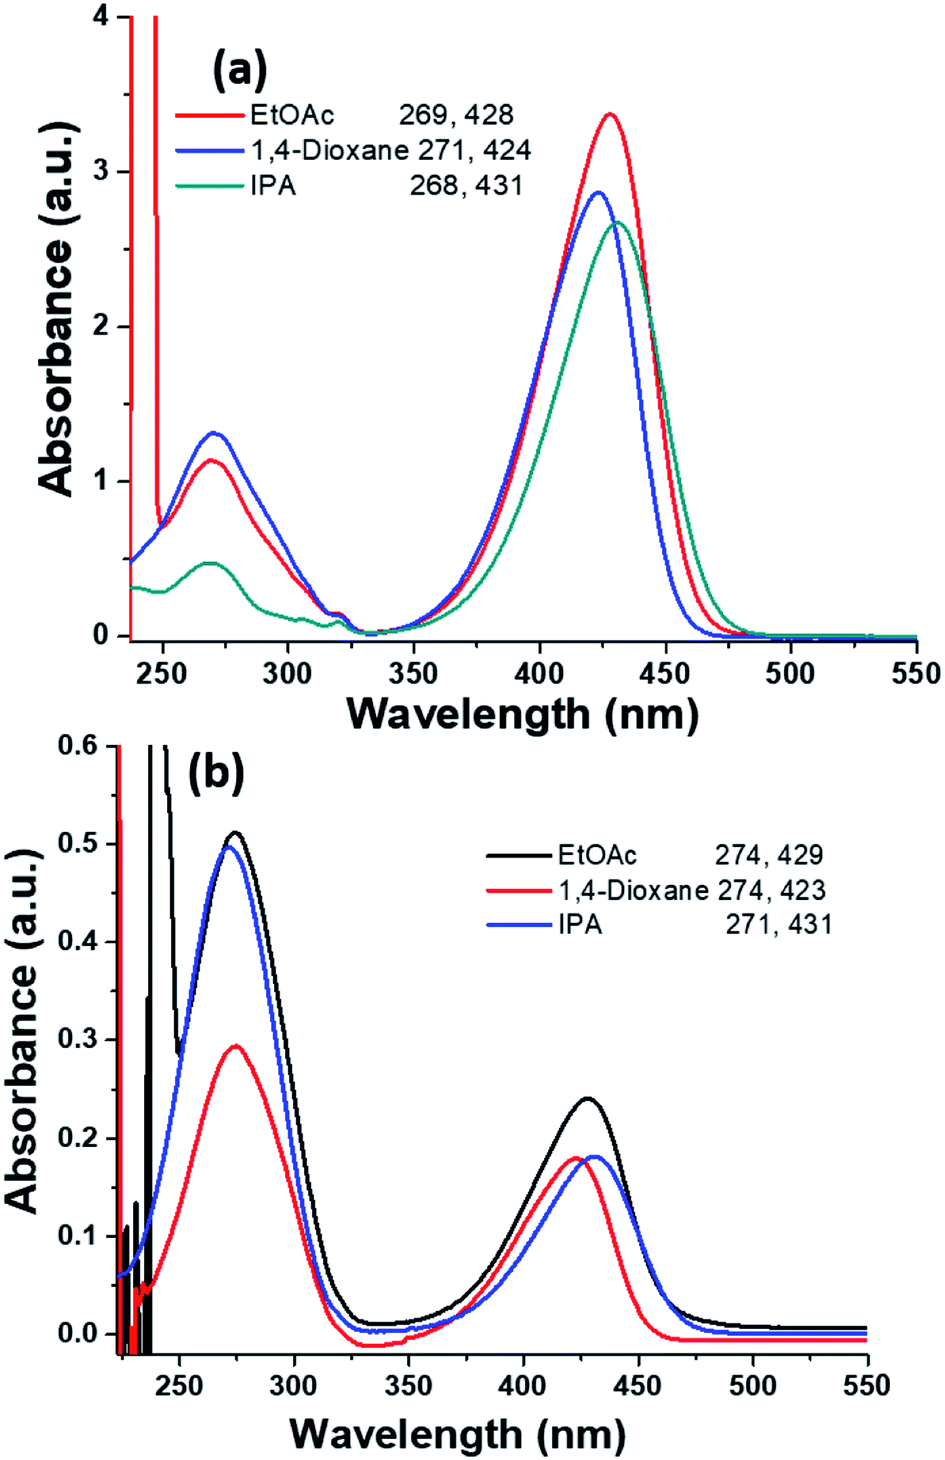
The UV-vis absorption spectra of HEMABM was recorded in different solvents with various polarity (polar aprotic, polar protic and non-polar) at different concentration (5.50 × 10⁻⁵, 2.75 × 10⁻⁵, 1.38 × 10⁻⁵, 0.69 × 10⁻⁵ and 0.34 × 10⁻⁵ M), in order to find the best solvent to form films with acceptable morphologies for OLED.41 The absorbance intensity (molar absorption coefficient) showed a tendency to increase as the polarity decreases, except for ethyl acetate (EtOAc) and 1,4-dioxane (polar aprotic), which indicating that the solute–solvent interaction is affected, Table 1 and Fig. 2. The absorption maxima λmax, were found in 427–430 nm range, but a smaller absorption band emerged below of 300 nm, whose intensity increased with decreasing the concentration. The lowest absorbance intensity was for methanol < isopropyl alcohol (IPA) ≅ 1,4-dioxane < THF < chlorobenzene (Ph-Cl) < CHCl3 < EtOAc < toluene, but the spectra shape did not change with THF, chlorobenzene, CHCl3, toluene. It is noted that the shoulder band intensity is increased with decreasing the concentration of solution in EtOAc, 1,4-dioxane and IPA Fig. 3(a and b).
Table 1 Absorbance values of HEMABM in different solvents at different concentrationsa
| Solvents |
Absorbance (a.u.) |
| Solution |
[M1] |
[M2] |
[M3] |
[M4] |
[M5] |
| [M1] = 5.5 × 10⁻⁵ M; [M2] = 2.75 × 10⁻⁵ M; [M3] = 1.38 × 10⁻⁵ M; [M4] = 0.69 × 10⁻⁵ M; [M5] = 0.34 × 10⁻⁵ M. |
| MeOH |
1.686 |
0.851 |
0.434 |
0.210 |
— |
| IPA |
2.672 |
1.339 |
0.694 |
0.364 |
0.181 |
| EtOAc |
3.370 |
1.711 |
0.888 |
0.465 |
0.240 |
| THF |
3.198 |
1.614 |
0.832 |
0.433 |
0.216 |
| Ph-Cl |
3.332 |
1.693 |
0.854 |
0.427 |
0.219 |
| CHCl3 |
3.344 |
1.652 |
0.899 |
0.584 |
0.336 |
| 1,4-Dioxane |
2.865 |
1.424 |
0.731 |
0.359 |
0.179 |
| Toluene |
4.616 |
2.302 |
1.166 |
0.600 |
0.304 |
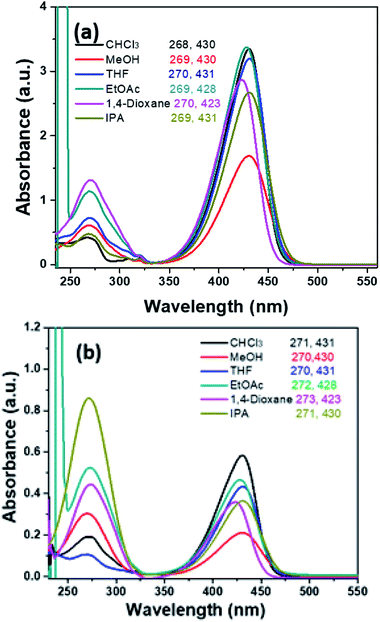 |
| | Fig. 2 The absorption spectra of HEMABM in different solvents with two different concentrations of solution (a) 5.50 × 10⁻⁵ M and solution (b) 0.69 × 10⁻⁵ M. | |
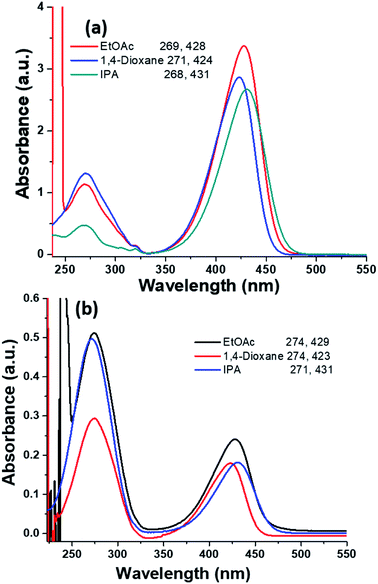 |
| | Fig. 3 The selected absorption spectrum of HEMABM in two different concentrations of solution (a) 5.50 × 10⁻⁵ M and solution (b) 0.34 × 10⁻⁵ M in different solvents. | |
2.2 Theoretical calculation on absorption properties
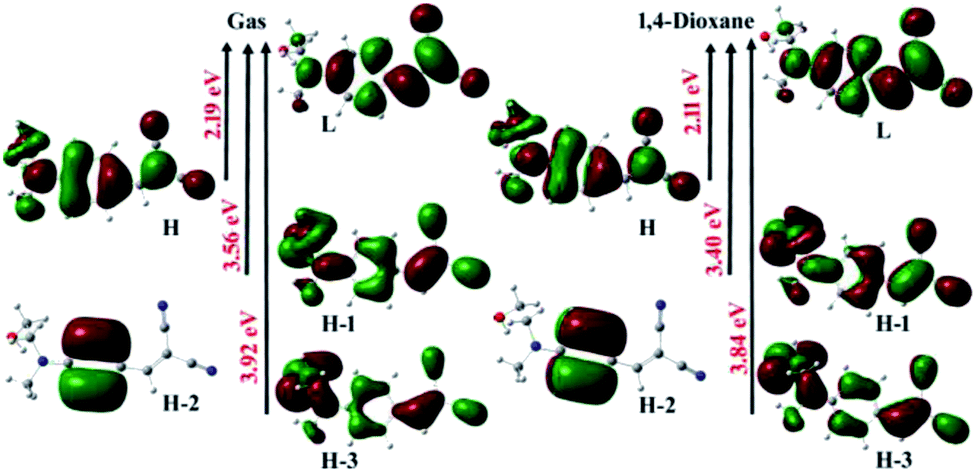
The electronic transitions of HEMABM were computed by TD-DFT method in gas phase, and in solution state (MeOH, IPA, EtOAc, THF, Ph-Cl, CHCl3, 1,4-dioxane and toluene) with PBEPBE/6-311++G (d, p) level of theory. The calculated absorption wavelength (λabs), oscillator strengths (f), and major orbital transitions (in%) for HEMABM are shown Table 2. The most important frontier molecular orbital (Highest Occupied Molecular Orbital) and LUMO (Lowest Unoccupied Molecular Orbital) transitions are presented in the Fig. 4.
Table 2 Experimental λexp (nm) and computed λabs (nm) for HEMABM with PBEPBE/6-311++G (d, p) level of theory
| λabs (DFT) |
eV |
f |
Major transition (%) |
λexp |
| Gas |
| 410 |
3.02 |
0.6718 |
H → L(93) |
— |
| 327 |
3.79 |
0.0921 |
H−1 → L(51); H−3 → L(35) |
— |
| 292 |
4.25 |
0.0594 |
H → L+2(48); H−3 → L(31); H−1 → L(15) |
— |
![[thin space (1/6-em)]](https://www.rsc.org/images/entities/char_2009.gif) |
| Methanol |
| 445 |
2.78 |
0.8412 |
H → L(95) |
430 |
| 352 |
3.52 |
0.1343 |
H−1 → L(77); H−3 → L(17) |
|
| 295 |
4.19 |
0.0876 |
H−3 → L(70); H−1 → L(14) |
269 |
|
| Isopropyl alcohol |
| 447 |
2.78 |
0.8555 |
H → L(96) |
431 |
| 352 |
3.53 |
0.1314 |
H−1 → L(77); H−3 → L(18) |
|
| 296 |
4.19 |
0.0872 |
H−3 → L(70); H−1 → L(14) |
268 |
|
| Ethyl acetate |
| 443 |
2.80 |
0.8499 |
H → L(96) |
428 |
| 347 |
3.57 |
0.1257 |
H−1 → L(74); H−3 → L(21) |
|
| 295 |
4.20 |
0.0914 |
H−3 → L(67); H−1 → L(17) |
269 |
|
| THF |
| 445 |
2.78 |
0.8600 |
H → L(96) |
430 |
| 349 |
4.61 |
0.1110 |
H−1 → L(75); H−3 → L(20) |
|
| 295 |
4.20 |
0.0895 |
H−3 → L(68); H−1 → L(18) |
270 |
|
| Chlorobenzene |
| 449 |
2.76 |
0.8882 |
H → L(97) |
433 |
| 348 |
3.57 |
0.1219 |
H−1 → L(75); H−3 → L(20) |
|
| 296 |
4.20 |
0.0873 |
H−3 → L(68); H−1 → L(16) |
— |
|
| CHCl3 |
| 445 |
2.79 |
0.8686 |
H → L(100) |
431 |
| 346 |
3.58 |
0.1224 |
H−1 → L(74); H−3 → L(22) |
|
| 295 |
4.20 |
0.0900 |
H−3 → L(67); H−1 → L(17) |
270 |
|
| 1,4-Dioxane |
| 439 |
2.83 |
0.8574 |
H → L(96) |
424 |
| 339 |
3.66 |
0.1169 |
H−1 → L(63); H−3 → L(27) |
|
| 294 |
4.22 |
0.0928 |
H−3 → L(62); H−1 → L(21) |
271 |
|
| Toluene |
| 442 |
2.81 |
0.8769 |
H → L(97) |
427 |
| 340 |
3.64 |
0.1168 |
H−1 → L(70); H−3 → L(26) |
|
| 294 |
4.22 |
0.0911 |
H−3 → L(63); H−1 → L(20) |
— |
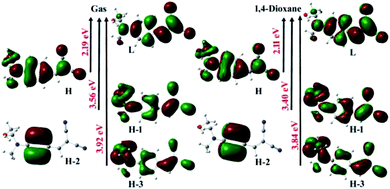 |
| | Fig. 4 The important frontier molecular orbitals of HEMABM calculated by using PBEPBE/6-311++G (d, p) level of theory in gas phase and in 1,4-dioxane. The orbitals plotted with isovalue of 0.02 Å−3. | |
From Table 2, the computed λmax absorption found at 410 nm in the gas phase and in the range of 439–449 nm in different solvents which belongs to the H → L transition. The second absorption is found at 327 nm in gas and 339–349 nm in solvents which belongs to H−1 → L and H−3 → L transitions. Additionally, another weak absorption is found in the range of 290–300 nm in gas and solvents which belongs to H−3 → L and H−1 → L transitions. The earlier intense (H → L) transition is might be due to the intermolecular charge transfer transition and the latter two absorptions belong to π → π* and n → π* transitions, respectively.
From the experimental, we found two absorption bands, the λmax in the range of 430–427 nm and a smaller absorption band emerged below 300 nm as mentioned earlier. Experimental λmax is may be due to CT and π → π* transitions and latter smaller absorption belongs to n → π* transitions, respectively. Because the absorption intensity for λmax (in experimental) is decreased as decreasing the concentrations of solution (Fig. 2) as described earlier. Further, to understand CT transition between the molecules, we carried out the NBO analysis for most stabilized dimer (D1) which formed by the strong O–H⋯N intermolecular interaction. Crystallography information and the intermolecular interactions in crystal structure of HEMABM is depicted in the next section. The NBO analysis suggested that the charge transfer occur between the lone pair electron of N2 atom and the antibonding orbital of O1–H1(O) bond and it is stabilized with 6 kcal mol−1.
The energy gap (ΔE(L–H)) is nearly the same in most of the solvents (2.02–2.07 eV) except the 1,4-dioxane and toluene (2.11 eV), see Table 3. It is interesting to note that the HOMO–LUMO energy level of HEMABM is very closer to the HOMO–LUMO of MEH-PPV (HOMO = 5.3 eV, LUMO = 3.0 eV).42 But, the ΔE(L–H) value for MEH-PPV is slightly higher than the HEMABM. This difference is mainly arising from the energy levels of LUMO orbital in HEMABM (Table 3). We observed that the ΔE(L–H) value is increased with decreasing the polarity of the solvent except CHCl3.
Table 3 The computed HOMO, LUMO, ΔE(L–H) energy (in eV) and solvation energy (in kcal mol−1) for HEMABM with PBEPBE/6-311++G (d, p) level of theory
| Solvents |
HOMO |
LUMO |
ΔE(L–H) |
Solvation energya |
| Energy difference between the optimized structure of the gas phase and in respective solvents. |
| Gas |
−5.53 |
−3.34 |
2.19 |
— |
| MeOH |
−5.29 |
−3.27 |
2.02 |
13.24 |
| IPA |
−5.30 |
−3.27 |
2.03 |
12.86 |
| CHCl3 |
−5.35 |
−3.28 |
2.07 |
10.19 |
| EtOAc |
−5.33 |
−3.28 |
2.05 |
10.91 |
| THF |
−5.33 |
−3.28 |
2.05 |
11.45 |
| Ph-Cl |
−5.33 |
−3.28 |
2.05 |
10.77 |
| 1,4-Dioxane |
−5.41 |
−3.30 |
2.11 |
6.64 |
| Toluene |
−5.40 |
−3.29 |
2.11 |
7.07 |
Briefly, the least ΔE(L–H) value obtained in methanol (2.02 eV) and highest value obtained in toluene and 1,4-dioxane (2.11 eV). The computed solvation energy for HEMABM in different solvents are listed in Table 3 and we found that the solvation energy is increased with increasing the solvent polarity. The very low solvation energy is observed in 1,4-dioxane with 6.64 kcal mol−1 and this may be a reason for the formation of excellent morphology in the 1,4-dioxane mixture.
2.3 Preparation and characterization of the HEMABM films
To study the film morphology and optical properties, we prepared solutions with 4.5 mg of the HEMABM in 0.3 ml of different solvents shown in Table 4. The appropriate solvents were selected based on the solubility test and based on the boiling point of respective solvent. The HEMABM was partially soluble in chlorobenzene, toluene and IPA at room temperature, but the homogeneous solution was obtained at 80 °C. With slow cooling of this mixture into room temperature crystals were appeared in toluene mixture and other solvent mixtures (in Ph-Cl and IPA) retained as such.
Table 4 HEMABM solubility properties used in the film's preparationsa
| Solvent |
rt |
85 °C |
| rt = room temperature; δs = partially soluble; s = completely soluble. |
| MeOH |
s |
S |
| IPA |
δs |
S |
| EtOAc |
s |
S |
| THF |
s |
S |
| Ph-Cl |
δs |
S |
| CHCl3 |
s |
S |
| 1,4-Dioxane |
s |
S |
| Toluene |
δs |
S |
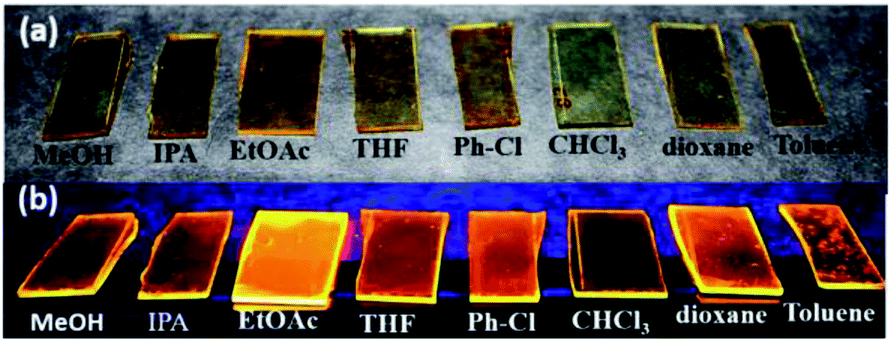
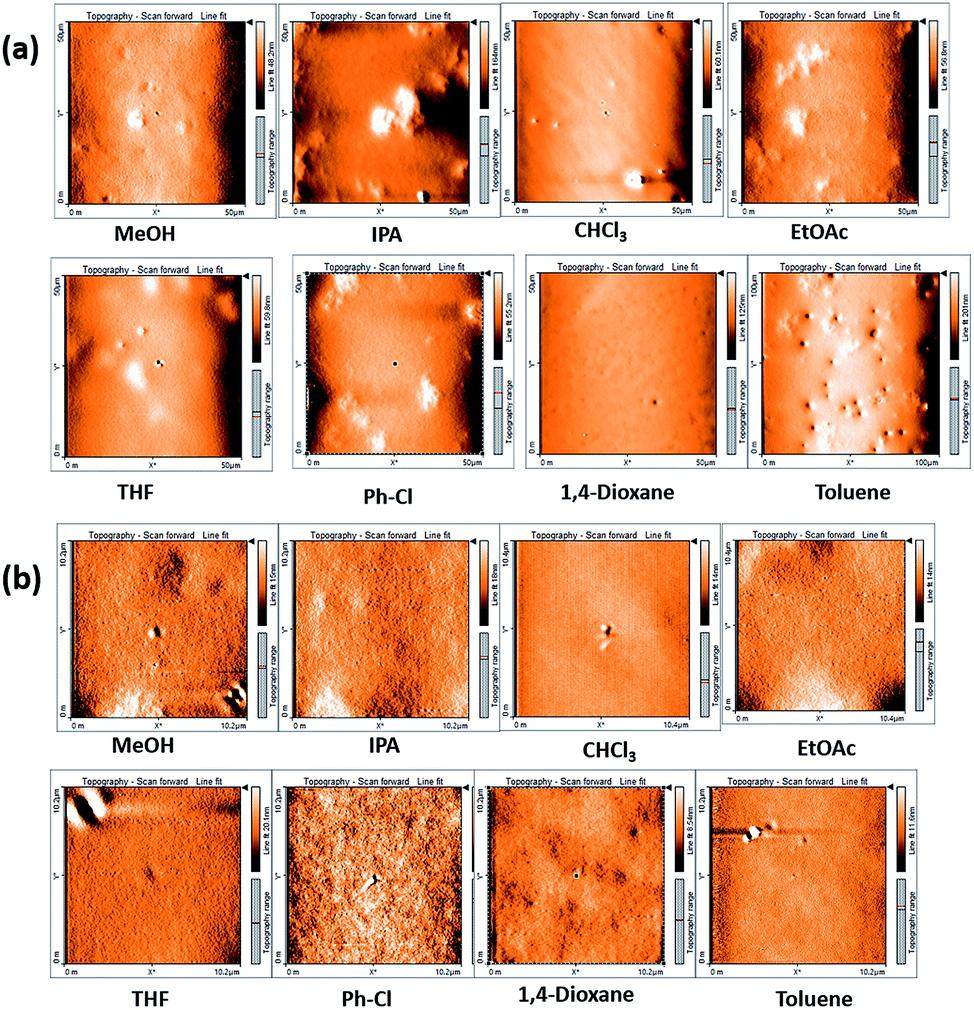
To investigate the distinctive nature of small molecule HEMABM films from solution-processed, solutions were prepared in MeOH, IPA, EtOAc, THF, Ph-Cl, CHCl3, 1,4-dioxane and toluene to analyze its quality and morphology by AFM, Fig. 5. The HEMABM solution preheated at 85 °C for 20 min (exception in case of the MeOH, CHCl3 and THF) was deposited on glass substrate, Fig. 6(a). The glass substrate was previously coated with PEDOT:PSS polymer layer with around 40 nm and dried at 120 °C for 20 min to better HEMABM adhesion. The HEMABM films were analyzed by AFM in order to know the quality and morphology. The AFM results suggested that the good homogeneity surface with all the solvents and total coverage area of HEMABM films excepted to the toluene solution (Fig. 6(b)).
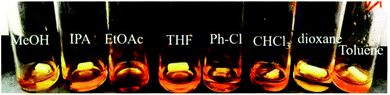 |
| | Fig. 5 The HEMABM in different solvents. | |
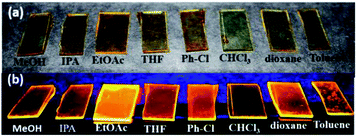 |
| | Fig. 6 HEMABM film under (a) normal light and (b) UV-vis lamp. | |
In the case of toluene mixture, a star shaped HEMABM crystals were grown in the glass substrate after the drying a couple of hours. The film is not homogeneous, it has gaps, agglomerates and crystals. Only some portion of the film was regular and its morphology has an average roughness of 1.0 nm. The film images at 100 μm showed some homogeneous area with small holes and its corresponding image on the left side of the Fig. 7 which showed the needle-shaped crystals formed on the film (Fig. 7). The morphology and roughness of each film with all solvents Table 5 and Fig. 8 are compared at 10–20 μm scale. We can see from the whole films the formation of agglomerates with a length of 10–20 μm. However, the most homogeneous films were obtained using MeOH, 1,4-dioxane and Ph-Cl, but on a smaller scale in homogeneous areas the morphology is comparable.
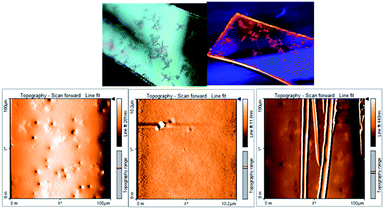 |
| | Fig. 7 Representative AFM of the morphology for HEMABM solution deposited and HEMABM crystals. | |
Table 5 Average roughness of HEMABM film by solution with different solvents
| Solvents |
Roughness (nm) |
| Scan areaa |
Scan areab |
| 10 × 10 μm. 20 × 20 μm. |
| MeOH |
8.11 |
1.302 |
| IPA |
16.04 |
1.464 |
| EtOAc |
9.40 |
1.200 |
| THF |
10.16 |
1.202 |
| Ph-Cl |
9.12 |
0.556 |
| CHCl3 |
9.99 |
0.905 |
| 1,4-Dioxane |
11.47 |
0.651 |
| Toluene |
33.05 |
0.933 |
 |
| | Fig. 8 Representative AFM image of the morphology for films of compound HEMABM at (a) 10 μm scale and (b) 20 μm scale. | |
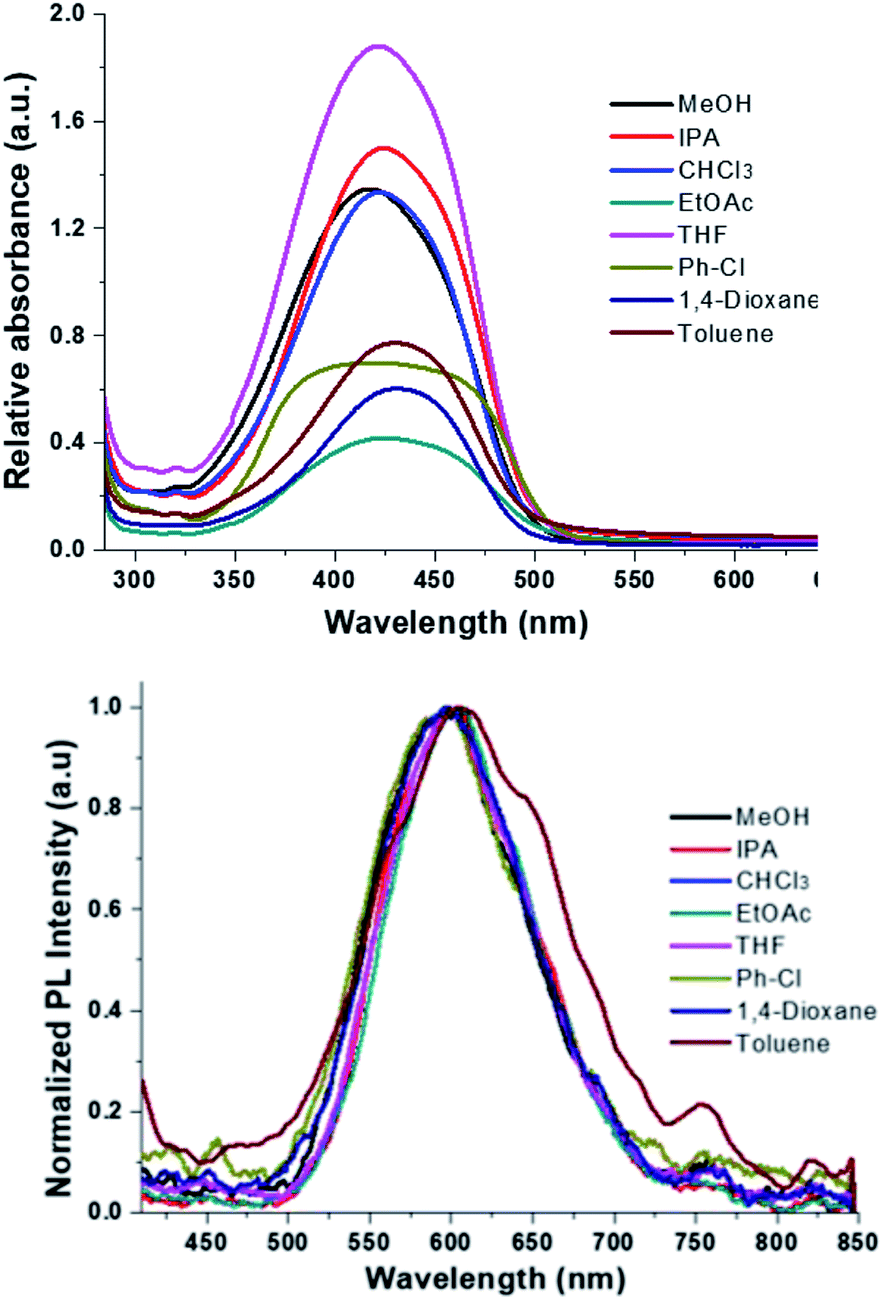
The Fig. 9 shows the absorption and photoluminescence of the films for each solvent used. The λmax absorption maximum is between 420 nm and 434 nm for MeOH → Ph-Cl, it was not observed a solvent effect on absorption wavelength at 421 nm, which corresponding to the transition observed for HEMABM in solution, only the band shape is broad, as it was expected for solid state.30,42
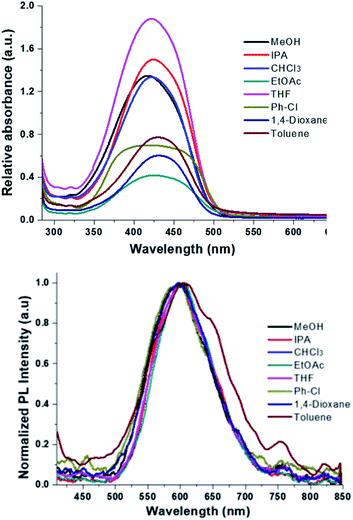 |
| | Fig. 9 HEMABM absorption and PL emissions spectra of the films (glass substrate) prepared with all solvents. | |
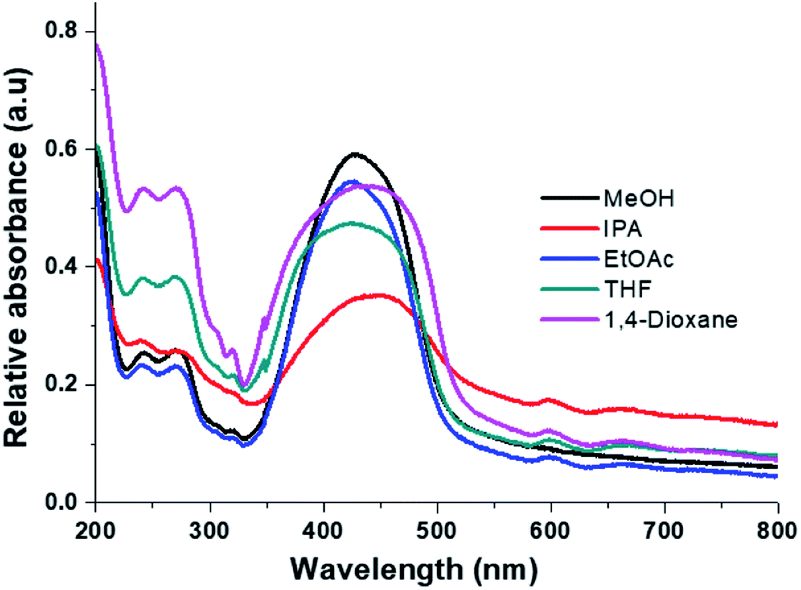
From film thickness the HEMABM concentration was calculated for best comparison of the absorption and photoluminescence, Table 6. However, the spectra did not show the absorption below 300 nm as observed in the solution spectra (see Fig. 9), so the solution were deposited on quartz substrate. The spectra are shown in Fig. 10, and it shows that the absorption in the range 215–300 nm appeared as the transitions described earlier in solution. Also, it is interesting note that with the solvent 1,4-dioxane the band intensity is higher than with MeOH, which is an indication to the molecules interaction.
Table 6 HEMABM films with different thickness, absorbance and concentration
| Solvent |
Thickness (nm) |
[HEMABM] × 10−5 M |
Imax |
Abs. 155 nm |
Abs.a |
| Normalized values [intensity absorbance/thickness]; I = intensity (Abs. at λ = 421 nm). |
| MeOH |
155 |
4.37 |
1.33 |
1.330 |
1 |
| IPA |
232 |
3.08 |
1.48 |
0.989 |
0.743 |
| CHCl3 |
250 |
2.05 |
1.32 |
0.818 |
0.615 |
| EtOAc |
242 |
6.48 |
1.88 |
1.204 |
0.905 |
| THF |
235 |
3.18 |
0.69 |
0.455 |
0.342 |
| Ph-Cl |
187 |
1.11 |
0.6 |
0.497 |
0.374 |
| 1,4-Dioxane |
165 |
1.15 |
0.77 |
0.723 |
0.544 |
| Toluene |
200 |
0.897 |
0.4 |
0.310 |
0.233 |
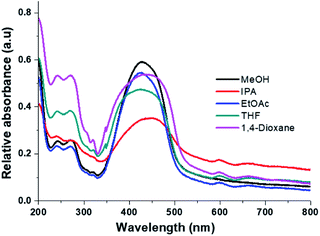 |
| | Fig. 10 HEMABM absorption spectra of the films (quartz substrate) prepared with different solvents. | |
2.4 OLED preparation and characterization
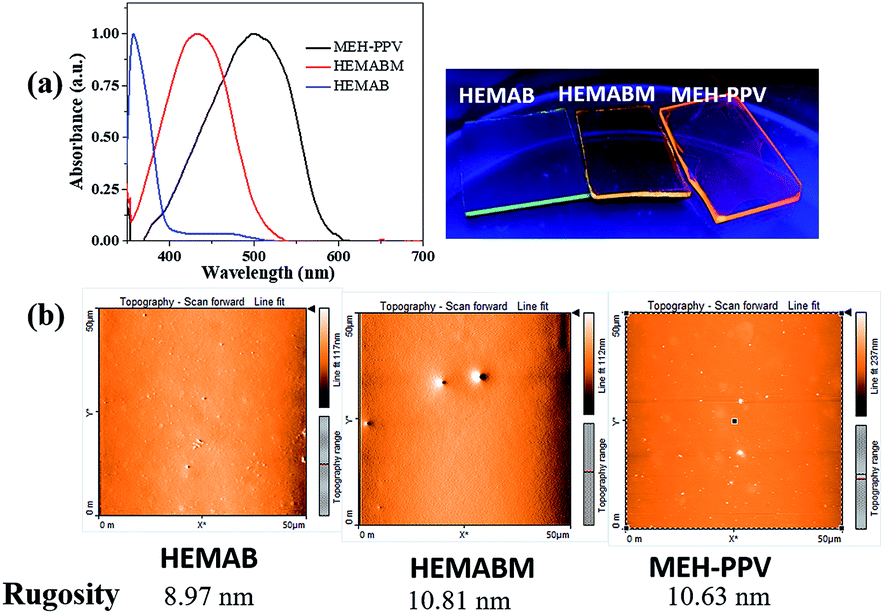
To prepare the OLED and to compare to the MEH-PPV, the deposition was performed at the same conditions. The Fig. 11(a) showed the emission under the UV-vis lamp of the films of reagent 4-((2-hydroxyethyl)(methyl)amino)benzaldehyde [HEMAB] and Fig. 11(b) showed the best morphology obtained. We can see the differences of the absorption maxima wavelength for HEMAB reagent, HEMABM and MEH-PPV. However, it was unexpected the emission wavelength of the title small molecular weight HEMABM compared to commercial MEH-PPV are closer and the difference about 67 nm. But the quantum yield measured gave a value of 7.99% for HEMABM and 15.25% for MEH-PPV.
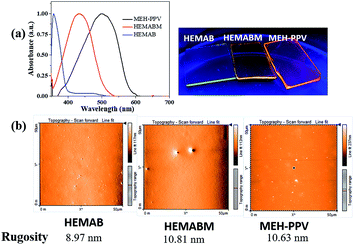 |
| | Fig. 11 (a) Film under the UV-vis lamp and absorption spectra of the films with MEH-PPV, HEMABM and HMAB reagent respectively. (b) AFM image of the morphology for films of compound HEMAB, HEMABM compound and MEH-PPV respectively. | |
Fig. 12 shows representative electrical parameters for devices with HEMABM compounds as well as MEH-PPV. The threshold voltage for devices based on MEH-PPV was slightly lower. These low threshold voltages can be compared with those reported by Ha43 and Hewidy44 for OLEDs with MEH-PPV as emitting layer. The luminance for devices based on HEMABM was of about 1300 cd m−2 meanwhile for MEH-PPV was about 2600 cd m−2. Also, it is observed that the electroluminescence wavelength (EL) of OLEDs corresponded to the PL wavelength (λem 611) and 586 nm for HEMABM and MEH-PPV respectively, Fig. 13.
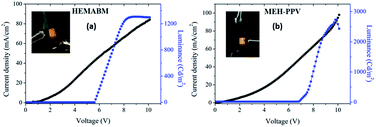 |
| | Fig. 12 Luminance and J–V curves for OLED based on (a) compound HEMABM and (b) compound MEH-PPV. | |
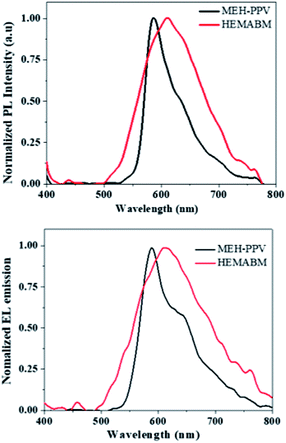 |
| | Fig. 13 Photoluminescence and electroluminescence emission of the film and OLED based on MEH-PPV and HEMABM. | |
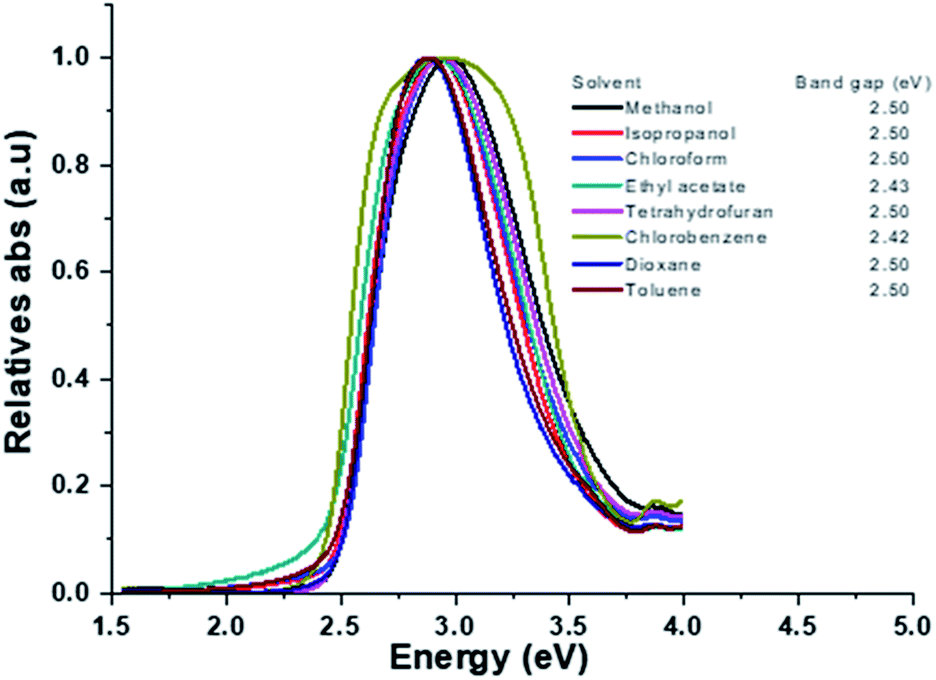
Fig. 14 shows the graphics with the measurement of the optical band gap for the compound HEMABM. The band gap of the MEH-PPV from different reports,44,45 is in the ranges between 2.00 and 2.10 eV. The values were estimated using onset wavelength. The HEMABM absorption value of λmax and λem calculated using optoelectronic module of Schrödinger Material Suite.46 gave the values at 390 nm and 735 nm respectively (Table S4†). The band gap is 2.92 eV (HOMO (eV) = −6.1399 and LUMO (eV) = −3.2087).
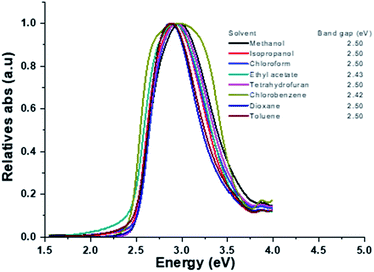 |
| | Fig. 14 Spectra of HEMABM on film and the values of the band gap. | |
2.5 Single crystal X-ray crystallography
The compound HEMABM crystallizes in the monoclinic system with the space group P21/n with Z = 4. The ORTEP representation of this compound is shown in Fig. 15. The crystal data and structure refinement parameters are presented in Table S1,† and the geometrical parameters for this compound are summarized in Tables S2 and S3.†
 |
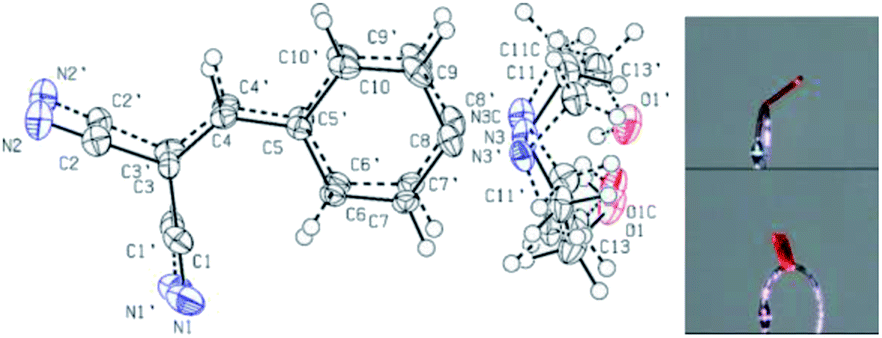
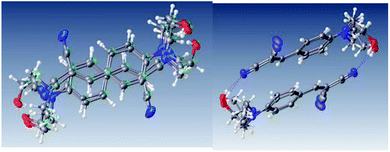
| | Fig. 15 The ORTEP molecular structure of HEMABM, with displacement ellipsoids drawn at the 50% probability level. The photo shows the orange color of the crystal. | |
Single crystal X-ray diffraction analysis revealed that HEMABM crystals exhibited a structure with disordered over either two or three orientations. The fragment C1 > C10 (including N1 and N2) is disordered over two orientations, and the occupancy factor of the major component of the disorder refines to 0.598(13). The fragment N3 > O1 (including C11, C12 and C13) is disordered over three orientations, and the occupancy factors of the three components refine to 0.531(3), 0.2429(19) and 0.227(3) (Fig. 15).
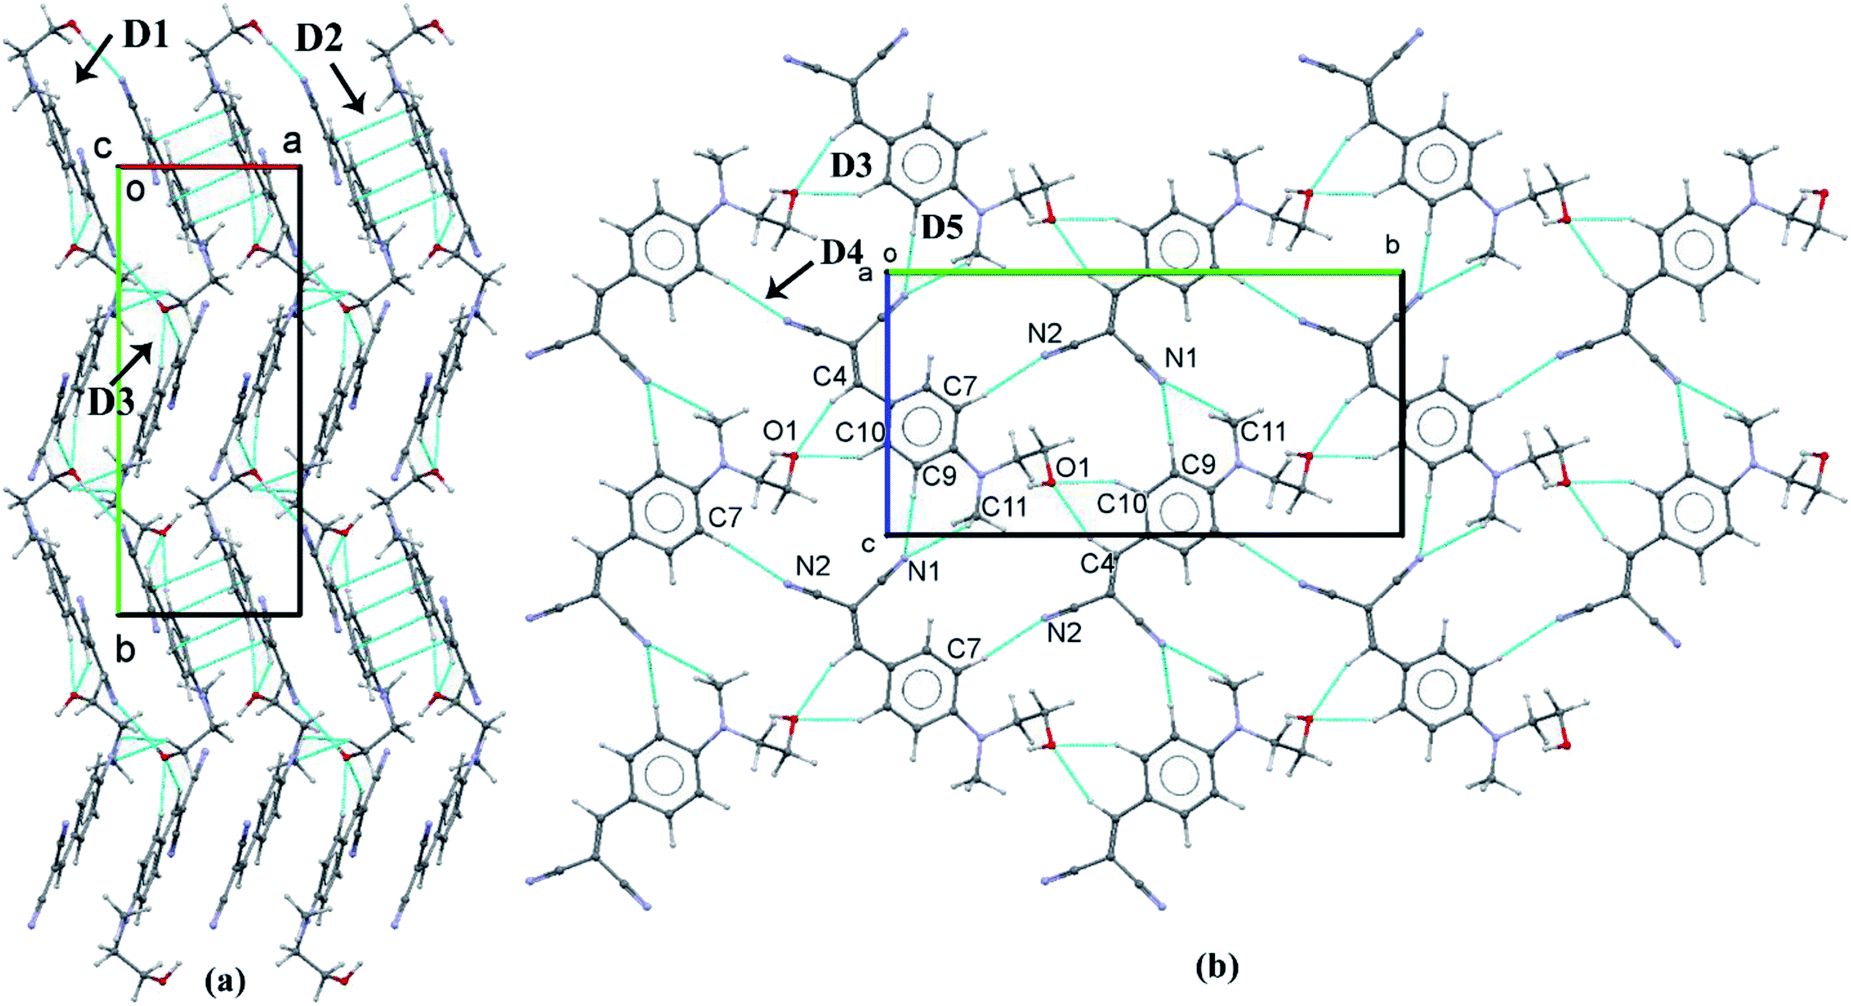
The disorder may be due to intermolecular interaction between the –OH group of N-methylethanol moiety's and one of the –CN group of malononitrile moiety in the other molecule. This interaction is a key interaction for the formation of molecular packing which forming a macrocyclic ring with R22(22) motif (Fig. 16) and the intermolecular interaction O–H⋯N could be mainly was observed in the crystal packing of HEMABM, Table 7. These interactions affect the bond length corresponding to C![[triple bond, length as m-dash]](https://www.rsc.org/images/entities/char_e002.gif) N group. N(1)C(1) and –C(2)N(2) bond are of 1.138(7) Å and 1.156(7) Å respectively. (For N(1′)C(1′) and N(2′)C(2′) bonds of 1.161(11) Å and 1.136(10) Å respectively) Table 8. The values for N(1)C(1) and N(2′)C(2′) are within the reported values for Car–CN,47 but for the N(2)C(2) and N(1′)C(1′) distances are larger due to hydrogen bonds distances, a, due to the atoms involved in chain motif formation.47 This bond length variation is might be due to the charger transfer between the interacting functional groups and similar bond length variation is also observed in the phenyl ring affected by the donor group methylaminoethanol and the acceptor group malononitrile (Table 8), contributing to the disorder that exhibit the molecular structure and the dimers observed in the package,48 Fig. 15.
N group. N(1)C(1) and –C(2)N(2) bond are of 1.138(7) Å and 1.156(7) Å respectively. (For N(1′)C(1′) and N(2′)C(2′) bonds of 1.161(11) Å and 1.136(10) Å respectively) Table 8. The values for N(1)C(1) and N(2′)C(2′) are within the reported values for Car–CN,47 but for the N(2)C(2) and N(1′)C(1′) distances are larger due to hydrogen bonds distances, a, due to the atoms involved in chain motif formation.47 This bond length variation is might be due to the charger transfer between the interacting functional groups and similar bond length variation is also observed in the phenyl ring affected by the donor group methylaminoethanol and the acceptor group malononitrile (Table 8), contributing to the disorder that exhibit the molecular structure and the dimers observed in the package,48 Fig. 15.
 |
| | Fig. 16 Crystal packing diagram of HEMABM showing the intermolecular interaction between –CN and O–H groups.51 | |
Table 7 Hydrogen-bonds D⋯H⋯A (Å) and D–H⋯A angles (°) of compound HEMABM47,48
| D–H⋯A |
d(D–H) |
d(D⋯A) |
<DHA |
Symm. op. 2 |
| O(1)⋯N(2) |
O(1)–H(1) |
N2⋯H1 |
O(1)–H(1)⋯N2 |
−x, −y, 1 − z |
| 3.022 |
0.8400 |
2.182 |
173.94 |
|
| 2.5–3.2 |
|
1.5–2.2 |
170–180 |
|
Table 8 Selected bond lengths of the HEMABM
| Bond |
Length (Å) |
| C(3)–C(4) |
1.373 (6) |
| C(4)–C(5) |
1.430 (7) |
| C(5)–C(6) |
1.414 (7) |
| C(5)–C(10) |
1.418 (7) |
| C(6)–C(7) |
1.371 (7) |
| C(7)–C(8) |
1.415 (4) |
| C(8)–N(3) |
1.402 (6) |
| C(8)–C(9) |
1.423 (6) |
| C(9)–C(10) |
1.372 (7) |
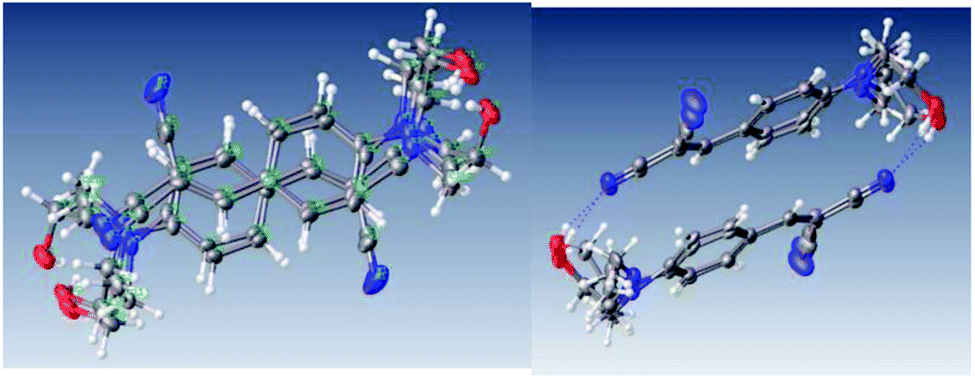
The arrangement of the molecules in the crystal is not completely face-to-face manner, Fig. 16. The dimer showed a weak interaction between aromatic rings; with two centroid–centroid distances: one of 3.834 Å (shift distance of 1.872 Å) and 3.917 Å (shift distance of 1.905 Å), which were calculated using OLEX 2.49 This π stacked dimer is shown in Fig. 17, and these parameters for the π⋯π interaction is found in the range of typical stacking interaction (<4.00 Å and offsets of 1.6–1.8 Å).50
 |
| | Fig. 17 Perspective view of the molecular structures showing weak π⋯π interactions and O–H⋯N interactions.49 | |
2.6 Characterization of intermolecular interaction
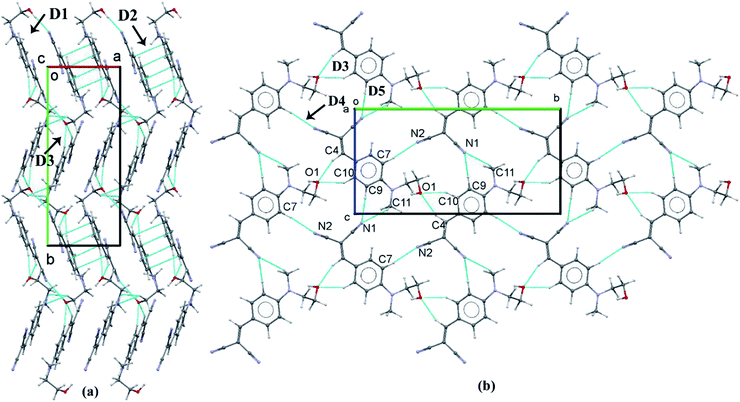
To find out the charge transfer between the –CN and –OH group, we carried out the NBO analysis for most stabilized dimer (D1) which formed by the strong O–H⋯N intermolecular interaction. The NBO analysis suggested that the charge transfer between the lone pair electron of N(2) atom into the antibonding orbital of O1–H1(O) bond which is stabilized with 6.00 kcal mol−1. The energetically significant dimers (D1–D5) are extracted from the crystal packing of HEMABM using PIXEL method and these dimers are shown in Fig. 18 along with their intermolecular interaction energy (Etot). The Etot for D1–D5 is in the range of −19.9 to −2.9 kcal mol−1 (Table 9). The strongest stabilizing dimer D1 in HEMABM is formed by the symmetrical O1–H1⋯N2 interactions between the –OH and –CN group (Etot: −19.9 kcal mol−1). Fig. 18 and Table 9. Based on the NBO analysis, we conclude that this (O1–H1⋯N2) interaction is a key contact for intermolecular charge transfer as mentioned earlier. The two neighbouring D1 dimers are sidewise interconnected by the π stacking dimer (π⋯π interaction, D2, Etot: −11.7 kcal mol−1) between the two-phenyl ring with the centroid to centroid distance is 3.834 Å. Also, two adjacent D1 dimers in the up and down manner are interconnected by the C4–H4⋯O1 and C10–H10⋯O1 interactions in D3 (Etot: −5.3 kcal mol−1) and the C7–H7⋯N2 interaction in D4 (Etot: −4.4 kcal mol−1). In the former interactions, C4–H4⋯O1 and C10–H10⋯O1, forming a R12(6) motif, while a latter interaction, C7–H7⋯N2, form a C(8) chain. Both dimers, D3 and D4, link the neighbouring molecules into chain which propagate parallel to the b axis. Another two weak C11–H11A⋯N1; C9–H9⋯N1 (D5, Etot: −2.9 kcal mol-1) interactions links the neighbouring molecules with R12(7) motif into form a chain which runs parallel to c axis. The combinations of interactions in dimers D1–D3 are key contacts to form a sandwich herringbone architecture in overall packing (Fig. 21(a)).
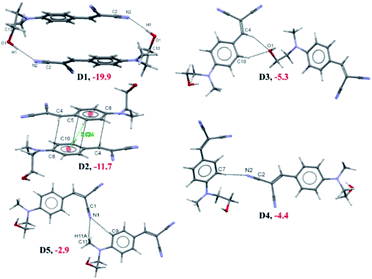 |
| | Fig. 18 Different interacting dimers (D1–D5) in the crystal structure of HEMABM along with the interaction energies. | |
Table 9 Intermolecular interaction energies (in kcal mol−1) and lattice energy (in kcal mol−1) partitioned into coulombic, polarization, dispersion and repulsion contributions
| Dimer |
Distance a |
Ecoul |
Epol |
EDisp (% Disp) |
Erep |
Etot |
ΔEcp |
Symmetry |
Possible interactions |
Geometry (Å, °) |
HS label |
| H⋯A |
D⋯A |
∠D–H⋯A |
| D1 |
5.076 |
−18.0 |
−7.0 |
−13.5 (35) |
18.7 |
−19.9 |
−24.34 |
−X, −y, 1 − z |
O1–H1⋯N2 |
2.03 |
3.022 |
173 |
1 |
| D2 |
4.185 |
−6.4 |
−1.9 |
−17.1 (67) |
13.7 |
−11.7 |
−17.99 |
1 − X, −y, 1 − z |
Cg1⋯Cg1 |
|
3.834(2) |
|
|
| D3 |
9.863 |
−5.2 |
−1.7 |
−3.6 (34) |
5.1 |
−5.3 |
−4.87 |
1/2 − x, −1/2 + y, 3/2 − z |
C4–H4⋯O1 |
2.43 |
3.404 |
148 |
2 |
| C10–H10⋯O1 |
2.28 |
3.276 |
152 |
3 |
| D4 |
10.304 |
−3.0 |
−0.8 |
−2.5 (40) |
1.8 |
−4.4 |
−5.07 |
1/2 − x, 1/2 + y, 1/2 − z |
C7–H7⋯N2 |
2.61 |
3.694 |
174 |
|
| D5 |
9.270 |
−2.7 |
−0.9 |
−2.3 (39) |
2.5 |
−2.9 |
−3.41 |
1/2 + x, 1/2 − y, 1/2 + z |
C11–H11A⋯N1 |
2.65 |
3.489 |
133 |
4 |
| C9–H9⋯N1 |
2.58 |
3.502 |
142 |
| Lattice energy |
−20.9 |
−8.5 |
−33.0 (52) |
30.2 |
−32.2 |
|
|
|
|
|
|
|
|
Another 2D molecular layers are formed by the combinations of interaction in dimers D3–D5 which propagates along the bc plane (Fig. 21(b)). It is worthy noted that all the dimers (D1–D5) are predominately stabilized with electrostatic contribution in the range of 60–65% except in D2. The dimer D2, mainly stabilized with dispersion contribution (67%) because it is a π stacking dimer. The total lattice energy for HEMABM is −32.2 kcal mol−1, and the dispersion (52%) and electrostatic (48%) is contributions are approximately equal in stabilizing the crystal structure.
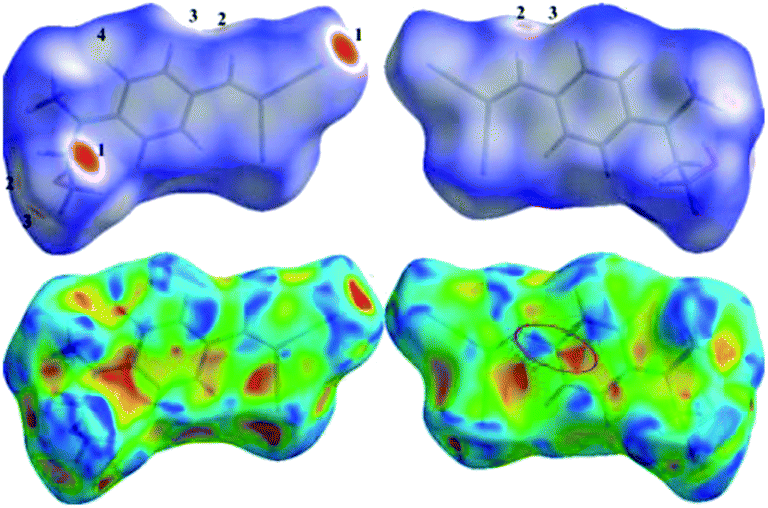
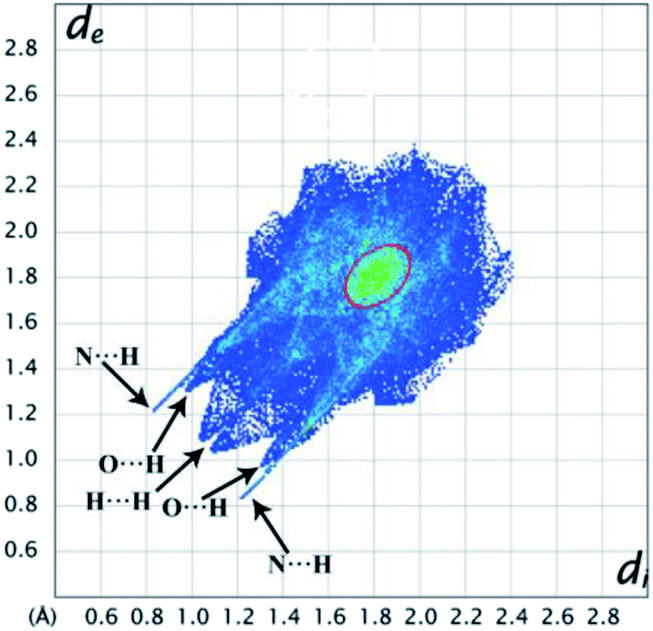
Further, to qualitatively analyse the intermolecular interactions present in the title molecule, we performed HS analysis and 2D fingerprint plots. The HS diagram and shape index (SI) of HEMABM is shown in Fig. 19. In HS diagram shown bright red color spot for O1–H1⋯N2(D1); C4–H4⋯O1; C10–H10⋯O1(D3) and C9–H9⋯N1(D5) interactions which are labelled in Table 9. The SI diagram shows that the red and blue color triangles on the surface of phenyl ring is due to the π stacking interactions (D2) in HEMABM structure. The 2D decomposed FP plot show the relative contribution of various intermolecular contacts in HEMABM is shown in Fig. 20. The H⋯H contacts are predominated in the crystal (35.8%) and it was shown as a double spike in de = di ≅ 1.1 Å. The second significant intermolecular contacts are N⋯H with a contribution of 29.9% and it shown as a sharp spike at de = di ≅ 1.2 Å. The C⋯H and O⋯H contacts are contributing 14.3% and 6.9% of total surface. It noted that the contribution of C⋯C contacts is comparably higher (10.1%) than the O⋯H contacts (6.9%) in the crystal structure and these C⋯C contacts are concentrated around de = di ≅ 1.8 Å as a green dot (it highlighted in red color circle) which indicate the existence of π stacking interaction in HEMABM.
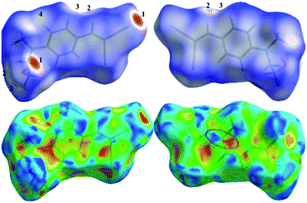 |
| | Fig. 19 Views of the Hirshfeld surfaces mapped with dnorm in two different orientations for HEMABM in top side of the figure. The significant contacts are labelled closer to corresponding atoms. The shape index diagrams for HEMABM in two different orientations are shown in the bottom side of the figure. | |
 |
| | Fig. 20 The 2D finger print for HEMABM and the significant contacts is labelled. | |
 |
| | Fig. 21 (a) The crystal packing diagram of HEMABM; (b) part of crystal packing of HEMABM showing the molecular layered structure formed by the combinations of interactions in D3–D5. | |
3 Conclusion
The low molecular weight malononitrile derivative synthesized and comprehensively characterized. Despite being a very small molecule its optoelectronic properties are very similar to the commercial MEH-PPV. The importance of the intramolecular interactions in the structure and intermolecular interactions with the solvent affecting the optical properties of the reported compound but it helps to find that best conditions to obtain a film with this low molecular weight compound and suitable morphology to optoelectronic devices. The results show that although the absorptions are different between HEMABM and MEH-PPV, the emission is approximately at the same wavelength, which could be due to the intermolecular interaction of HEMABM, and therefore a good candidate with potential for applications in compare to the commercial MEH-PPV. From the structure of compound, the phenyl ring linked to dicyanovinylene group significantly raise the photoluminescence quantum yields in film. In summary, malononitrile derivatives considering their EL spectra, seem to be the most promising for further investigations aiming at both device and molecule structure modifications and registration of OLED parameters.
4 Experimental section
4.1 Chemicals and instruments
4-Fluorophenylacetonitrile (analytical grade, 99%), malononitrile (analytical grade, 99%) were purchased from Aldrich Chemical Co. (Mexico) and K2CO3 from J.T. Baker. The DMSO, EtOH were acquired from Fermont. The reagents and solvents were used as received without any additional purification. Fourier-transform infrared spectrometry (FT-IR). The IR spectra of the compounds were recorded from neat solids on a Vertex model 70 Bruker 750 FT-IR spectrophotometer with ATR (Attenuated Total Reflection). The spectra were collected from 4000 to 400 cm−1 with a 4 cm−1 spectral resolution. Proton nuclear magnetic resonance (1H-NMR). The spectra were recorded using a Bruker 500 MHz NMR spectrometer. Mass spectrometry. The EI spectra were obtained using a Mass Spectrometer Jeol MStation 700-D. PEDOT:PSS was acquired from Heraeus Clevios, ITO/glass with resistivity of 10 ohms □−1 was obtained from Delta Technologies.
The current density versus voltage (J–V) and luminous efficiency versus voltage (L–V) curves were measured simultaneously using a power supply (Newark element I4, Keithley 2400) with an in-house-designed and calibrated detection system. The J–V curve is recorded by direct processing of data acquired from the used Keithley 2400 apparatus. Luminous density is estimated through the voltage delivered by a photodiode located at fixed distance from the OLED. Photodiode calibration was performed by using the luminance of commercial LEDs, at different wavelengths and considering all geometrical parameters involved in the detection system.
4.2 Solution process and device preparation
The compound was deposited at 2000 rpm. For the study, the compounds were prepared solutions with 15 mg ml−1 in MeOH, IPA, EtOAc, 1,4-dioxane, THF, CHCl3, Ph-Cl or toluene solvents. At room temperature, the compound HEMABM was in soluble in some solvents, but by heating it was completely soluble. The films were deposited on ITO substrate with a PEDOT:PSS film at 85 °C and dried for 20 min.
The OLEDs fabrication, it architecture was glass/ITO/PEDOT:PSS/emissive layer/cathode. The PEDOT:PSS layer (50 nm) was deposited by spin coating and dried 10 minutes at 120 °C and normal atmosphere. The emissive layer (about 80 nm) was deposited from a solution with dioxane as solvent for compound HEMABM and chlorobenzene for MEH-PPV; 20 mg ml−1 and 5 mg ml−1 respectively. The solutions and substrates were pre-heated at 85 °C, films were dried also at 85 °C in normal atmosphere. As cathode 100 nm of Al were thermal evaporated also the eutectic alloy of Bi:In:Sn (melting point 65 °C) was deposited at 100 °C in normal atmosphere by drop casting.
4.3 Absorbance and emission (UV-vis and PL)
The absorbance spectra were measured using a spectrometer SD2000 (Ocean Optics, Dunedin, FL) equipped with a pulse xenon light source P-2 (Ocean Optics for the UV region (220–270 nm)) and a Spectrometer Cary 300 (Agilent) equipped with a deuterium and halogen lamps. For powder samples, the absorption spectra were measured with KBr pellets using a DT 1000 CE light source (Analytical Instrument Systems, Inc., Flemington, NJ). Emission spectra (PL) were acquired from a QE-Pro-FL (Ocean Optics, Dunedin, FL) equipped with a laser diode excitation source at a wavelength of 405 nm. The quantum yield (Φf) for the compounds was determined as described by De Mello52 with slight modification. For fluorescence spectra measurements, the powder samples (prepared from crystals) and films. The J–V curves were acquired with a source-meter Keithley 2400 with LabVIEW interface. Electroluminescence spectra were recorded with an Ocean Optics spectrometer. For the photoluminescence spectra a UV-Lamp Mineral Light with emission at 350 nm was used as excitation source. The morphology and thickness were analyzed using atomic force microscopy (AFM) with the microscope EasyScan 2 from Nanosurf operating in contact mode under ambient conditions. This has a maximum square scanning area of 110 μm.
4.4 Single crystal X-ray diffraction (SCXRD)
All reflection intensities were measured at 110(2) K using a SuperNova diffractometer (equipped with Atlas detector) with CuKα radiation (λ = 1.54178 Å) under the program CrysAlisPro.53 The same program was used to refine the cell dimensions and for the data reduction. The structure was solved with the program SHELXS-2014/7 (ref. 54) and was refined on F2 with SHELXL-2014/7.55 Analytical numeric absorption correction using a multifaceted crystal model was applied using CrysAlisPro. The temperature of the data collection was controlled using the system Cryojet (manufactured by Oxford Instruments). The H atoms were placed at calculated positions using riding model the structure is disordered.
4.5 Quantum chemical calculations
All the quantum chemical calculations were performed with the Gaussian 09 program.56 The structures were fully optimized with PBEPBE/6-311++G (d, p) level of theory.57–59 The vibrational frequency was calculated for the optimized geometry in vacuum and in solvent phases to determine the energy minima on the potential energy surface and no imaginary frequencies were found. All the solution phase calculations were carried out by using the conductor-like polarizable continuum model (CPCM).60,61 Time-dependent DFT (TDDFT)62 was used to calculate the absorption properties from the optimized geometries with PBEPBE/6-311++G (d, p) level of theory. We performed natural bond orbital (NBO) analysis to characterize the nature of charge transfer between the molecules. Furthermore, the interaction energies (ΔEcp) for the selected molecular dimers at their crystal geometry were calculated at M06-2X63,64 cc-PVTZ level of theory with Grimme's D3 dispersion corrections.65 The ΔEcp was corrected for basis set superposition error (BSSE).66
4.6 Hirshfeld surface analysis and PIXEL energy calculation
The Hirshfeld surfaces (HS) analysis67–72 and the decomposed two-dimensional fingerprint plots (FP)72 was used to quantify and to understand the nature of different intermolecular interactions existing in the crystal structure. The HS and FP were generated using the program CrystalExplorer17.73 For, PIXEL and Hirshfeld analysis, we used only major disorder fragment. Further, the intermolecular interaction energies (Etot) for different molecular pairs of HEMABM were calculated using the PIXEL method (in the CLP computer program package version 12.5.2014). Based on the Etot values, the selected molecular pairs were considered for further analysis. The total lattice energy of the title compound was also computed using the PIXEL method. The C–H bond lengths were adjusted to typical neutron diffraction values (C–H![[double bond, length as m-dash]](https://www.rsc.org/images/entities/char_e001.gif) 1.089 Å) before the HS and PIXEL calculations. For PIXEL calculations, the electron density of the molecules was obtained at MP2/6-31G** level of theory using Gaussian09 for all the molecules in the current study.
1.089 Å) before the HS and PIXEL calculations. For PIXEL calculations, the electron density of the molecules was obtained at MP2/6-31G** level of theory using Gaussian09 for all the molecules in the current study.
Conflicts of interest
There are no conflicts to declare.
Acknowledgements
The authors wish to express their gratitude to VIEP-BUAP (project PEZM-NAT16-G), to project fellowship-PRODEP-SEP 511-6/17-11066 and 511-6/18-16257, to Maxime Siegler for the X-ray determination, Laboratorio Nacional de Supercómputo del Sureste (LNS-BUAP) to perform the calculations as well as to Vladimir Carranza for technical assistance with mass spectrometry.
Notes and references
- P. Stallinga, H. L. Gomes, M. Murgia and K. Müllen, Org. Electron., 2002, 3, 43–51 CrossRef CAS.
- J. Lei, W. Liang, C. J. Brumlik and C. R. Martin, Synth. Met., 1992, 47, 351–359 CrossRef CAS.
- J. J. M. Halls, C. A. Walsh, N. C. Greenham, E. A. Marseglia, R. H. Friend, S. C. Moratti and A. B. Holmes, Nature, 1995, 376, 498–500 CrossRef CAS.
- G. Yu, J. Gao, J. C. Hummelen, F. Wudl and A. J. Heeger, Science, 1995, 270, 1789–1791 CrossRef CAS.
- M. E. Aydin, F. Yakuphanoglu, J.-H. Eom and D.-H. Hwang, Phys. B, 2007, 387, 239–244 CrossRef CAS.
- N. O. Braga, D. G. S. M. Cavalcante, A. S. Gomes, E. Yoshihara, R. F. Bianchi and A. E. Job, J. Lumin., 2019, 210, 501–507 CrossRef CAS.
- A. Mhamdi, F. b. S. Sweii, H. Saidi, F. Saidi and A. Bouazizi, J. Mol. Struct., 2018, 1160, 33–37 CrossRef CAS.
- F. Semendy, G. Meissner and P. Wijewarnasuriya, Electrical and Optical Response Properties of MEH-PPV Semiconductor Polymer Schottky Diodes, 2011 Search PubMed.
- F. So, B. Krummacher, M. K. Mathai, D. Poplavskyy, S. A. Choulis and V.-E. Choong, J. Appl. Phys., 2007, 102, 91101 CrossRef.
- C. Zhong, C. Duan, F. Huang, H. Wu and Y. Cao, Chem. Mater., 2011, 23, 326–340 CrossRef CAS.
- R. H. Friend, R. W. Gymer, A. B. Holmes, J. H. Burroughes, R. N. Marks, C. Taliani, D. D. C. Bradley, D. A. Dos Santos, J. L. Brédas, M. Lögdlund and W. R. Salaneck, Nature, 1999, 397, 121 CrossRef CAS.
- D. X. Yu, Int. J. Mol. Sci., 2011, 12, 1575–1594 CrossRef CAS PubMed.
- X. Gong, Org. Optoelectron., 2013, 277–336 CAS.
- A. Menon, H. Dong, Z. I. Niazimbetova, L. J. Rothberg and M. E. Galvin, Chem. Mater., 2002, 14, 3668–3675 CrossRef CAS.
- L. Duan, L. Hou, T.-W. Lee, J. Qiao, D. Zhang, G. Dong, L. Wang and Y. Qiu, J. Mater. Chem., 2010, 20, 6392–6407 RSC.
- B. Zhang, G. Tan, C.-S. Lam, B. Yao, C.-L. Ho, L. Liu, Z. Xie, W.-Y. Wong, J. Ding and L. Wang, Adv. Mater., 2012, 24, 1873–1877 CrossRef CAS PubMed.
- N. Aizawa, Y.-J. Pu, M. Watanabe, T. Chiba, K. Ideta, N. Toyota, M. Igarashi, Y. Suzuri, H. Sasabe and J. Kido, Nat. Commun., 2014, 5, 5756 CrossRef PubMed.
- N. J. Findlay, B. Breig, C. Forbes, A. R. Inigo, A. L. Kanibolotsky and P. J. Skabara, J. Mater. Chem. C, 2016, 4, 3774–3780 RSC.
- C. Liu, Q. Fu, Y. Zou, C. Yang, D. Ma and J. Qin, Chem. Mater., 2014, 26, 3074–3083 CrossRef CAS.
- S. Ren, D. Zeng, H. Zhong, Y. Wang, S. Qian and Q. Fang, J. Phys. Chem. B, 2010, 114, 10374–10383 CrossRef CAS PubMed.
- J. A. Hur, S. Y. Bae, K. H. Kim, T. W. Lee, M. J. Cho and D. H. Choi, Org. Lett., 2011, 13, 1948–1951 CrossRef PubMed.
- B. Yucel, N. Akcebe, M. Desde, E. Tekin, S. P. Mucur and P. Camurlu, Dyes Pigm., 2018, 156, 82–90 CrossRef CAS.
- D. Yokoyama, J. Mater. Chem., 2011, 21, 19187–19202 RSC.
- M. Shibata, Y. Sakai and D. Yokoyama, J. Mater. Chem. C, 2015, 3, 11178–11191 RSC.
- D. R. Widmer and B. J. Schwartz, Nat. Chem., 2018, 10, 910–916 CrossRef CAS PubMed.
- R. M. Young and D. M. Neumark, Chem. Rev., 2012, 112, 5553–5577 CrossRef CAS PubMed.
- M. J. Blandamer and M. F. Fox, Chem. Rev., 1970, 70, 59–93 CrossRef CAS.
- R. A. Marcus, J. Chem. Phys., 1956, 24, 966–978 CrossRef CAS.
- R. A. Marcus and N. Sutin, Biochim. Biophys. Acta, Rev. Bioenerg., 1985, 811, 265–322 CrossRef CAS.
- E. Skuodis, O. Bezvikonnyi, A. Tomkeviciene, D. Volyniuk, V. Mimaite, A. Lazauskas, A. Bucinskas, R. Keruckiene, G. Sini and J. V. Grazulevicius, Org. Electron., 2018, 63, 29–40 CrossRef CAS.
- E. R. Barthel, I. B. Martini and B. J. Schwartz, J. Phys. Chem. B, 2001, 105, 12230–12241 CrossRef CAS.
- X. Gong, S. Wang, D. Moses, G. C. Bazan and A. J. Heeger, Adv. Mater., 2005, 17, 2053–2058 CrossRef CAS.
- S. Ho, S. Liu, Y. Chen and F. So, J. Photonics Energy, 2015, 5, 1–17 CAS.
- P. Suppan, J. Photochem. Photobiol., A, 1990, 50, 293–330 CrossRef CAS.
- B. Bagchi, Int. Rev. Phys. Chem., 1987, 6, 1–33 Search PubMed.
- H. Wu, F. Huang, Y. Mo, W. Yang, D. Wang, J. Peng and Y. Cao, Adv. Mater., 2004, 16, 1826–1830 CrossRef CAS.
- A. Babaei, K. Rakstys, S. Guelen, V. Fallah Hamidabadi, M.-G. La-Placa, L. Martínez-Sarti, M. Sessolo, H. A. Joel, O. P. M. Gaudin, V. Schanen, M. K. Nazeeruddin and H. J. Bolink, RSC Adv., 2018, 8, 35719–35723 RSC.
- J. You, S.-L. Lai, W. Liu, T.-W. Ng, P. Wang and C.-S. Lee, J. Mater. Chem., 2012, 22, 8922–8929 RSC.
- H. Sasabe and J. Kido, Chem. Mater., 2011, 23, 621–630 CrossRef CAS.
- V. Peddie, J. Anderson, J. E. Harvey, G. J. Smith and A. Kay, J. Org. Chem., 2014, 79, 10153–10169 CrossRef CAS PubMed.
- C. Reichardt, Green Chem., 2005, 7, 339–351 RSC.
- T. M. McCormick, C. R. Bridges, E. I. Carrera, P. M. DiCarmine, G. L. Gibson, J. Hollinger, L. M. Kozycz and D. S. Seferos, Macromolecules, 2013, 46, 3879–3886 CrossRef CAS.
- Y.-G. Ha, E.-A. You, B.-J. Kim and J.-H. Choi, Synth. Met., 2005, 153, 205–208 CrossRef CAS.
- D. Hewidy, A.-S. Gadallah and G. A. Fattah, J. Mol. Struct., 2017, 1130, 327–332 CrossRef CAS.
- T. Qin and A. Troisi, J. Am. Chem. Soc., 2013, 135, 11247–11256 CrossRef CAS PubMed.
- Schrödinger release, 2016, vol. 2014, p. 3 Search PubMed.
- F. H. Allen, O. Kennard, D. G. Watson, L. Brammer, A. G. Orpen and R. Taylor, J. Chem. Soc., Perkin Trans. 2, 1987, S1–S19 RSC.
- T. Steiner, Angew. Chem., Int. Ed., 2002, 41, 48–76 CrossRef CAS.
- O. V Dolomanov, L. J. Bourhis, R. J. Gildea, J. A. K. Howard and H. Puschmann, J. Appl. Crystallogr., 2009, 42, 339–341 CrossRef.
- K. Molčanov, I. Sabljić and B. Kojić-Prodić, CrystEngComm, 2011, 13, 4211–4217 RSC.
- C. F. Macrae, P. R. Edgington, P. McCabe, E. Pidcock, G. P. Shields, R. Taylor, M. Towler and J. van de Streek, J. Appl. Crystallogr., 2006, 39, 453–457 CrossRef CAS.
- J. C. de Mello, H. F. Wittmann and R. H. Friend, Adv. Mater., 1997, 9, 230–232 CrossRef CAS.
- Agilent Technologies, CrysAlisPro Data Collection and Processing Software for Agilent X-ray Diffractometers, Technol. UK Ltd, Yarnton, Oxford, UK, 2014 Search PubMed.
- G. M. Sheldrick, Acta Crystallogr., Sect. C: Struct. Chem., 2015, 71, 3–8 Search PubMed.
- G. M. Sheldrick, Acta Crystallogr., Sect. A: Found. Adv., 2015, 71, 3–8 CrossRef PubMed.
- M. J. Frisch, G. W. Trucks, H. B. Schlegel, G. E. Scuseria, M. A. Robb, J. R. Cheeseman, G. Scalmani, V. Barone, B. Mennucci, G. A. Petersson, H. Nakatsuji, M. Caricato, X. Li, H. P. Hratchian, A. F. Izmaylov, J. Bloino, G. Zheng, J. L. Sonnenberg, M. Hada, M. Ehara, K. Toyota, R. Fukuda, J. Hasegawa, M. Ishida, T. Nakajima, Y. Honda, O. Kitao, H. Nakai, T. Vreven, J. A. Montgomery, J. E. Peralta, F. Ogliaro, M. Bearpark, J. J. Heyd, E. Brothers, K. N. Kudin, V. N. Staroverov, R. Kobayashi, J. Normand, K. Raghavachari, A. Rendell, J. C. Burant, S. S. Iyengar, J. Tomasi, M. Cossi, N. Rega, J. M. Millam, M. Klene, J. E. Knox, J. B. Cross, V. Bakken, C. Adamo, J. Jaramillo, R. Gomperts, R. E. Stratmann, O. Yazyev, A. J. Austin, R. Cammi, C. Pomelli, J. W. Ochterski, R. L. Martin, K. Morokuma, V. G. Zakrzewski, G. A. Voth, P. Salvador, J. J. Dannenberg, S. Dapprich, A. D. Daniels, O. Farkas, J. B. Foresman, J. V Ortiz, J. Cioslowski and D. J. Fox, Gaussian 09, Revis. B.01, Gaussian, Inc., Wallingford CT, 2009 Search PubMed.
- C. Adamo and V. Barone, J. Chem. Phys., 1999, 110, 6158–6170 CrossRef CAS.
- M. Ernzerhof and G. E. Scuseria, J. Chem. Phys., 1999, 110, 5029–5036 CrossRef CAS.
- J. P. Perdew, K. Burke and M. Ernzerhof, Phys. Rev. Lett., 1996, 77, 3865–3868 CrossRef CAS PubMed.
- J. Tomasi, B. Mennucci and R. Cammi, Chem. Rev., 2005, 105, 2999–3094 CrossRef CAS PubMed.
- S. Miertuš, E. Scrocco and J. Tomasi, Chem. Phys., 1981, 55, 117–129 CrossRef.
- W. Kohn and L. J. Sham, Phys. Rev., 1965, 140, A1133–A1138 CrossRef.
- Y. Zhao, N. E. Schultz and D. G. Truhlar, J. Chem. Theory Comput., 2006, 2, 364–382 CrossRef PubMed.
- E. G. Hohenstein, S. T. Chill and C. D. Sherrill, J. Chem. Theory Comput., 2008, 4, 1996–2000 CrossRef CAS PubMed.
- S. Grimme, J. Antony, S. Ehrlich and H. Krieg, J. Chem. Phys., 2010, 132, 154104 CrossRef PubMed.
- S. F. Boys and F. Bernardi, Mol. Phys., 1970, 19, 553–566 CrossRef CAS.
- J. J. McKinnon, D. Jayatilaka and M. A. Spackman, Chem. Commun., 2007, 3814–3816 RSC.
- J. J. McKinnon, M. A. Spackman and A. S. Mitchell, Acta Crystallogr., Sect. B: Struct. Sci., 2004, 60, 627–668 CrossRef PubMed.
- J. J. McKinnon, A. S. Mitchell and M. A. Spackman, Chem.–Eur. J., 1998, 4, 2136–2141 CrossRef CAS.
- M. A. Spackman and P. G. Byrom, Chem. Phys. Lett., 1997, 267, 215–220 CrossRef CAS.
- M. A. Spackman and J. J. McKinnon, CrystEngComm, 2002, 4, 378–392 RSC.
- M. J. Turner, J. J. McKinnon, S. K. Wolff, D. J. Grimwood, P. R. Spackman, D. Jayatilaka and M. A. Spackman, CrystalExplorer17, 2017 Search PubMed.
- A. Gavezzotti, Mol. Phys., 2008, 106, 1473–1485 CrossRef CAS.
Footnote |
| † Electronic supplementary information (ESI) available. CCDC 1868089. For ESI and crystallographic data in CIF or other electronic format see DOI: 10.1039/c9ra05425a |
|
| This journal is © The Royal Society of Chemistry 2019 |
Click here to see how this site uses Cookies. View our privacy policy here. 
 Open Access Article
 This Open Access Article is licensed under a Creative Commons Attribution-Non Commercial 3.0 Unported Licence
 *a,
Margarita Ceróna,
Perumal Venkatesan
*a,
Margarita Ceróna,
Perumal Venkatesan