 Open Access Article
Enhanced photoelectrochemical performance of LaFeO3 photocathode with Au buffer layer
Peipei Wanga,
Yanfang Hea,
Yan Mi b,
Jianfei Zhua,
Faling Zhanga,
Yuan Liu*a,
Ying Yanga,
Mingming Chen
 a and
Dawei Cao
 *a
*a
aDepartment of Physics, Faculty of Science, Jiangsu University, Zhenjiang 212013, P. R. China. E-mail: yliu@ujs.edu.cn; dwcao@ujs.edu.cn
bGuangxi Key Laboratory of Chemistry and Engineering of Forest Products, Guangxi University for Nationalities, Nanning 530006, P. R. China
First published on 27th August 2019
Abstract
Due to an appropriate band gap of 2.07 eV, perovskite LaFeO3 (LFO) is an alternative candidate for high-efficiency photoelectrochemical (PEC) systems. However, the photocurrent of the LFO photocathode is too low to be practical. Herein, we prepared a LFO film with high crystal quality by inserting an Au thin layer between LFO and FTO in the LFO/FTO photocathode. Accordingly, an effective improvement PEC performance could be obtained and the photocurrent density of the FTO/Au/LFO electrode was increased to −19.60 μA cm−2 at 0.6 V vs. RHE, which is 4.1 times higher than that of pristine FTO/LFO electrode. Based on the experimental and theoretical analysis, the enhancement of the photocurrent was attributed to the strong light harvesting, enhanced charge separation, and increased charge-collection efficiency of the Au/LFO structure. This work provides a promising strategy to develop high-efficiency PEC electrodes, and has potential to be applied in the visible-light water splitting area.
1. Introduction
Photoelectrochemical (PEC) water splitting has been demonstrated to be a promising technique for hydrogen generation due to its significant role in the development of renewable and green energy.1–6 Among the numerous PEC materials, p-type semiconductors are one of the best photocathodic materials because of their good PEC performance.7,8 Recently, many common p-type materials such as p-Cu2O,9–11 p-NiO,12,13 p-CuFeO2![[thin space (1/6-em)]](https://www.rsc.org/images/entities/char_2009.gif) 14 and p-CuBi2O4
14 and p-CuBi2O4![[thin space (1/6-em)]](https://www.rsc.org/images/entities/char_2009.gif) 15–17 have been developed for PEC water splitting applications. Specifically, Luo et al. fabricated Cu2O nanowire array photocathodes with a durable protective overlayer which improved the stability of Cu2O, thus delivering high photocurrent densities and stable operation.10 Nail et al. reported that nano-NiO is catalytically and photoelectrochemically more active than bulk-NiO due to its enhanced ability to transfer minority charge carriers.13 IO-structured CuFeO2 exhibited a record-high photocurrent density attributed to the drastically improved visible-light harvesting ability.14 These reports reveal that an ideal semiconductor-based electrode for PEC should have good structural stability, efficient charge separation, high harvesting ability, etc.
15–17 have been developed for PEC water splitting applications. Specifically, Luo et al. fabricated Cu2O nanowire array photocathodes with a durable protective overlayer which improved the stability of Cu2O, thus delivering high photocurrent densities and stable operation.10 Nail et al. reported that nano-NiO is catalytically and photoelectrochemically more active than bulk-NiO due to its enhanced ability to transfer minority charge carriers.13 IO-structured CuFeO2 exhibited a record-high photocurrent density attributed to the drastically improved visible-light harvesting ability.14 These reports reveal that an ideal semiconductor-based electrode for PEC should have good structural stability, efficient charge separation, high harvesting ability, etc.
Recently, p-type LaFeO3 (LFO), owing to its appropriate band gap value of 2.07 eV, has aroused tremendous attention in the water-splitting area. Also, LFO is non-toxic and does not contain copper, thus avoiding the occurrence of photocorrosion, which facilitates the maintenance of its structural stability without surface protection. However, weak light absorption, low-degree charge separation or inefficient charge collection of the device restrict the PEC performance of LFO.18–22 For example, Wheeler et al.18 found that poor charge transport of LFO restricted the improvement of PEC properties and should be prepared as nanoporous morphology to help electrons reach the surface. Peng et al.19,20 found that poor charge transport and inefficient charge collection of LFO restrict the PEC performance, which could be overwhelmed by Co-catalyst (Co Pi) electrodeposited or transition metal (Mn, Co, Cu) doping. Pawar et al.22 synthesized a plasmonic LFO-Ag photocathode for enhanced light harvesting to drive PEC hydrogen evolution. In other words, it is essential to improve light harvesting capabilities, charge separation, and charge collection of LFO for PEC devices.
Growing LaFeO3 on a buffer layer may be an effective method to solve this problem. A number of reports with the strategy of using buffer layer have been released and the researchers found buffer layer could make contributions to forming the high-quality film,23 improving charge separation,24 and enhancing electrical conductivity.25 For instance, with the contact of Au buffer layer, we synthesized high-quality p-type CuBiO4 and realized high-efficient water splitting in our previous work.23 By combining Ca2O3 buffer layer, Cu2O-based photocathodes could suppress the interface recombination and make contributions to promoting separation of photogenerated charges.24 By coating thin carbonized polydopamine buffer layer on SnO2 nanoparticles, it could function as conducting bridge and enhance the electrical conductivities for charge collection.25 Despite the significant efforts of buffer layers reported, there have been comparatively few reports of the effect of buffer layers on LFO photoelectrodes.
Here, we combined LFO with Au buffer layer to develop high efficient Au/LFO photocathodes. The hybrid nanostructure of Au/LFO showed an increased photocurrent density of −19.60 μA cm−2 at 0.6 V vs. RHE, which is 4.1 times higher than that of pristine LFO. Through the systematical experimental and theoretical investigations, it has been revealed that the Au buffer layer plays an important role in improving light absorption, promoting separation of photogenerated electrons and holes, and reducing the resistance of the PEC system. Therefore, the present work provides a facile protocol to the fabrication of visible-light-active photocathode.
2. Experimental
2.1 Materials and chemicals
Fe(NO3)3·9H2O (≥98.5%), La(NO3)3·6H2O (≥44%), citric acid monohydrate (≥99%), ethylene glycol methyl ether (≥99%), acetone (99.5%), ethanol (≥99.5%), FTO-coated glass (L × W × D: 100 mm × 100 mm × 1.6 mm; surface resistivity: <15 ohm sq−1; transmittance: ≥83.0%) were purchased from Zhuhai Kaivo Optoelectronic Technology Co., Ltd.2.2 Preparation of LaFeO3 photocathode
LaFeO3 thin film photoelectrodes were prepared on FTO-coated glass following a facile sol–gel procedure. First, a thin layer of Au was deposited on the cleaned FTO-coated glass (ultrasonically for 10 min in acetone and ethanol, respectively) by magnetron sputtering. Then, La(NO3)3·6H2O and Fe(NO3)3·9H2O with stoichiometric ratios were dissolved in ∼50 mL ethylene glycol methyl ether and kept stirring until the salts were dissolved completely. Citric acid monohydrate (molar ratio of citric acid monohydrate/metals = 2) was added into the solution and kept stirring in a thermostatic bath at 60 °C for 2 hours. The russet transparent solution was obtained after 24 hours of aging. The sol was dropped on the Au/FTO substrate and spun at 6000 rpm for 20 s in a spin coater. The spinning was repeated 6 times with baking at 200 °C for 3 min and annealing at 600 °C for 5 min between spins. For comparison, LaFeO3 films on FTO glass directly were prepared using the same procedure.2.3 PEC measurements
PEC measurements were carried out in a three-electrode cell using an electrochemical workstation (CHI660E) with bare LFO or Au/LFO as a working electrode, Pt foil as a counter electrode, and Ag/AgCl as a reference electrode. The PEC performance of LaFeO3 photocathode was measured in 0.1 M Na2SO4 aqueous solution at PH 7, under light illumination using a 350 W Xe lamp. The light power intensity at the sample positions was calibrated with a radiometer (PM100USB, Thorlabs) to simulate AM 1.5 illumination. The incident photon to current conversion efficiency (IPCE) was measured with a 350 W Xe lamp and a monochromator (Omni-λ150) whose intensity was obtained by a power meter (Newport). The amperometric J–t photoresponse was investigated under a bias voltage of 0.6 V (vs. RHE) with chopped illumination interval of 10 s. Impedance measurements were carried out in the dark with a scan rate of 5 mV s−1.2.4 Characterizations
The X-ray diffraction patterns (XRD) were recorded on a Bruker D8 Advance equipped with Cu Kα radiation with λ = 1.54178 Å in the 2θ ranging from 20° to 80°. The morphology of the photoelectrodes was investigated by field-emission scanning electron microscope (JEOL, 7800F). Room-temperature UV-Vis absorption spectroscopy was measured by a Cary 8454 ultraviolet-visible (UV-Vis) spectrometer with scanning wavelength ranging from 300 nm to 800 nm. PL spectra were characterized on QuantaMaster & TimeMaster Spectrofluorometer (Photon Technology International, Inc).3. Results and discussion
Fig. 1 shows the main steps of the fabrication of Au/LFO photocathode by facile sol–gel process. In this work, we used sputtering to deposit an ultra-thin 60 nm Au film as buffer layer on FTO conductive substrate in Fig. 1a. A stable LFO sol was prepared from La(NO3)3·6H2O, Fe(NO3)3·9H2O and citric acid monohydrate. This russet transparent LFO precursor solution was added to the center of conductive substrate and exhibit improved extensibility on Au buffer layer which makes a contribution to the formation of uniform LFO film in Fig. 1b. After thermolysis, Au/LFO was obtained and the photographs were shown in Fig. 1c. One can find that compared with LFO, Au/LFO shows a darker color, suggesting that the obtained Au/LFO multiple layers could alter the refractivity26 and enhance the optical absorption.X-ray diffraction (XRD) measurement was applied to investigate the crystalline phase structure of the obtained films. Fig. 2a displays the XRD patterns of LFO and Au/LFO. As shown, both the LFO and Au/LFO show the main characteristic peaks which are in good agreement with the reported XRD data of perovskite LaFeO3 (JCPDS no: 37-1493). Compared to LFO, Au diffraction peaks could be clearly identified in Au/LFO (marked with green arrowhead), confirming the existence of Au buffer layer. In addition, the diffraction peak of Au/LFO located at 2θ = 32.70 [corresponding to the (121) plane] is much higher than that of LFO, suggesting that the film grows along the 〈121〉 orientation preferentially. Thereafter, we performed SEM measurement to investigate the morphologies of the samples. Typical SEM image of LFO is shown in Fig. 2b. The obtained film reveals a porous structure on its uniform surface and the porous sizes are almost irregular. Notably, the SEM image of Au/LFO exhibits a superior morphology where the density of surface defects is dramatically reduced (Fig. 2c). The superior morphology of Au/LFO reveals that the crystalline quality could be significantly improved during the growth process attributed to the presence of Au film.
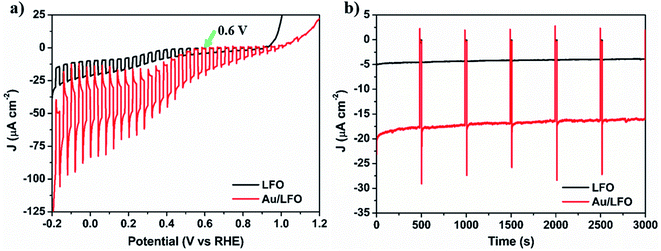
Then we measured the PEC response for LFO and Au/LFO under chopped illumination recorded in 0.1 M Na2SO4 solution. Fig. 3a shows the photocurrent density–potential profiles (J–V) of LFO and Au/LFO, both of the curves show cathodic photocurrent, indicating a p-type behavior. Notably, one can find that compared with LFO, the photoresponse of Au/LFO is significantly increased between −0.2 V to 0.8 V. A significant transient photocurrent of Au/LFO implied that a large number of electrons cannot travel to the electrolyte in time for the interfacial electron transfer reaction. As a result, the excess e–h pairs recombine in the LFO, leading to the decay of the photocurrent density. The photocurrent density becomes stable until the balance among the charge generation, separation, transport and recombination is achieved. No significant transient photocurrent for pristine LFO is observed due to its weak light absorption and low-degree charge separation. Considering that the dark current of the J–V plot is not flat because of the catalytic property of LFO,18 the photoresponse is quantitatively analyzed at 0.6 V, where the dark current is not significant (marked with the green arrow). Specifically, at 0.6 V vs. RHE, the current density is increased from −4.82 μA cm−2 to −19.60 μA cm−2 by combining LFO with Au buffer layer, which approaches 410% of enhancement. In addition to the increased photoresponse, we also analyzed the stability of LFO and Au/LFO by a chronoamperometry test (Fig. 3b). One can find that the photocurrent of Au/LFO photocathode maintains at ca. −19 μA cm−2 after 3000 s, which is much longer than some other p-type semiconductors such as Cu2O whose photocurrent decayed to 0 after 20 min even with 11 nm TiO2 protective layer.27 Moreover, the photocurrent density of Au/LFO maintains ca. 91.0% from 750 s to 2750 s, which is slightly higher than 88.6% of LFO. These results show that by combining Au buffer layer and LFO, Au/LFO perform an efficient photoresponse and more stable photocurrent generation.
 | ||
| Fig. 3 (a) J–V plot and (b) J–t plot at 0.6 V vs. RHE of LFO film coated on FTO (black) and Au/FTO (red) under chopped AM 1.5G illumination in 0.1 M Na2SO4. | ||
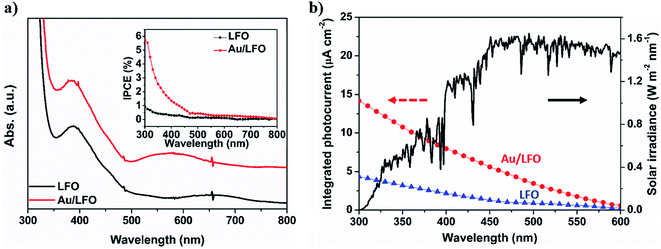
In general, PEC performance depends on the light absorption, electronic separation efficiency, and charge collection28,29 following the equation: Jph = Jabs × ηseparation × ηcollection, where Jabs is the photocurrent density converted from the absorbed photons, ηseparation is the yield of the photogenerated surface-reaching electrons, and ηcollection is charge collection efficiency. We then performed the optical and electrochemical measurements to discuss the mechanism of Au buffer layer on the increased PEC performance of Au/LFO. Fig. 4a shows the absorbance spectra of LFO and Au/LFO from 300 to 800 nm. Compared with LFO, the absorption intensity of Au/LFO is significantly increased in the visible-light region, which may be attributed to the effective light scattering of Au film. The increased light absorption facilitates charge generation, which is confirmed by the incident photon to charge carrier efficiency (IPCE) measurements (inset of Fig. 4a). A slight peak at ca. 550 nm was observed which is consistent with the optical properties of Au,30 indicating the successful conjugation of Au buffer layer with LFO. The IPCE value at the peak maximum of ca. 300 nm for Au/LFO is 5.8%, which shows 5 times higher than that of LFO. Namely, Au film can effectively improve light absorption, resulting in an increase in photocurrent converted from the absorbed photons (Jabs). Besides, the simulated photocurrent can be obtained by integrating over the whole solar photocurrent spectrum which yields from multiplication of the IPCE with the photon flux density of AM 1.5G (Fig. 4b). The pristine LFO and Au/LFO achieve a predicted photocurrent of 4.35 μA cm−2 and 14.16 μA cm−2, respectively, close to the absolute value of the J–V results.
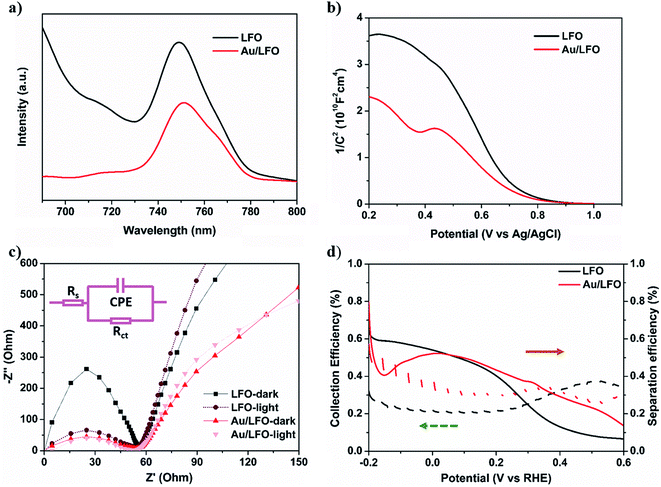
Considering that PL intensity is strongly related to the e–h separation efficiency,31 we then evaluate the effect of Au film on ηseparation by PL measurements. As shown in Fig. 5a, the spectra of Au/LFO and LFO both show the PL peak at ca. 750 nm, which is a typical peak of LFO. We note that compared with LFO, the PL intensity of Au/LFO decreased to 54%. Generally, the decreased PL intensity results from the decreased light absorbance, increased hole trapping effect, and the e–h separation. Considering that (i) the absorbance of Au/LFO is increased, and (ii) the crystal quality of Au/LFO is better than LFO as we discussed above which suppress the hole trapping,32 we suggested that the efficient charge dissociation is the main reason for the decreased photogenerated carrier recombination. In other words, the Au buffer layer facilitates to improve the ηseparation.
Also, ηcollection between Au and LFO is discussed by Mott–Schottky approximation and electrochemical impedance spectra. Compared with LFO, the slope of Mott–Schottky approximation of Au/LFO drops obviously (Fig. 5b), indicating an increase in hole densities collected at the interface. To gain more insight into the enhanced PEC performance of Au/LFO, EIS measurements of LFO and Au/LFO were performed in the dark and under light illumination, respectively. The relevant equivalent circuit contains constant-phase element (CPE), series resistance (Rs) and charge transfer resistance Rct (inset of Fig. 5c). The arc diameter is related to the Rct at the electrode/electrolyte interface. Regardless in dark condition or with light illumination, the impedance value (arc diameter) for Au/LFO is much smaller than that of LFO, indicating the enhancement of the electron mobility at the Au/LFO interface. Meanwhile, the samples under light illumination exhibits smaller arc diameter, indicating a decrease of charge transfer under the illumination. To quantify the ηcollection and ηseparation, J–V curves of H2O2 reduction were measured containing H2O2 as an electron scavenger. The collection efficiency and separation efficiency were estimated by the relation  and
and  , respectively, where Jabs is the photocurrent density at 100% internal quantum efficiency.33 Fig. 4d presents the charge separation and charge collection yield for LFO and Au/LFO. Namely, based on these analyses, we deduced that the Au buffer layer could improve light harvesting, charge separation and electrical conductivity, thus facilitating the increment in photocurrent.
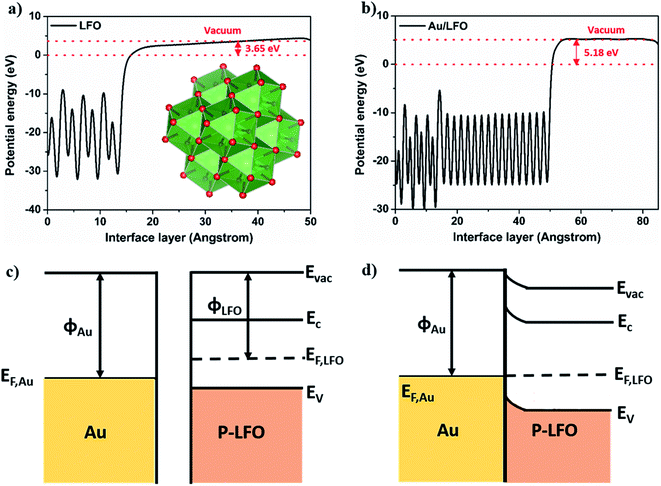
To further discuss the relationship between the presence Au buffer layer and the photocurrent enhancement, we calculate the work functions of LFO and Au/LFO at the interface using the Vienna ab initio simulation package (VASP). According to the first principle pseudopotential method, the work functions of LFO and Au/LFO are ca. 3.65 and 5.18 eV, respectively. Fig. 6c and d show the energy diagram of Au and p-LFO semiconductor contact. When Au and p-type LFO are in contact, the free holes will flow from Au to LFO until the Fermi levels of Au and LFO are aligned. Under equilibrium, the Au is negatively charged and LFO is positively charged near its surface.34 Due to the low concentration of free charge carriers in the LFO semiconductor, the electric field between Au and LFO interfaces cannot be effectively screened in the LFO.35 Meanwhile, the energy band bends upward to the interface (from LFO to Au) because of the electric field between LFO and Au. This band bending promotes the photo-excited holes transferring to Au and reduces bulk recombination. As a result, Au/LFO exhibited improved photoresponse compared to the LFO.
4. Conclusions
In summary, FTO/Au/LFO photocathode was prepared by inserting Au thin layer between LFO and FTO photocathode. The advanced FTO/Au/LFO photoelectrodes show an enhanced photocurrent density. The photocurrent density has been enhanced from −4.82 μA cm−2 to −19.60 μA cm−2 at 0.6 V vs. RHE. The superior PEC activity of FTO/Au/LFO is ascribed to the presence Au buffer layer which makes a dominate contribution to improved light harvesting, promoted separation of photogenerated charges, and improved electrical conductivity. These results reveal an exciting prospect of the optimized LFO photocathode for water splitting in a PEC cell.Conflicts of interest
There are no conflicts to declare.Acknowledgements
This work was supported by National Natural Science Foundation of China (Grant No. 51702130, 61604062, 11504142), Natural Science Foundation of Jiangsu Province (No. BK20170550), the Project of Zhenjiang Key Laboratory of Advanced Sensing Materials and Devices (No. SS2018001), China Postdoctoral Science Foundation (No. 2018M632196) and Research Fund of Jiangsu University (No. 17JDG005, 17JDG014). D. C. appreciates the support from Jiangsu Specially-Appointed Professors Program.References
- A. Fujishima and K. Honda, Nature, 1972, 238, 37–38 CrossRef CAS PubMed.
- X. Chen, S. Shen, L. Guo and S. S. Mao, Chem. Rev., 2010, 110, 6503–6570 CrossRef CAS PubMed.
- Y. Tachibana, L. Vayssieres and J. R. Durrant, Nat. Photonics, 2012, 6, 511–518 CrossRef CAS.
- S. N. Tijare, M. V Joshi, P. S. Padole, P. A. Mangrulkar, S. S. Rayalu and N. K. Labhsetwar, Int. J. Hydrogen Energy, 2012, 37, 10451–10456 CrossRef CAS.
- L. Gao, F. Li, H. Hu, X. Long, N. Xu, Y. Hu, S. Wei, C. Wang, J. Ma and J. Jin, ChemSusChem, 2018, 11, 2502–2509 CrossRef CAS PubMed.
- Y. Wang, J. Liu, Y. Huang, Z. Wang, Q. Li, S. Yue, K. Liu, S. Yan, M. Liu, D. Cao, Y. Li, Z. Wang, X. Yang and S. Qu, J. Electrochem. Soc., 2019, 166, H418–H424 CrossRef CAS.
- Y. Huang, J. Liu, D. Cao, Z. Liu, K. Ren, K. Liu, A. Tang, Z. Wang, L. Li, S. Qu and Z. Wang, Int. J. Hydrogen Energy, 2019, 44, 13242–13252 CrossRef CAS.
- B.-T. Zhang, J. Liu, S. Yue, Y. Teng, Z. Wang, X. Li, S. Qu and Z. Wang, Appl. Catal., B, 2017, 219, 432–438 CrossRef CAS.
- Z. Zhang and P. Wang, J. Mater. Chem., 2012, 22, 2456–2464 RSC.
- J. Luo, L. Steier, M.-K. Son, M. Schreier, M. T. Mayer and M. Grätzel, Nano Lett., 2016, 16, 1848–1857 CrossRef CAS PubMed.
- L. Wu, L. Tsui, N. Swami and G. Zangari, J. Phys. Chem. C, 2010, 114, 11551–11556 CrossRef CAS.
- J. He, H. Lindström, A. Hagfeldt and S.-E. Lindquist, J. Phys. Chem. B, 1999, 103, 8940–8943 CrossRef CAS.
- B. A. Nail, J. M. Fields, J. Zhao, J. Wang, M. J. Greaney, R. L. Brutchey and F. E. Osterloh, ACS Nano, 2015, 9, 5135–5142 CrossRef CAS PubMed.
- Y. Oh, W. Yang, J. Tan, H. Lee, J. Park and J. Moon, Adv. Funct. Mater., 2019, 29, 1900194 CrossRef.
- S. Wei, N. Xu, F. Li, X. Long, Y. Hu, L. Gao, C. Wang, S. Li, J. Ma and J. Jin, ChemElectroChem, 2019, 6, 3367–3374 CrossRef CAS.
- N. Xu, F. Li, L. Gao, H. Hu, Y. Hu, X. Long, J. Ma and J. Jin, ACS Sustainable Chem. Eng., 2018, 6, 7257–7264 CrossRef CAS.
- N. Xu, F. Li, L. Gao, H. Hu, Y. Hu, X. Long, J. Ma and J. Jin, Int. J. Hydrogen Energy, 2018, 43, 2064–2072 CrossRef CAS.
- G. P. Wheeler and K.-S. Choi, ACS Energy Lett., 2017, 2, 2378–2382 CrossRef CAS.
- Q. Peng, J. Wang, Y. W. Wen, B. Shan and R. Chen, RSC Adv., 2016, 6, 26192–26198 RSC.
- Q. Peng, B. Shan, Y. Wen and R. Chen, Int. J. Hydrogen Energy, 2015, 40, 15423–15431 CrossRef CAS.
- M. I. Díez-García and R. Gómez, ChemSusChem, 2017, 10, 2457–2463 CrossRef PubMed.
- G. S. Pawar, A. Elikkottil, S. Seetha, K. S. Reddy, B. Pesala, A. A. Tahir and T. K. Mallick, ACS Appl. Energy Mater., 2018, 1, 3449–3456 CrossRef CAS.
- D. Cao, N. Nasori, Z. Wang, Y. Mi, L. Wen, Y. Yang, S. Qu, Z. Wang and Y. Lei, J. Mater. Chem. A, 2016, 4, 8995–9001 RSC.
- C. Li, T. Hisatomi, O. Watanabe, M. Nakabayashi, N. Shibata, K. Domen and J.-J. Delaunay, Energy Environ. Sci., 2015, 8, 1493–1500 RSC.
- J. Kong, W. A. Yee, L. Yang, Y. Wei, S. L. Phua, H. G. Ong, J. M. Ang, X. Li and X. Lu, Chem. Commun., 2012, 48, 10316–10318 RSC.
- M. A. Kats, S. J. Byrnes, R. Blanchard, M. Kolle, P. Genevet, J. Aizenberg and F. Capasso, Appl. Phys. Lett., 2013, 103, 101104 CrossRef.
- A. Paracchino, V. Laporte, K. Sivula, M. Grätzel and E. Thimsen, Nat. Mater., 2011, 10, 456 CrossRef CAS PubMed.
- H. Zhao, Q. Wu, J. Hou, H. Cao, Q. Jing, R. Wu and Z. Liu, Sci. China Mater., 2017, 60, 239–250 CrossRef CAS.
- O. Zandi, A. R. Schon, H. Hajibabaei and T. W. Hamann, Chem. Mater., 2016, 28, 765–771 CrossRef CAS.
- M. D. Musick, C. D. Keating, L. A. Lyon, S. L. Botsko, D. J. Peña, W. D. Holliway, T. M. McEvoy, J. N. Richardson and M. J. Natan, Chem. Mater., 2000, 12, 2869–2881 CrossRef CAS.
- V. A. Fonoberov, K. A. Alim, A. A. Balandin, F. Xiu and J. Liu, Phys. Rev. B: Condens. Matter Mater. Phys., 2006, 73, 165317 CrossRef.
- M. Wu, W.-J. Chen, Y.-H. Shen, F.-Z. Huang, C.-H. Li and S.-K. Li, ACS Appl. Mater. Interfaces, 2014, 6, 15052–15060 CrossRef CAS PubMed.
- L. Gao, X. Long, S. Wei, C. Wang, T. Wang, F. Li, Y. Hu, J. Ma and J. Jin, Chem. Eng. J., 2019, 378, 122193 CrossRef CAS.
- Z. Zhang and J. T. Yates, Chem. Rev., 2012, 112, 5520–5551 CrossRef CAS PubMed.
- C. Jiang, S. J. A. Moniz, A. Wang, T. Zhang and J. Tang, Chem. Soc. Rev., 2017, 46, 4645–4660 RSC.
| This journal is © The Royal Society of Chemistry 2019 |


