 Open Access Article
Kinetics of fluoride-catalysed synthesis of organosilica colloids in aqueous solutions of amphiphiles†
Teh-Min Hu *ab,
Chien-Yu Lina and
Meng-Ju Wua
aFaculty of Pharmacy, School of Pharmaceutical Sciences, National Yang-Ming University, Taipei 112, Taiwan. E-mail: tehmin@ym.edu.tw
bCenter for Advanced Pharmaceutics and Drug Delivery Research, National Yang-Ming University, Taipei 112, Taiwan
First published on 6th September 2019
Abstract
Reactions involving hydrophobic reactants in water can be much accelerated in organic solvent-free solutions containing amphiphiles at neutral pH and room temperature. Previously, we demonstrated that organosilica colloidal particles could be conveniently synthesized by a versatile salt-catalysis method in solutions modified with various amphiphilic molecules. The method precludes the use of any solvent, any added form of energy (thermal or mechanical), and any strong (or hazardous) acids/bases. Herein, the kinetic properties of the reaction were systematically investigated for fluoride-catalysed synthesis of colloidal organosilica from a thiol-functionalized organosilane precursor, (3-mercaptopropyl)trimethoxysilane. Continuous, real-time ATR-FTIR measurements allowed probing the time evolution of organosilica condensation in different reaction systems, containing one of the following: non-ionic surfactants (Tween 20, Tween 40, Tween 60, Tween 80, Triton X-100), anionic surfactant (sodium dodecyl sulphate; SDS), cationic surfactant (cetyltrimethylammonium bromide; CTAB), and amphiphilic polymers (polyvinyl alcohol and polyvinylpyrrolidone). Overall, while some amphiphile-specific properties were revealed, fluoride-catalysed synthesis was ultrafast with a universal two-phase kinetic scheme (e.g. transition within 5–10 min) for all amphiphiles studied.
Introduction
Chemical synthesis in organic solvent-free, pure water media has attracted much attention in the fields of synthetic chemistry and catalysis. However, for a hydrophobic substance to be effectively reacting “in water” without organic solvents, surfactants or amphiphiles are required to solubilize or concentrate the reactant in self-assembled micellar phases, where reaction takes place.1–3 Indeed, the rate of chemical reactions can be markedly accelerated in such microreactors or nanoreactors.4–6 In the past decade, aqueous micellar catalysis has been successfully applied for catalysing a wide range of organic reactions.7–9 Moreover, besides small molecular compounds, polycondensed polymers or even hard particle materials can also be synthesized in amphiphile-modified systems.10,11Silica particles are promising products with cross-disciplinary applications, spanning chemical, engineering, manufacturing, and biomedical fields.12,13 Previously, silica polycondensation can be conveniently prepared via an acidic or basic aqueous route.14 Besides, purely aqueous synthesis of silica particles can also be conducted at neutral pH with the biomimetic route.15–24 Organo-functionalized silica particles can be directly synthesized from organosilane precursors with various functional groups (e.g. SH, amine, and various alkyl groups).25–31 The reported methods often involved acid- or base-catalysis, and organic solvents were frequently used.25–31 Previously, there have been several attempts to prepare organosilica particles in a solvent-free system, based mainly on acidic or basic routes.32–37 Most recently, we have demonstrated a general “salt route” for efficiently synthesizing organosilica nanospheres in purely aqueous reaction systems containing common salts and common surfactants or polymers.38 We demonstrated that under the mild reaction conditions (neutral pH, room temperature, no stirring), stable colloidal solutions containing organosilica nanoparticles (about 100 nm) could be produced within 24 h.38
Fluoride ion (F−) has been used as a catalyst to mediate the hydrolysis and condensation of silica precursors and form mesoporous or microporous solid materials.39–41 The advantages of fluoride catalysis included versatility in producing porous silica materials without using structure directing agents and capability in allowing “one pot” synthesis at nearly neutral pH.39 Moreover, the method is also suitable for preparing hybrid porous solids functionalized with desired organic groups.40 However, the above-mentioned fluoride route was mainly used in the context of preparing dry bulk silica-gel solids; and a large proportion of an organic solvent was still needed, along with vigorous stirring, and extended aging time at an elevated temperature. To the best of our knowledge, the application of the fluoride route for synthesizing stable organosilica colloidal particles in purely water solutions at neutral pH and room temperature, is scarce.
To introduce the “salt route”, our previous study was focused on reaction systems involving sodium nitrite and Tween 20.38 Sodium fluoride and other salts were also included to show the generality of the method without extensive characterization in various surfactant systems. Of those salts studied, sodium fluoride particularly attracted our attention, because it generated ultrafast reactions (i.e. near completion in 15 min). However, several questions specifically related to fluoride catalysis, or in general, to salt catalysis, remain to be addressed. For example, it is not clear how fluoride acts in different surfactant systems. Moreover, to better understand the salt method, the kinetics of the reaction system needs to be extensively characterized. In this present study, we conducted a thorough kinetic investigation on sodium fluoride-catalysed formation of organosilica colloids in aqueous solutions containing various types of surfactants or amphiphilic macromolecules. Herein, the kinetic data based on in situ continuous ATR-FTIR measurements are presented. Our study reveals the role of fluoride in mediating two-phase catalysis in aqueous media containing a wide range of amphiphiles. Furthermore, the study also unveils differences hidden behind similarities of various amphiphile systems.
Experimental
Materials
(3-Mercaptopropyl)trimethoxysilane (MPTMS, 95%), sodium fluoride, Tween 20, Tween 40, Tween 60, Tween 80, Triton X-100, cetyltrimethylammonium bromide (CTAB, 98%), polyvinyl alcohol (PVA; MW 9000–10![[thin space (1/6-em)]](https://www.rsc.org/images/entities/char_2009.gif) 000, 80% hydrolysed), and polyvinylpyrrolidone (PVP, MW 10
000, 80% hydrolysed), and polyvinylpyrrolidone (PVP, MW 10![[thin space (1/6-em)]](https://www.rsc.org/images/entities/char_2009.gif) 000) were purchased from Sigma-Aldrich (St. Louis, MO, U.S.A.). Sodium dodecyl sulphate (SDS) was obtained from J.T. Baker. All chemicals were used as received. Deionized water was used throughout the experiment.
000) were purchased from Sigma-Aldrich (St. Louis, MO, U.S.A.). Sodium dodecyl sulphate (SDS) was obtained from J.T. Baker. All chemicals were used as received. Deionized water was used throughout the experiment.
The reaction
The reaction solution contained only (3-mercaptopropyl) trimethoxysilane (MPTMS), sodium fluoride (NaF), and a surfactant or amphiphilic polymer in de-ionized water. The reaction was performed either in a capped glass container or in a 96-well microplate. After mixing the solution by gentle pipetting, the reaction was run at room temperature without mechanical stirring. Unless otherwise stated, the typical concentration used in the FTIR study was 100 mM for MPTMS, 160 mM for NaF, and 0.625% for surfactants or polymers.Turbidity kinetics
The turbidity of a reaction in a 96-well plate was real-time monitored by absorbance measurements at 800 nm with a multimode microplate reader (Tecan SPARK 10M, Switzerland). The microplate format enabled simultaneous kinetic measurement for solutions with varied NaF or surfactant concentrations. The reaction was monitored over 60 or 120 min.Particle size determination
Hydrodynamic diameters were measured with dynamic light scattering (DLS) using a Malvern Zetasizer (Nano Series ZS90, UK). The intensity averaged (Z-average) hydrodynamic diameter and polydispersity index (pdi) were obtained.Particle size evolution over time
Continuous DLS size measurements were conducted in 1 mL reaction solutions containing 100 mM MPTMS, 5% Tween 20, and NaF at 40, 80, and 160 mM. After mixing the solution, the Z-average diameter and polydispersity index were measured at the following time points: 1, 3, 5, 10, 15, 20, 25 and 30 min. A 10-fold dilution was used before DLS measurements for concentrated colloids formed at the latter time points.Scanning electronic microscopy
The SEM images of air-dried, platinum-coated samples were acquired from a JSM-7600F field emission scanning electron microscope (JEOL, Japan) operated at 5 kV incident energy.Real-time ATR-FTIR analysis
In situ real-time ATR-FTIR study was conducted in a Fourier-transform infrared spectrophotometer (IRAffinity-1S, Shimadzu, Kyoto, Japan) equipped with an attenuated total reflectance (ATR) sampling unit (MIRacle, PIKE Technologies, Madison, USA). The reaction was started by adding 160 mM sodium fluoride to a sample solution containing 100 mM MPTMS and a surfactant or polymer at 0.625% in water with quick mixing (pipetting 5 times). An aliquot of the sample solution (0.1 mL) was immediately taken and added to the ATR crystal. Before each run, the ZnSe crystal was rinsed and cleaned with ethanol. The FTIR spectra were continuously acquired at a 1 minute interval for 15 min in the wavenumber range of 4000 and 650 cm−1. The transmittance (% T) data were transformed to absorbance (A) using the relationship: A = 2 − log(% T). The differential absorbance (i.e. absorbance at any given time (t) minus absorbance at t = 1 min) was calculated and reported. The kinetic profiles presented are mean of three independent measurements.Results and discussion
Overview of the reaction system
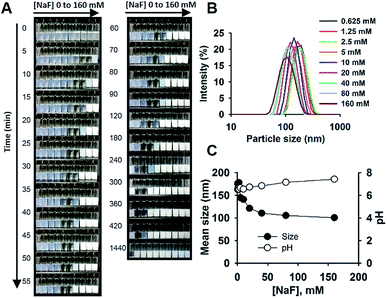
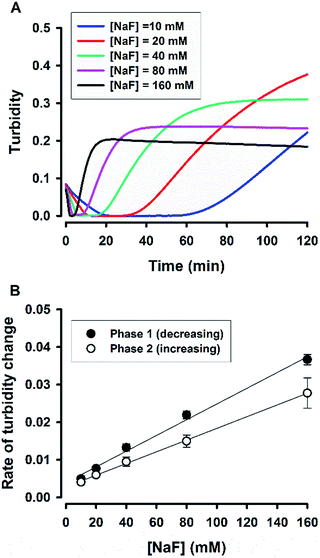
The reaction system is exemplified in Fig. 1. The reaction solution consisted of sodium fluoride (NaF), Tween 20, MPTMS, and water. No other solvents or reagents were needed. The reactions were performed in capped glass bottles at room temperature, requiring no mechanic stirring. The simplicity of reaction allowed for running simultaneous batch reactions for the purpose of comparison. Fig. 1A shows the images of the time evolution of reactions at different concentrations of NaF (0 to 160 mM). As can be seen, brightly white colloid solutions were formed within 5 min at [NaF] = 160 mM, followed by sequential formation of colloidal solutions over time for lower concentrations of NaF. All the opaque initial solutions became clear first, then milky white colloids were formed. The images and a ESI video (Video S1†) indeed show the “movement” of the reaction “wave”. It is of interest to note that in the studied concentration range of NaF, the time scale varied widely from several minutes to several hours; and at very low concentrations of NaF (e.g. ∼1 mM), colloidal solutions can be formed within 24 h (Fig. 1A). Accordingly, all the reactions were stopped at 24 h for further comparison and characterization. Fig. 1B shows the distribution curves of hydrodynamic sizes of colloidal particles formed at 24 h. Generally, the data indicate homogeneous particle size distribution with a polydispersity index < 0.1. The SEM image shows spherical nanoparticles (Fig. S1†). Moreover, the mean sizes decreased from ∼180 nm at [NaF] = 0.625 mM to ∼100 nm at [NaF] > 40 mM (Fig. 1C). The pH of the reaction system was around the neutral value, ranging from 6.5 to 7.4 at increasing [NaF] (Fig. 1C).The change of solution appearance over time can be real-time monitored in a microplate-based reaction format.38 Fig. 2A shows the turbidity kinetics measured over 2 h for fluoride-mediated catalysis in 5% Tween 20 solutions. The kinetic profiles exhibit rapid initial decline of turbidity (the first phase); after a lag period, turbidity starts to build up (the second phase), and finally it reaches a plateau. For the highest fluoride concentrations (i.e. 160 mM), the whole process completed in ca. 15 min. However, the lower the fluoride concentrations, the longer is the observed lag period (where the solution became clear, as shown in Fig. 1A). The data clearly reveal the catalytic role of fluoride in controlling the time course of the reaction. To further demonstrate the dependency of the reaction on fluoride, the rates of the first phase (turbidity declining) and the second phase (turbidity increasing) were estimated and plotted against fluoride concentrations in Fig. 2B. Both of the observed rates of turbidity change showed linear relationships with [NaF], suggesting that the reaction is an apparent first-order reaction with respect to fluoride.
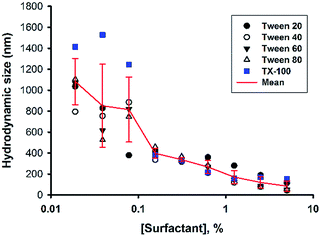
Next, the concentration of the surfactant (Tween 20) was further titrated at a fixed fluoride concentration (160 mM). It can be seen in Fig. 3 that the shape of the turbidity time profiles remained similar at reducing concentrations of Tween 20 (from 5% to 0.313%), i.e. fast initial drop, followed by rapid elevation. The only difference was the absolute turbidity, where reactions with higher surfactant concentrations systematically showed less turbidity. The data suggest that the reaction system with higher surfactant concentrations produced smaller droplets (e.g. in the first phase) and/or particles (e.g. in the second phase and thereafter). Indeed, when the hydrodynamic sizes of colloidal particles formed at the end of reaction were measured, the results showed reducing particle sizes at increasing surfactant concentrations (Fig. 4). It is noted that all of the non-ionic surfactant tested (including Tween 20) showed similar size-reduction effect.
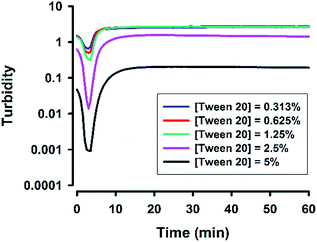 | ||
| Fig. 3 Effect of surfactant concentrations on turbidity kinetics. Typical kinetic traces for reactions at various [Tween 20]; [NaF] = 160 mM, [MPTMS] = 100 mM, room temperature. | ||
The turbidity data demonstrate that the reaction system can undergo a swift phase change within 5 min at 160 mM NaF. To corroborate this finding, the dynamical evolution of particle sizes was investigated over the reaction time course. It can be seen from Fig. 5 that initially the particle size was >1 μm; within 5 min the size immediately reduced to about 100 nm with consistent size distribution over an extended reaction time. However, high polydispersity was noted at 3 min, epitomizing a transition state, at which micrometer-sized precursor droplets are depleting, whereas nanoscale colloidal particles start to emerge. At the transition, the solution became transparent, as shown in Fig. 1A and Video S1,† thereby resulting in unreliable dynamic-light-scattering measurements with high polydispersity. Indeed, the kinetic pattern was reproduced in the experiment with lower NaF concentrations, showing fluoride concentration-dependent transition time (Fig. S2†).
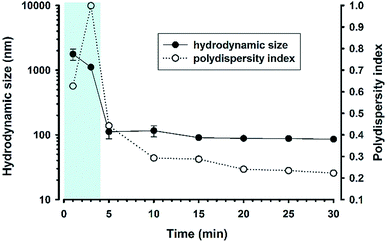 | ||
| Fig. 5 Time evolution of hydrodynamic particle sizes and polydispersity index. Reaction condition: [MPTMS] = 100 mM, [NaF] = 160 mM, [Tween 20] = 5%, room temperature. N = 3. | ||
After realizing that fluoride-catalysed synthesis of organosilica colloids could be highly efficient and versatile with the use of low concentrations of fluoride and surfactants, the following experiments were to investigate the kinetics of organosilica condensation and formation of colloidal particles in the proposed reaction system using in situ ATR-FTIR measurements. The reactions were run at 160 mM NaF and 0.625% amphiphiles to ensure fast kinetics with high kinetic resolution of FTIR spectra. The data will be separately presented for non-ionic surfactants, amphiphilic polymers, anionic surfactants, and then cationic surfactants.
Non-ionic surfactants
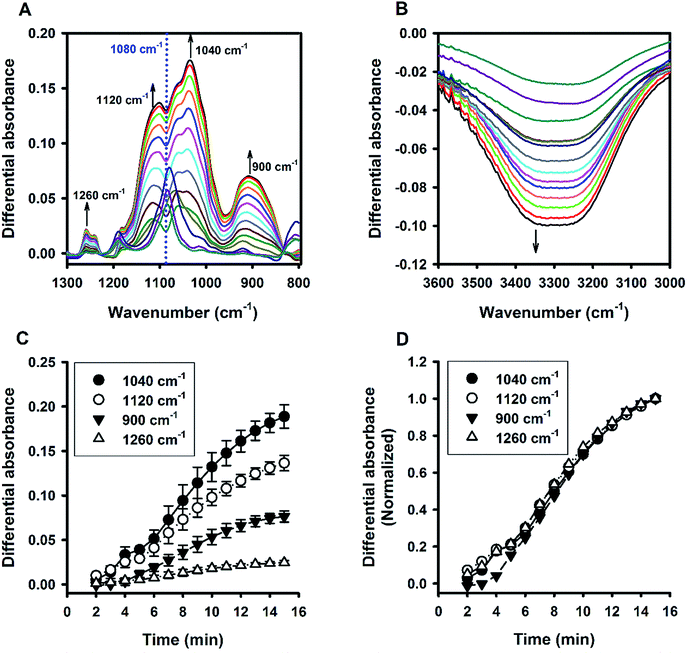
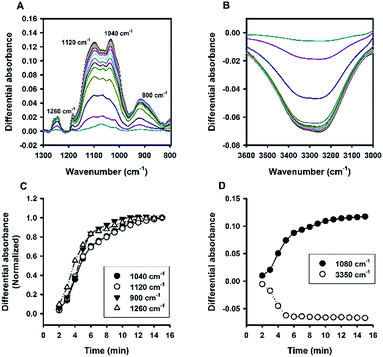
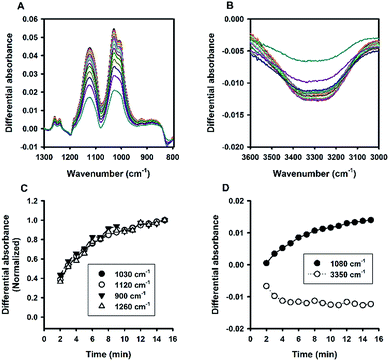
Fig. 6A shows the time evolution of FTIR absorbance spectra in the range of 1300 to 800 cm−1 for a reaction system containing 100 mM MPTMS, 160 mM NaF, and 0.625% Tween 20. Four wavenumbers were specifically labelled, where the absorbance were continuously increased with the reaction time. Indeed, the FTIR bands around the labelled wavenumbers (i.e. 900, 1040, 1120, and 1260 cm−1) have been assigned for indicating silane poly-condensation and the formation of Si–O–Si bonds.42–46 Furthermore, to demonstrate the change of hydrophilic interactions within the reaction system over time, the absorbance spectra that cover water's stretching and bending vibrations are shown in Fig. 6B and S3,† respectively. Apparently, both the stretching (e.g. at 3400 cm−1, Fig. 6B) and bending peak (e.g. at 1640 cm−1,47 Fig. S3†) underwent similar dynamic changes over time, manifesting the interaction of existing and newly formed molecular structures with water.46 Fig. 6C shows the quantitative absorbance data as a function of time. The kinetic data indicate slow initial rate, and a fast transition occurred at about 4 min, where the rate increased sharply. When the data were normalized to the maximal value at 15 min, the kinetics profiles were almost superimposed, and the two phase kinetics was more clearly revealed. The result suggests that all of the specified wavenumbers could be used for monitoring the kinetics of organosilica condensation in the proposed reaction system. Moreover, the two phase kinetics was consistent with the turbidity kinetics in which the first phase could be attributed to fluoride-mediated rapid hydrolysis of the organosilane precursor, whereas the second phase is due to accelerated organosilica condensation from the hydrolysed species. Such a phase transition was also evident at peaks near 1080 and 3350 cm−1 (Fig. 7), where kinetic profiles are almost symmetrical with a transition at around 4 min. Initially, the solution contains mainly MPTMS, which has a characteristic absorbance peak at 1080 cm−1 (Fig. 6A), representing the Si–O–C stretching of the molecule.48 However, the absorbance at 1080 cm−1 increased before 4 min, which is inconsistent with expected hydrolysis reaction at the initial stage. The apparent anomalous spectra evolution might be due to initial accumulation of MPTMS droplets near the ATR light path (discussed later). In other words, the Tween-20 system is inhomogeneous and physically unstable in the first 4 min. Indeed, the physical instability could also be revealed by the spectra intensity at around 3350 cm−1, which reports the interaction involving hydrogen bonding between water and dispersed macro- or nano-structures;46—thus, the initial rise in absorbance at 1080 cm−1 (due to accumulation of hydrophobic droplets) correlates with absorbance reduction at 3350 cm−1 (i.e. decreasing hydrogen bonding). Nevertheless, after the initial state, the system switched to another state where initial MPTMS signal disappeared, as evident by immediate drop of absorbance at 1080 cm−1 at 5 min (Fig. 7). However, as the reaction further proceeded, the overall intensity at the band around 1080 cm−1 increased dramatically. Since the newly formed Si–O–Si bands overlapped with that of MPTMS, the elevation of difference spectra at the region with an inverted peak at 1080 cm−1 further indicate continuous polycondensation, thereby consumption, of the silane precursor. In this second phase, the spectra changes at 1080 cm−1 again correspond well with that at 3350 cm−1 (Fig. 7). To sum up, the FTIR results indicate continuous self-assembly of polycondensed species and formation of colloidal particles in the aqueous solution system.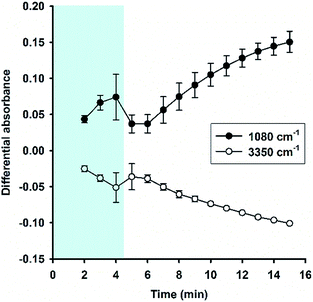 | ||
| Fig. 7 Kinetic absorbance profiles at two characteristic bands (1080 cm−1 vs. 3350 cm−1). Data derived from Fig. 6; N = 3. | ||
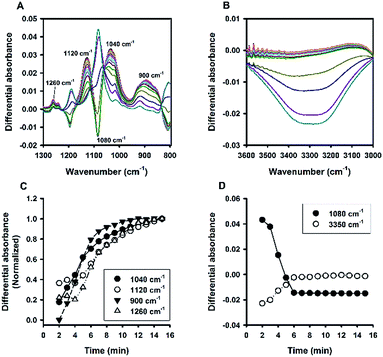
Besides Tween 20, the fluoride-catalysed reaction was also conducted in aqueous solutions containing other polysorbate surfactants, e.g. Tween 40, Tween 60, and Tween 80; and similar ATR-FTIR results were obtained (Fig. S4†). Furthermore, the reaction was also performed in solutions containing another non-ionic surfactant, Triton X-100 (TX-100). Fig. 8 shows the time evolution of ATR-FTIR spectra for the TX-100-modified system. Like in the Tween-based reactions, the relative absorbance tended to grow over time at the characteristic spectral regions (Fig. 8A and C), along with continuous decrease in relative absorbance in the region of 3000 to 3600 cm−1 (Fig. 8B); and again, the symmetry between 1080 cm−1 and 3350 cm−1 was revealed. However, unlike Tween 20-based system, there is no sharp switching in Fig. 8D. By close examination, one can immediately recognize that the initial MPTMS peak at 1080 cm−1 is less dominant in Fig. 8A than in Fig. 6A. This may account for the presence of kinetic discontinuity (breaking) in the former, but not in the latter (i.e. Fig. 6D vs. Fig. 8D). Indeed, Fig. 8D resembles Fig. 6D in a way that Fig. 8D is a faster version of Fig. 6D, where the first instability phase is enfolded. Hence, it is expected that, in the TX-100-based reaction, MPTMS may be more rapid and homogeneously mixed with water and the surfactant, such that the fluoride catalysis is more efficient. This premise could be supported by the comparison of the kinetic profiles of all of the non-surfactants studied. Apparently, Fig. 9 depicts faster kinetics for the TX-100-based reaction.
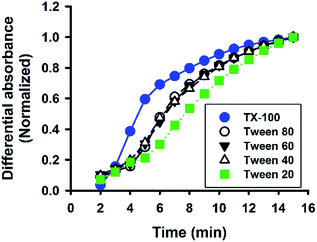 | ||
| Fig. 9 Comparison of reaction kinetics among non-ionic surfactants. Data are normalized absorbance at 1120 cm−1. | ||
Amphiphilic polymers
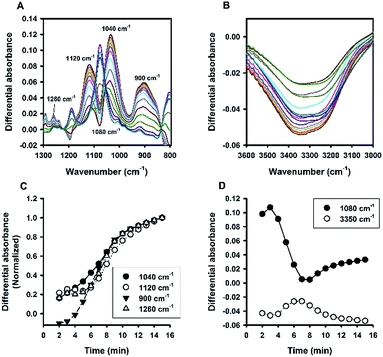
Fluoride catalysis was further investigated in polymer-based solutions containing polyvinyl alcohol (PVA) or polyvinylpyrrolidone (PVP). As can be seen in Fig. S5,† the polymer-based systems also produced particles with sizes in the colloidal range at certain concentrations; and similar to the systems of non-ionic surfactants, the particle sizes decreased with increasing concentrations of polymers. The ATR-FTIR absorbance spectra of PVA were shown in Fig. 10, and those of PVP in Fig. 11. Overall, the two polymers behaved similarly to non-ionic surfactants: i.e. fast organosilica condensation within 15 min (characterized by the spectra evolution at 900, 1040, 1120, and 1260 cm−1; e.g. Fig. 10A, C, 11A and C), and symmetrical kinetic profiles measured at 1080 cm−1 and 3350 cm−1 (e.g. Fig. 10B, D, 11B and D). However, a major difference was identified between polymer- and surfactant-mediated systems—i.e. the marked inverted peak around 1080 cm−1. This is because, unlike in the surfactant system described above, the absolute absorbance at the region near 1080 cm−1 was not significantly elevated over time in the polymer system, thereby causing significant inversion when difference absorbance (i.e. absorbance at time t minus that at initial time) was calculated. Such a contrast suggests that the two systems are fundamentally different in terms of molecular interactions between formed organosilica species and the stabilizing amphiphiles.Anionic surfactants
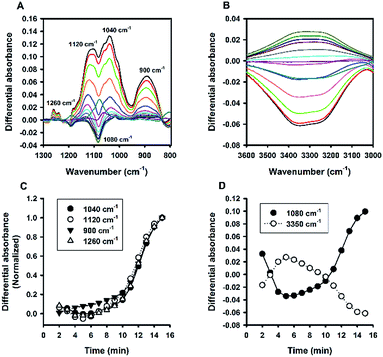
Colloid organosilica can also be generated in sodium dodecyl sulphate (SDS)-based solution (Fig. S6†). Similarly, the kinetics of the SDS-based solution was characterized with continuous ATR-FTIR measurements. Fig. 12A depicts marked elevation in the region of 1000 to 1200 cm−1 over time. Based on the absorbance values at the two characteristic wavenumbers at the region (i.e. 1040 and 1120 cm−1), the extent of elevation was comparable with that of non-surfactants, e.g. Tween 20 (Fig. 6A), and TX-100 (Fig. 8A). However, the quantitative data revealed a much slower reaction in the SDS solution, with a much extended lag time (∼10 min, Fig. 12C). Moreover, the difference spectra in the range of 3000–3600 cm−1 also show unique pattern for the SDS system: the difference absorbance value in this region first increased to positive values, thereby creating a small bump, in the initial 5 min (Fig. 12B). This is consistent with a parallel decrease of absorbance at 1080 cm−1 during the early phase (Fig. 12D). Again, the symmetrical relationship was also preserved in the SDS system. Notably, such a symmetry seemed to be a universal phenomenon, regardless of varied pattern and shape of the kinetic profiles. This argument is supported by the correlation plot showing high degree of correlation between 1080 cm−1 vs. 3350 cm−1 for all of the data thus far presented (Fig. 13).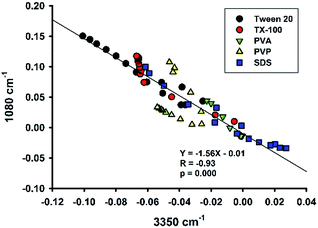 | ||
| Fig. 13 Plot of spectral intensities at 1080 cm−1 vs. spectral intensities at 3350 cm−1 for various amphiphiles. The line is the regression line through all data. | ||
Cationic surfactants
A cationic surfactant, cetyltrimethylammonium bromide (CTAB), was finally included to complete this study. The hydrodynamic sizes of the formed organosilica are shown in Fig. S7.† As can be seen, sub-100 nm particles could be generated at CTAB concentrations extending to very low concentrations. The association of sizes and surfactant concentration was less apparent for CTAB. Moreover, Fig. S7† shows little changes in FTIR spectra, and dynamic evolution was less obvious in several spectral regions. To address this, the turbidity kinetics was recorded for CTAB at lower concentrations. The kinetic profiles shown in Fig. 14 indicate ultrafast decline of turbidity at the initial phase; specifically, at about 1 min, the turbidity reaches to a low equilibrium level without the latter rising phase as seen in other surfactant systems. Only when the CTAB concentration was further reduced to 0.039%, did the kinetic turbidity profile start to reveal the growth phase. Apparently, compared with other surfactants, CTAB has high solubilisation effect. The FTIR study was then re-run at 0.039% CTAB, at which more intensive spectra could be recorded (Fig. 15A and B). Although the spectra differed in some aspects from those obtained for other surfactants, e.g. less obvious peak around 900 cm−1 and slight shifting around 1040 cm−1 (Fig. 15A), the kinetics of organosilica condensation in the CTAB system was revealed and confirmed. The quantitative spectra data (Fig. 15C), together with turbidity kinetics, indicate that fluoride-catalysed reaction was much faster in the CTAB solution, compared with all other amphiphiles studied in this study. Furthermore, the observed symmetry described above can also be reproduced in the CTAB system (Fig. 15D).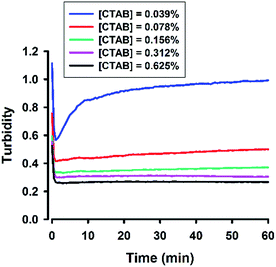 | ||
| Fig. 14 Turbidity kinetics for the CTAB system. The reaction solution contains 100 mM MPTMS, 160 mM NaF, various concentrations of CTAB in water. | ||
Discussion
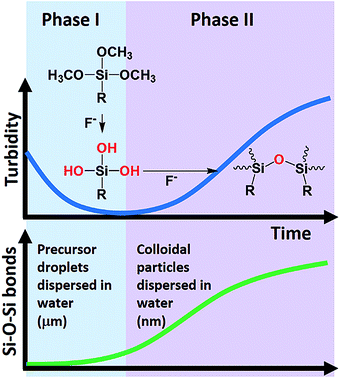
Sodium fluoride (NaF) is a weakly basic salt of hydrogen fluoride (HF, pKa = 3.19, PubChem). However, at the concentrations used in this study (i.e. [NaF] < 160 mM), the solution pH is about neutral. At such a pH range, the major species in the solution is fluoride anion, but not the un-dissociated HF. Accordingly, fluoride anions are considered as the catalytic species in our system. To test this premise, the effect of adding HCl to the reaction solution was evaluated, and the results reported in Fig. S8.† Evidently, the formation of colloid solution was markedly inhibited by HCl. The result is consistent with the presumed role of fluoride as a nucleophile that catalyse the hydrolysis and condensation of organosilane.Based on the turbidity, particle size, and ATR-FTIR data, a two-phase kinetic scheme has been unequivocally revealed. A model of the reaction system is proposed in Scheme 1. The oil-like organosilane (i.e. MPTMS) is first dispersed in water as droplets with the assistance of amphiphiles. The increase of surface area due to solubilisation effect of surfactants increases the possibility of MPTMS-fluoride interaction, thereby enhancing the hydrolysis of silane, and subsequently, formation of silanol groups. Accordingly, the first stage can be attributed to surfactant- and fluoride-mediated silane solubilisation and hydrolysis, which can be visualized in Fig. 1 and confirmed by the turbidity data (Fig. 2 and 3). The silane precursor MPTMS has a characteristic FTIR absorption band at around 1080 cm−1 for Si–O–CH3,48 which is informative for the initial hydrolysis event. It is therefore conceivable that in the initial stage this major band would be decreased over time, as shown in Fig. 10D and 12D. Interestingly, however, in other systems (e.g. Tween 20 and PVP, Fig. 6D and 11D, respectively) the MPTMS peak was increased first then immediately dropped to the lowest point before rising again in the second stage. The initial rising may reflect the dynamic changes of dispersed MPTMS droplets (e.g. by sedimentation) near the interface of ATR crystals and the reaction solution; i.e. transient increase of local MPTMS concentration in the light path (ca. 0.5–2 μm or 1/10 of wavelength)49 before complete hydrolysis.
Following initial solubilisation and hydrolysis, the hydrolysed species was continuously condensed to form organosilica oligomers (Scheme 1), which then self-assembled to produce colloidal particles. In the presence of amphiphiles, the formed particles can be stabilized with sizes at the colloidal range (i.e. <1 μm); and the size decreased to sub-100 nm with increasing amphiphile concentrations (Fig. 4). This second-phase event can be directly observed from clear-to-milky transition of the reaction system (Fig. 1A and Video S1†), as also evidenced by the turbidity kinetics (Fig. 2A). Notably, such a phase transition can occur within 5 min. The transition was faster with increasing concentrations of fluoride (Fig. 1A, Video S1† and Fig. 2). Moreover, the ATR-FTIR results clearly indicate that the Si–O–Si bond was continuously generated in the second phase; and the kinetics of the microscopic chemical changes matched that of macroscopic observations (Scheme 1).
Our reaction system contains initially a hydrophobic organosilane precursor dispersed in water in the presence of fluoride and a surfactant. As the reaction proceeds, the hydrophobic precursor becomes more hydrophilic intermediates, then followed by the formation of hydrophobic final products (i.e. hydrophobic–hydrophilic–hydrophobic transition). The local concentrations of reaction species and final products are expected to change over time at the sampling optical path length. Therefore, the more hydrophobic species accumulated near the sampling interface, the less water signal would be determined by the ATR-FTIR.46 Indeed, the conclusion is supported by our analysis showing a universal observation where the band intensity at 3350 cm−1 is highly significantly, and negatively, correlated with that at 1080 cm−1 (Fig. 13).
Conclusions
Sodium fluoride is a common salt frequently encountered in our daily-life routine (e.g. in the toothpaste). In the present study, we systematically investigate the kinetic property of the fluoride-based, amphiphile-modified reaction system for the synthesis of colloidal organosilica. Quantitative, real-time ATR-FTIR determinations, together with kinetic turbidity and particle size measurements, unveil a two-phase kinetic scheme. The first phase involves rapid disappearance of turbidity, which could be attributed to fluoride-catalysed hydrolysis of the organosilane precursor. After a lag period with a duration depending on concentration of sodium fluoride added, the second phase started with rapid accumulation of polycondensed organosilica species, which formed stable nanoparticles due to the stabilization effect of amphiphiles. Hence, amphiphiles may play two roles: first, to solubilise and enrich the hydrophobic reactant in a mesophase for rate acceleration; second, to stabilize and maintain the formed organosilica particles at small colloidal sizes (∼100 nm). The catalytic role of fluoride was established by showing apparent first-order dependence on sodium fluoride for the rates of both phases. Moreover, the observation that fluoride catalysis is the fastest with a cationic surfactant, followed by non-ionic and anionic surfactants, is consistent with the anionic nature of fluoride. To sum up, we confirm that sodium fluoride is an efficient catalyst for synthesizing hydrophobic organosilica nanoparticles in simple aqueous solutions modified with various types of surfactants or amphiphiles. We also demonstrate that ATR-FTIR could be a viable tool for revealing the kinetic behaviour of a reaction system involving hydrophobic–hydrophilic interactions.Conflicts of interest
There are no conflicts to declare.Acknowledgements
The study was supported by research grants from Ministry of Science and Technology, Taiwan (MOST 105-2320-B-010-037-MY3, MOST 106-2320-B-010-027, MOST 107-2320-B-010-002).Notes and references
- D. M. Vriezema, M. Comellas Aragonès, J. A. Elemans, J. J. Cornelissen, A. E. Rowan and R. J. Nolte, Chem. Rev., 2005, 105, 1445–1490 CrossRef CAS.
- B. H. Lipshutz, S. Ghorai and M. Cortes-Clerget, Chem.–Eur. J., 2018, 24, 6672–6695 CrossRef CAS.
- M. Schmidt, J. Deckwerth, R. Schomäcker and M. Schwarze, J. Org. Chem., 2018, 83, 7398–7406 CrossRef CAS.
- B. Samiey, C.-H. Cheng and J. Wu, J. Chem., 2014, 2014, 908476 Search PubMed.
- P. Walde, H. Umakoshi, P. Stano and F. Mavelli, Chem. Commun., 2014, 50, 10177–10197 RSC.
- D. Kumar, K. Seth, D. N. Kommi, S. Bhagat and A. K. Chakraborti, RSC Adv., 2013, 3, 15157–15168 RSC.
- T. Dwars, E. Paetzold and G. Oehme, Angew. Chem., Int. Ed. Engl., 2005, 44, 7174–7199 CrossRef CAS.
- D. K. Romney, F. H. Arnold, B. H. Lipshutz and C.-J. Li, J. Org. Chem., 2018, 83, 7319–7322 CrossRef CAS.
- G. La Sorella, G. Strukul and A. Scarso, Green Chem., 2015, 17, 644–683 RSC.
- K. Piradashvili, E. M. Alexandrino, F. R. Wurm and K. Landfester, Chem. Rev., 2015, 116, 2141–2169 CrossRef.
- R. Dong, W. Liu and J. Hao, Acc. Chem. Res., 2012, 45, 504–513 CrossRef CAS.
- E. D. Hyde, A. Seyfaee, F. Neville and R. Moreno-Atanasio, Ind. Eng. Chem. Res., 2016, 55, 8891–8913 CrossRef CAS.
- J. G. Croissant, Y. Fatieiev, A. Almalik and N. M. Khashab, Adv. Healthcare Mater., 2018, 7, 1700831 CrossRef.
- K. Bredereck, F. Effenberger and M. Tretter, J. Colloid Interface Sci., 2011, 360, 408–414 CrossRef CAS.
- W. Han, S. R. MacEwan, A. Chilkoti and G. P. Lopez, Nanoscale, 2015, 7, 12038–12044 RSC.
- K. Lutz, C. Groger, M. Sumper and E. Brunner, Phys. Chem. Chem. Phys., 2005, 7, 2812–2815 RSC.
- S. V. Patwardhan, Chem. Commun., 2011, 47, 7567–7582 RSC.
- D. J. Belton, S. V. Patwardhan, V. V. Annenkov, E. N. Danilovtseva and C. C. Perry, Proc. Natl. Acad. Sci. U. S. A., 2008, 105, 5963–5968 CrossRef CAS.
- M. Sumper and E. Brunner, Adv. Funct. Mater., 2006, 16, 17–26 CrossRef CAS.
- M. Sumper, S. Lorenz and E. Brunner, Angew. Chem., Int. Ed. Engl., 2003, 42, 5192–5195 CrossRef CAS.
- N. Kroger, S. Lorenz, E. Brunner and M. Sumper, Science, 2002, 298, 584–586 CrossRef.
- N. Kroger, R. Deutzmann, C. Bergsdorf and M. Sumper, Proc. Natl. Acad. Sci. U. S. A., 2000, 97, 14133–14138 CrossRef CAS.
- S. Wang, J. Xue, Y. Zhao, M. Du, L. Deng, H. Xu and J. R. Lu, Soft Matter, 2014, 10, 7623–7629 RSC.
- M. R. Knecht, S. L. Sewell and D. W. Wright, Langmuir, 2005, 21, 2058–2061 CrossRef CAS.
- Y.-L. Su, C.-Y. Lin, S.-J. Chiu and T.-M. Hu, J. Microencapsulation, 2018, 35, 381–391 CrossRef CAS.
- S. J. Chiu, C. Y. Lin, H. C. Chou and T. M. Hu, Langmuir, 2016, 32, 211–220 CrossRef CAS.
- S.-J. Chiu, S.-Y. Wang, H.-C. Chou, Y.-L. Liu and T.-M. Hu, Langmuir, 2014, 30, 7676–7686 CrossRef CAS.
- Y.-G. Lee, J.-H. Park, C. Oh, S.-G. Oh and Y. C. Kim, Langmuir, 2007, 23, 10875–10878 CrossRef CAS.
- M. Nakamura and K. Ishimura, J. Phys. Chem. C, 2007, 111, 18892–18898 CrossRef CAS.
- M. Nakamura and K. Ishimura, Langmuir, 2008, 24, 5099–5108 CrossRef CAS.
- G. S. Irmukhametova, G. A. Mun and V. V. Khutoryanskiy, Langmuir, 2011, 27, 9551–9556 CrossRef CAS.
- C.-H. Lo and T.-M. Hu, Soft Matter, 2017, 13, 5950–5960 RSC.
- C. R. Miller, R. Vogel, P. P. Surawski, K. S. Jack, S. R. Corrie and M. Trau, Langmuir, 2005, 21, 9733–9740 CrossRef CAS.
- Y. G. Lee, J. H. Park, C. Oh, S. G. Oh and Y. C. Kim, Langmuir, 2007, 23, 10875–10878 CrossRef CAS.
- T. S. Deng, Q. F. Zhang, J. Y. Zhang, X. Shen, K. T. Zhu and J. L. Wu, J. Colloid Interface Sci., 2009, 329, 292–299 CrossRef CAS.
- Z. Meng, C. Xue, Q. Zhang, X. Yu, K. Xi and X. Jia, Langmuir, 2009, 25, 7879–7883 CrossRef CAS.
- T. Doura, F. Tamanoi and M. Nakamura, J. Colloid Interface Sci., 2018, 526, 51–62 CrossRef CAS.
- T.-M. Hu, H.-C. Chou and C.-Y. Lin, J. Colloid Interface Sci., 2019, 539, 634–645 CrossRef CAS.
- E. Reale, A. Leyva, A. Corma, C. Martínez, H. García and F. Rey, J. Mater. Chem., 2005, 15, 1742–1754 RSC.
- U. Díaz, T. García, A. Velty and A. Corma, J. Mater. Chem., 2009, 19, 5970–5979 RSC.
- T. Bernards, M. Van Bommel and J. Jansen, J. Sol-Gel Sci. Technol., 1998, 13, 749–752 CrossRef CAS.
- A. M. Almanza-Workman, S. Raghavan, P. Deymier, D. J. Monk and R. Roop, Colloids Surf., A, 2004, 232, 67–75 CrossRef CAS.
- K. S. Finnie, J. R. Bartlett, C. J. Barbe and L. Kong, Langmuir, 2007, 23, 3017–3024 CrossRef CAS.
- J. Wu, L. Ling, J. Xie, G. Ma and B. Wang, Chem. Phys. Lett., 2014, 591, 227–232 CrossRef CAS.
- L. Yang, J. Feng, W. Zhang and J.-e. Qu, Appl. Surf. Sci., 2010, 257, 990–996 CrossRef CAS.
- C. Nam, T. J. Zimudzi, G. M. Geise and M. A. Hickner, ACS Appl. Mater. Interfaces, 2016, 8, 14263–14270 CrossRef CAS.
- J. Max and C. Chapados, J. Chem. Phys., 2009, 131, 184505 CrossRef.
- M.-A. Chen, X.-B. Lu, Z.-H. Guo and R. Huang, Corros. Sci., 2011, 53, 2793–2802 CrossRef CAS.
- S. G. Kazarian and K. A. Chan, Analyst, 2013, 138, 1940–1951 RSC.
Footnote |
| † Electronic supplementary information (ESI) available: Video S1 and Fig. S1–S8. See DOI: 10.1039/c9ra05509f |
| This journal is © The Royal Society of Chemistry 2019 |

