 Open Access Article
Tunable pseudocapacitive contribution by dimension control in nanocrystalline-constructed (Mg0.2Co0.2Ni0.2Cu0.2Zn0.2)O solid solutions to achieve superior lithium-storage properties†
Hong Chen ,
Nan Qiu
 *,
Baozhen Wu,
Zhaoming Yang,
Sen Sun and
Yuan Wang*
Key Laboratory of Radiation Physics and Technology, Ministry of Education, Institute of Nuclear Science and Technology, Sichuan University, Chengdu 610064, People's Republic of China. E-mail: qiun@scu.edu.cn; wyuan@scu.edu.cn
First published on 13th September 2019
Abstract
Ultrafine crystalline materials have been extensively investigated as high-rate lithium-storage materials due to their shortened charge-transport length and high surface area. The pseudocapacitive effect plays a considerable role in electrochemical lithium storage when the electrochemically active materials approach nanoscale dimensions, but this has received limited attention. Herein, a series of (Mg0.2Co0.2Ni0.2Cu0.2Zn0.2)O electrodes with different particle sizes were prepared and tested. The ultrafine (Mg0.2Co0.2Ni0.2Cu0.2Zn0.2)O nanofilm (3–5 nm) anodes show a remarkable rate capability, delivering high specific charge and discharge capacities of 829, 698, 602, 498 and 408 mA h g−1 at 100, 200, 500, 1000 and 2000 mA g−1, respectively, and a dominant pseudocapacitive contribution as high as 90.2% toward lithium storage was revealed by electrochemical analysis at a high scanning rate of 1.0 mV s−1. This work offers an approach to tune the lithium-storage properties of (Mg0.2Co0.2Ni0.2Cu0.2Zn0.2)O by size control and gives insights into the enhancement of pseudocapacitance-assisted lithium-storage capacity.
1 Introduction
Li ion batteries (LIBs) with long cycling life and high reversible capacity are considered as clean, versatile, and promising power sources to meet the rapid development of electric vehicles and portable electronic devices.1–5 With the aim to further upgrade the energy density of current LIBs, new types of anode materials with high capacity and desired stability are essential to substitute the current graphite anode, with a theoretical capacity of 372 mA h g−1.6–11 Transition metal oxides (TMOs) with a conversion reaction mechanism are promising anode materials to fulfill the requirements of next-generation LIBs by virtue of their high reversible capacity and low cost.12,13The high entropy oxides (HEOs) are considered as a new class of single-phase solid solution TMOs materials with promising and still partially unexplored functional properties.14–16 Very recently, Breitung et al.17–20 and our research group21 demonstrated that the high entropy oxide (HEO), (Mg0.2Co0.2Ni0.2Cu0.2Zn0.2)O, has possible applications in the field of energy storage with high reversible capacity, long-term cycling stability, and excellent rate performance. However, its mechanism of de-/lithiation behavior is unclear. Therefore, further investigations toward (Mg0.2Co0.2Ni0.2Cu0.2Zn0.2)O should be pursued to explore its full potential for energy storage applications.
Besides the sluggish diffusion effect of HEO to improve cycling performance, the use of ultrafine nanostructured electrodes can diminish mechanical disintegration and improve stability. Furthermore, ultrafine nanosized materials present additional advantages, such as faster rate capabilities because of the shorter Li-ion diffusion paths and a potentially huge pseudocapacitive contribution associated with their very high surface to volume ratio.22–24 This pseudocapacitive contribution significantly improves both the rate performance and cycling stability of the electrodes. Nano-engineering can further help to improve the pseudocapacitive effect, also termed interfacial energy storage, which is charge (such as Li+ ion) uptake occurring at or near the surface of electrochemically active materials based on faradaic reactions.25,26 This charge-storage mechanism has become one of the most popular directions for electrochemical energy storage in LIBs in recent years because the near surface-confined faradaic reactions proceed remarkably faster than traditional lithium-ion insertion reactions, thus improving the power capability without sacrificing the energy density of the electrochemically active materials.27–30
In the present work, a series of HEO electrodes with different particle size were prepared and tested. The relationship of the electrochemical lithium-storage performance, particle size and surface area was investigated comprehensively. When serving as the anode material for LIBs, all the HEO electrodes delivered high reversible capacity and robust cycling life. As for the ultrafine HEO nanofilm electrode, a dominant pseudocapacitive contribution as high as 90.2% toward lithium storage was revealed by electrochemical analysis at a high scanning rate of 1.0 mV s−1. It delivered high specific charge and discharge capacities of 829, 698, 602, 498 and 408 mA h g−1 at current density of 100, 200, 500, 1000 and 2000 mA g−1, respectively. The outstanding electrochemical performance is attributed to the ultrafine HEO nanoparticles, which are beneficial for the easy connect of Li+-carrying electrolyte into the grain boundaries, thus improving the electrolyte/electrode contacting area for the fast Li+ flux and shorting the diffusion length. Our work highlights that the rational size control of HEO material can effectively improve the pseudocapacitive effect, thus benefiting the energy and power density of HEO electrode materials.
2 Results and discussion
2.1 Structure characterization of HEO nanoparticles
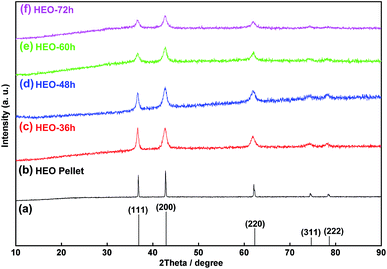
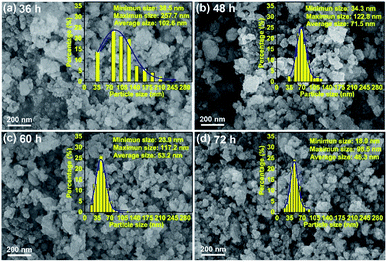
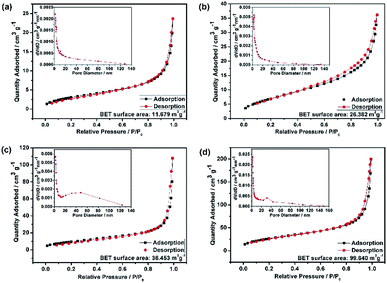
The HEO pellets were prepared by solid-state synthesis method, and the HEO nanoparticles were obtained by using a ball-milling method (see details in the Experimental section). All HEO samples show a typical face-centered-cubic (FCC) structure irrespective of their processing method and ball-milled hours (Fig. 1). The intensity and full width at half maximum of the diffraction peaks from the HEO pellet and nanoparticles are different although the position of their diffraction peaks is almost identical. The relatively broaden peaks of the HEO nanoparticles indicate that the crystallinity was dramatically decreased when the HEO pellet was milled into nanoparticles. The grain sizes of the HEO nanoparticles were calculated by using the Debye–Scherrer equation to be about 20.9, 17.7, 15.5, and 15.2 nm for the HEO-36 h, HEO-48 h, HEO-60 h, and HEO-72 h, respectively.Fig. 2 shows representative FESEM micrographs and size distribution histograms of the HEO nanoparticles. Dense and spherical particles with diameters in the range of 200–300 nm can be seen in Fig. 2a and b. However, the average nanoparticle size was dramatically decreased from 102.6 nm to 46.3 nm as the time used for ball-milling HEOs extended from 36 hours to 72 hours. Generally, the specific surface area, pore diameter, and pore volume all influence the electrochemical performance of the active materials. The specific surface area and pore size distribution of the four samples were measured via nitrogen adsorption–desorption isotherm analysis (Fig. 3). All the nitrogen adsorption–desorption isotherms of the four samples exhibits typical type-IV characteristics with a type-H1 hysteresis loop at high pressures, indicating the existence of open mesoporous characteristics.31 According to the Brunauer–Emmett–Teller model, the HEO-72 h presents the largest BET specific surface area of 99.64 m2 g−1 and a total pore volume of 0.240 cm3 g−1. In contrast, the BET specific surface area of the three samples (11.68 m2 g−1, 26.38 m2 g−1 and 36.45 m2 g−1) are much smaller. Based on Barrett–Joyner–Halenda plots, the pore size of the four samples is similar and mainly in the range of 2–20 nm (Fig. 3), which is strong evidence that the samples contain a large number of mesoporous structures. It is well-known that the rich mesoporous configuration would benefit for the long cycle lives and better rate capabilities of LIBs,32 because such mesoporous structure possesses high specific surface area, which would facilitate charge transfer and reduce ion diffusion path lengths, and provide enough room for accommodating volume changes during cycling.
2.2 Structure characterization of HEO thin film
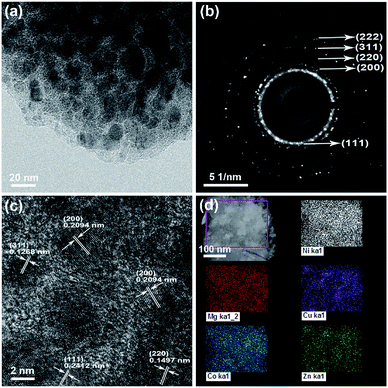
The transmission electron microscopy (TEM) image, selected area electrical diffraction (SAED) pattern, and high-resolution transmission electron microscopy (HRTEM) image of the HEO thin film are shown in Fig. 4. The polycrystalline diffraction rings of SAED pattern (as shown in Fig. 4b) present the microstructural characteristics of a typical FCC structure. The interplanar spacings (ring 1: d111 = 0.2412 nm, ring 2: d200 = 0.2089 nm, ring 3: d220 = 0.1477 nm, ring 4: d311 = 0.1259 nm, and ring 5: d222 = 0.1206 nm) are all assignable to the FCC structure. Fig. 4c shows the HRTEM image of the HEO thin film, which is very obviously that the grain size is very homogeneous with a diameter of 3–5 nm. From the HRTEM analysis results, it is clear that the corresponding interplanar spacing values agreed well with the SAED data. The XPS spectrum and STEM-EDS analysis was shown in Fig. S1 and S2.† The XPS measurements indicate that all cations in the HEO film are at the valence of +2 state, which is in good agreement with the value in the previous literature.21,42 Fig. S3† shows the surface and cross-section SEM images of the as-deposited HEO thin film. It is observed that the thickness of HEO thin film is about 220 nm.2.3 Electrochemical performance of HEO anodes
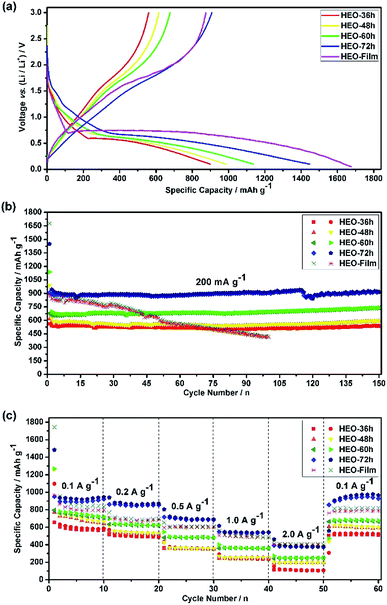
In general, the irreversible capacity loss during the first cycle for the TMO-based anode is known to result from solid electrolyte interface (SEI) film formation and incomplete Li+ extraction from Li2O during the charge process.12,13,33 The electrochemical lithium-storage behaviors of the five HEO electrodes were first evaluated by CV measurements in a potential window ranging from 0.01 V to 3.0 V at a scan rate of 0.2 mV s−1 [see Fig. S5 in ESI†]. The shapes of these CV curves are different from each other, indicating that the different electrochemical behaviors arise from the five different HEO electrodes.Fig. 5a shows the discharge–charge voltage profiles of the five HEO electrodes at a current rate of 200 mA g−1 for the first cycle in the voltage range of 0.01–3.00 V. For all of the HEO electrodes, small discharging plateaus were observed at around 1.5 V and 0.6 V, respectively. The charge voltage at about 1.7 V was in good agreement with CV results [see Fig. S5 in ESI†]. When the electrodes were scanned cathodically from 3.0 to 0.01 V in the first cycle at a scan rate of 0.2 mV s−1, an intense and broad peak with the characteristics of the reduction potential is located at 0.45–0.50 V, which can be assigned to Co2+/Co0, Ni2+/Ni0, Cu2+/Cu0, Zn2+/Zn0 and the formation of theSEI layer.33 In the following anodic polarization process, one peak centered at 1.75 V could be ascribed to the oxidation of metallic Co, Ni, Cu and Zn to the corresponding metal oxides.33 The main reduction peak shifts to a higher potential at 0.79 V and the oxidation peak shifts to 1.75 V in the subsequent cycles, which might originate from the pulverization of the HEO nanoparticles. From the second cycle onward, both the reduction and the oxidation peaks overlap very well, which indicates that the HEO electrode exhibits good stability and cyclability for the insertion and extraction of lithium ions.
Fig. 5b shows the discharge–charge capacity over 150 cycles at a current density of 200 mA g−1. The low initial coulombic efficiency measured for all the electrodes, ca. 60%, was associated with the SEI formation.34,35 However, during the first few cycles, the coulombic efficiency increased to ca. 98% and it was stabilized at this value for 150 cycles. All of the four HEO electrodes showed a similar trend, with an initial very fast decrease of the capacity which attributed to the SEI formation, a following slower loss of capacity, a capacity recover after a certain number of cycles and a moderate and sustained increase of capacity at much larger cycle numbers. To evaluate the rate capability of the HEO electrodes, galvanostatic cycling was performed at current rates between 100 to 2000 mA g−1 (Fig. 5c). The HEO-72 h anodes show a remarkable rate capability, delivering high specific charge and discharge capacities of 932, 853, 693, 539 and 358 mA h g−1 at 100, 200, 500, 1000 and 2000 mA g−1, respectively.
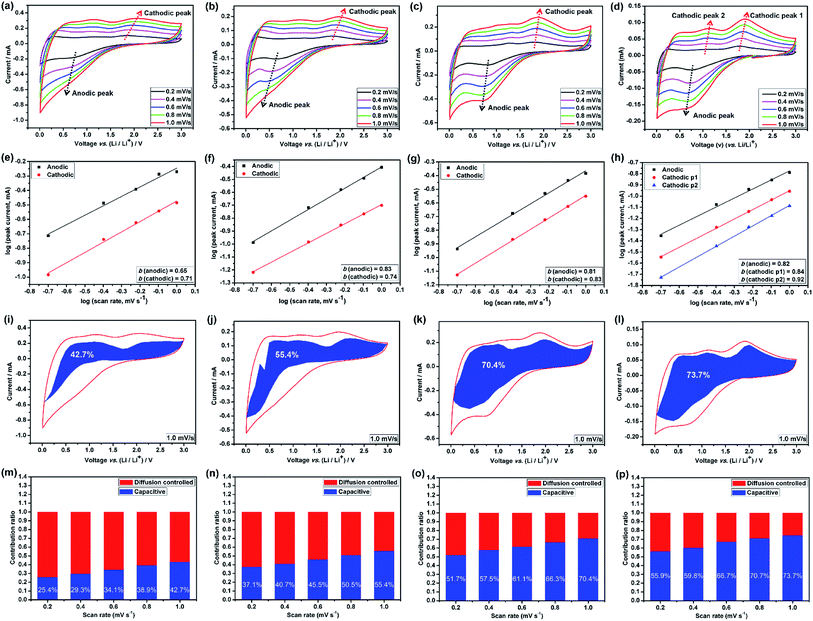
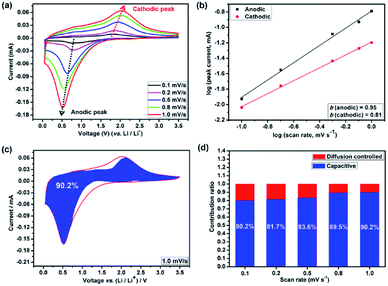
The broad redox peaks observed and the quasilinear charge curves from the CV and charge/discharge profiles (Fig. S5–S7†), respectively, suggest the pseudocapacitive properties of the HEO electrodes. It is well-known that the peak current values in CV curves for the cathodic and anodic reactions would vary with scan rate, which could imply the kinetics of the lithium insertion/extraction at the material/electrolyte interface.22,25 Hence, in order to better understanding the kinetics mechanism, CV measurements were conducted at various scan rates from 0.2 to 1.0 mV s−1 (Fig. 6a–d and 7a) to understand the kinetics of lithium uptake within the (Mg0.2Co0.2Ni0.2Cu0.2Zn0.2)O electrodes. For all of the (Mg0.2Co0.2Ni0.2Cu0.2Zn0.2)O electrodes, only one cathodic and one anodic peak can be observed at various scan rates. The logarithm of the peak current (ip) is plotted versus the logarithm of the scan rate (v) (Fig. 6a–d and 7a), assuming that ip and v obey the power-law relationship as the following two equations:22,25
| ip = avb |
log(ip) = b![[thin space (1/6-em)]](https://www.rsc.org/images/entities/char_2009.gif) log(v) + log log(v) + log![[thin space (1/6-em)]](https://www.rsc.org/images/entities/char_2009.gif) a a |
The accurate capacity contributions from the capacitive-controlled reaction and for the five electrodes were further calculated according to the following equation:
| i(V) = k1v + k2v1/2 |
For analytical purposes, we rearrange this equation slightly to:
| i(V)/v1/2 = k1v1/2 + k2 |
Many recent studies have suggested that lithium can be stored at the phase interface between Li+-accepting and electron-accepting phase during the charge process,26,38–40 thus providing additional interfacial capacity for the whole electrode by means of charge separation.41 Among the four HEO electrodes, the HEO-36 h exhibits the lowest capacitive-controlled capacity contribution at low scanning rates, arising from the largest particle size of HEO in the electrode that provide large diffusion-controlled lithium-storage capacity. In comparison, the HEO-72 h electrode shows a relatively higher capacitive-controlled capacity contribution, which is attributed to the largest BET surface area (99.64 m2 g−1) and the smallest particle size (46.3 nm) of HEO nanoparticles in the electrode.
Lastly, we have determined the lithium-ion diffusion coefficients (D) by electrochemical impedance spectroscopy (EIS) measurements (Fig. S14, S15 and Table S1†). The calculated diffusion coefficient values of HEO-72 h electrode are 1–2 orders of magnitude higher than that of the other counterparts, implying the much higher diffusion rate, thus contributing to the most enhanced rate capability and cycling stability.
On the basis of the above discussion, the charge storage in the HEO electrode is dominated by the pronounced pseudocapacitive behavior, allowing ultrafast uptake and release of lithium ions with little degradation of the active material. Such excellent lithium storage capability is mainly related to the following features of the HEO electrode. First of all, the mesoporous structure strongly coupled with the conducting carbon provides both high electronic and ionic transport. Second, due to the sluggish diffusion effect of the HEO material, nanoscale HEO electrode is able to maximize the surface/near-surface charge storage and minimize the lithium ion diffusion distance in the solid state, while maintaining a high structural robustness. Third, the ultrasmall size of the HEO electrode induces pseudocapacitive lithium insertion/deinsertion without degrading the active material upon prolonged cycling. Overall, these merits provide the ultrafine HEO nanofilm electrode with the capability to uptake and release a substantial amount of lithium ions in a fast and high reversible manner, which is not expected in conventional transition metal oxides (TMOs).
3 Experimental
3.1 Solid-state synthesis of HEO nano materials
All chemical reagents (purchased from Alfa Aesar Chemical Reagent Co., Ltd) were of analytical purity and used without any further purification. Equimolar amounts of the oxides, MgO (Alfa Aesar, 99.99%), CoO (Alfa Aesar, 99%), NiO (Alfa Aesar, 99%), CuO (Alfa Aesar, 99.9%) and ZnO (Alfa Aesar 99.9%), were mixed as HEO pre-alloyed powder by a planetary ball mill. To ensure adequate mixing, all HEO pre-alloyed powder was milled for at least 2 h. Mixed powder was then separated into several samples with 0.500 g per sample, and then pressed into pellets with diameter of 1.50 cm using a uniaxial hydraulic press at 31![[thin space (1/6-em)]](https://www.rsc.org/images/entities/char_2009.gif) 000 N. The HEO pre-alloyed pellets were sintered at 1000 °C for 24 h by using a Protherm PC442 tube furnace before air quenching. These samples were then checked via X-ray diffraction to ensure phase purity and that peaks remain narrow and intense. The geometrical density of the HEO pellets was in the 75–80% range. These HEO pellets were then mixed with isopropyl alcohol and milled again into nanoparticles with yttrium-stabilized balls for 36, 48, 60 and 72 h. Afterwards, all samples were dried in a fume hood at room temperature.
000 N. The HEO pre-alloyed pellets were sintered at 1000 °C for 24 h by using a Protherm PC442 tube furnace before air quenching. These samples were then checked via X-ray diffraction to ensure phase purity and that peaks remain narrow and intense. The geometrical density of the HEO pellets was in the 75–80% range. These HEO pellets were then mixed with isopropyl alcohol and milled again into nanoparticles with yttrium-stabilized balls for 36, 48, 60 and 72 h. Afterwards, all samples were dried in a fume hood at room temperature.
3.2 Deposition of HEO films
HEO films were grown on stainless steel (SS) substrates (10 mm × 10 mm) using a KrF excimer laser with a wavelength of 248 nm and a laser molecular beam epitaxy apparatus (LMBE-450, SKY). The synthesized HEO pellet was used as target. The energy density of laser was 3.0 J cm−2. The incident angle between the laser beam and the target surface normal was set as 45°. The distance between the target and substrate was set as 50 mm. The vacuum was kept at a pressure of 10−5 Pa and the substrate temperature was kept at 600 °C during deposition. Deposition for one hour at a rate of 5 Hz resulted in a 200 nm-thick HEO film.3.3 Sample characterization
The XRD patterns of the products were determined by a Bruker D8 Advance X-ray diffractometer equipped with a Cu Kα radiation (λ = 1.54178 Å) source operated at 40 kV and 50 mA. Transmission electron microscopy (TEM) and scanning electron microscopy (SEM) images were acquired on JEM-1011 with the accelerating voltage of 200 kV and JEOL JSM-6700 M with the accelerating voltage of 10 kV, respectively. The samples for SEM characterization were sputtered a thin layer of gold prior to the measurements. The samples for TEM measurements were prepared by dispersing the HEO nanoparticles into petroleum ether followed by dropping onto a gold grid. X-ray photoemission spectroscopy (XPS) was carried out using a Thermo Fisher X-ray photoelectron spectrometer ESCALAB 250Xi (non-monochromated Mg Kα X-ray radiation as the excitation source). The high-resolution transmission electron microscopy (HRTEM) images, selected area electron diffraction (SAED) patterns, and EDS elemental mapping images were obtained by using a JEM-ARM200F (Schottky FEG Cs corrected TEM). EDX analysis was carried out in the STEM mode using a Tecnai G2 F20 transmission electron microscope. A Tristar II 3020 physisorption system (Micromeritics Instrument Corporation, USA) was used to measure nitrogen adsorption–desorption isotherms at the liquid nitrogen temperature (77 K). The Brunauer–Emmett–Teller (BET) method was used to calculate the specific surface areas of the samples from the adsorption branches. The Barrett–Joyner–Halenda (BJH) model was employed to compute pore size distribution curves from the desorption branches.3.4 Electrochemical measurements
The performance of HEO nanoparticles and HEO nanofilms as anode materials for LIBs was measured using CR2025 coin cells. The active material (70 wt%), Super P acetylene black (20 wt%) and poly(vinylidene fluoride) (Mw: 534![[thin space (1/6-em)]](https://www.rsc.org/images/entities/char_2009.gif) 000 g mol−1, Sigma-Aldrich) (10 wt%) mixed in N-methyl pyrrolidone (NMP) and ball milled for 6 h at speed of 400 rpm to prepare the uniform slurry. The slurry was then coated on a copper current collector, dried at 80 °C under vacuum for 24 h, and then roll-pressed at 10 MPa for 2 minutes. The half-coin cells were assembled in an Ar-filled glove box by using lithium foil (0.2 mm thickness, 15.8 mm diameter) as counter and reference electrode, 1.0 M LiPF6 in the mixture of ethylene carbonate/diethyl carbonate (EC/DEC) with 1
000 g mol−1, Sigma-Aldrich) (10 wt%) mixed in N-methyl pyrrolidone (NMP) and ball milled for 6 h at speed of 400 rpm to prepare the uniform slurry. The slurry was then coated on a copper current collector, dried at 80 °C under vacuum for 24 h, and then roll-pressed at 10 MPa for 2 minutes. The half-coin cells were assembled in an Ar-filled glove box by using lithium foil (0.2 mm thickness, 15.8 mm diameter) as counter and reference electrode, 1.0 M LiPF6 in the mixture of ethylene carbonate/diethyl carbonate (EC/DEC) with 1![[thin space (1/6-em)]](https://www.rsc.org/images/entities/char_2009.gif) :
:![[thin space (1/6-em)]](https://www.rsc.org/images/entities/char_2009.gif) 1 volume ratio as electrolyte, and a microporous polyethylene Celgard 2400 film as separator. Discharge/charge tests were performed galvanostatically between the potential range of 0.01–3.00 V (vs. Li+/Li) on a LAND CT2001A multichannel battery tester at room temperature. The mass of anode was measured by an electronic balance (Mettler Toledo XPE analytical balance, 0.01 mg resolution). The mass loading of (Mg0.2Co0.2Ni0.2Cu0.2Zn0.2)O for each electrode (HEO-36 h, HEO-48 h, HEO-60 h and HEO-72 h) was determined to be 1.0–1.2 mg. The weight of thin film was obtained based on the weight difference of sample before and after deposition by LMBE. Twenty thin film electrodes were weighed together and the average mass loading of each film electrode was determined to be 5.0 μg. All of the specific capacities were calculated based on the total mass of active material. The cyclic voltammetry (CV) tests were carried out in the potential window of 0.01–3.00 V (vs. Li+/Li) at various scan rates from 0.1 to 1.0 mV s−1 on an electrochemical workstation (AutoLab PGSTAT302N). Electrochemical impedance spectroscopy (EIS) measurements were performed in the frequency range from 106 Hz to 0.1 Hz on the AutoLab PGSTAT302N station.
1 volume ratio as electrolyte, and a microporous polyethylene Celgard 2400 film as separator. Discharge/charge tests were performed galvanostatically between the potential range of 0.01–3.00 V (vs. Li+/Li) on a LAND CT2001A multichannel battery tester at room temperature. The mass of anode was measured by an electronic balance (Mettler Toledo XPE analytical balance, 0.01 mg resolution). The mass loading of (Mg0.2Co0.2Ni0.2Cu0.2Zn0.2)O for each electrode (HEO-36 h, HEO-48 h, HEO-60 h and HEO-72 h) was determined to be 1.0–1.2 mg. The weight of thin film was obtained based on the weight difference of sample before and after deposition by LMBE. Twenty thin film electrodes were weighed together and the average mass loading of each film electrode was determined to be 5.0 μg. All of the specific capacities were calculated based on the total mass of active material. The cyclic voltammetry (CV) tests were carried out in the potential window of 0.01–3.00 V (vs. Li+/Li) at various scan rates from 0.1 to 1.0 mV s−1 on an electrochemical workstation (AutoLab PGSTAT302N). Electrochemical impedance spectroscopy (EIS) measurements were performed in the frequency range from 106 Hz to 0.1 Hz on the AutoLab PGSTAT302N station.
4 Conclusions
In this work, we have investigated the lithium storage behavior of five different kind of HEO electrodes based on dimension control. The pseudocapacitive effect (90.2% at 1.0 mV s−1 of the as-prepared HEO nanofilm electrode) has been remarkably enhanced by the rational control of the grain size and surface area which increases the interfacial lithium-storage capacity. Through in-depth analysis of the lithium storage behavior, the robust architecture of the HEO electrode and the dominating pseudocapacitive charge storage are thought to be the major factors contributing to the remarkable electrochemical performance. The present study could lead to a promising anode material with high reversible capacity, long-term cycling stability, and excellent rate performance for LIBs application in the next generation. In addition, our work highlights that the rational size control of HEO material can effectively improve the pseudocapacitive effect, thus benefiting the energy and powder density of HEO electrode materials.Conflicts of interest
There are no conflicts to declare.Acknowledgements
This work was financially supported by the Fundamental Research Funds for the Central Universities (2017SCU11066). This research was also partially supported by National Natural Science Foundation of China (Grant No. 11775150).Notes and references
- A. Noori, M. F. El-Kady, M. S. Rahmanifar, R. B. Kaner and M. F. Mousavi, Chem. Soc. Rev., 2019, 48, 1272–1341 RSC.
- M. Winter, B. Barnett and K. Xu, Chem. Rev., 2018, 118, 11433–11456 CrossRef CAS.
- H. Sun, L. Mei, J. Liang, Z. Zhao, C. Lee, H. Fei, M. Ding, J. Lau, M. Li, C. Wang, X. Xu, G. Hao, B. Papandrea, I. Shakir, B. Dunn, Y. Huang and X. Duan, Science, 2017, 356, 599 CrossRef CAS.
- M. N. Obrovac and V. L. Chevrier, Chem. Rev., 2014, 114, 11444–11502 CrossRef CAS.
- N. Nitta, F. Wu, J. T. Lee and G. Yushin, Mater. Today, 2015, 18, 252–264 CrossRef CAS.
- S. Goriparti, E. Miele, F. De Angelis, E. Di Fabrizio, R. Proietti Zaccaria and C. Capiglia, J. Power Sources, 2014, 257, 421–443 CrossRef CAS.
- J.-Y. Li, Q. Xu, G. Li, Y.-X. Yin, L.-J. Wan and Y.-G. Guo, Mater. Chem. Front., 2017, 1, 1691–1708 RSC.
- Y. Liang, H. Tian, J. Repac, S.-C. Liou, J. Chen, W. Han, C. Wang and S. Ehrman, Energy Storage Mater., 2018, 13, 8–18 CrossRef.
- A. Mishra, A. Mehta, S. Basu, S. J. Malode, N. P. Shetti, S. S. Shukla, M. N. Nadagouda and T. M. Aminabhavi, Materials Science for Energy Technologies, 2018, 1, 182–187 CrossRef.
- J. Pang, R. G. Mendes, A. Bachmatiuk, L. Zhao, H. Q. Ta, T. Gemming, H. Liu, Z. Liu and M. H. Rummeli, Chem. Soc. Rev., 2019, 48, 72–133 RSC.
- D. Zhou, X. Li, L.-Z. Fan and Y. Deng, Electrochim. Acta, 2017, 230, 212–221 CrossRef CAS.
- M. V. Reddy, G. V. Subba Rao and B. V. Chowdari, Chem. Rev., 2013, 113, 5364–5457 CrossRef CAS.
- C. Yuan, H. B. Wu, Y. Xie and X. W. Lou, Angew. Chem., Int. Ed., 2014, 53, 1488–1504 CrossRef CAS.
- C. M. Rost, E. Sachet, T. Borman, A. Moballegh, E. C. Dickey, D. Hou, J. L. Jones, S. Curtarolo and J.-P. Maria, Nat. Commun., 2015, 6, 8485 CrossRef CAS.
- J.-W. Yeh and S.-J. Lin, J. Mater. Res., 2018, 33, 3129–3137 CrossRef CAS.
- H. Chen, J. Fu, P. Zhang, H. Peng, C. W. Abney, K. Jie, X. Liu, M. Chi and S. Dai, J. Mater. Chem. A, 2018, 6, 11129–11133 RSC.
- A. Sarkar, L. Velasco, D. Wang, Q. Wang, G. Talasila, L. de Biasi, C. Kübel, T. Brezesinski, S. S. Bhattacharya, H. Hahn and B. Breitung, Nat. Commun., 2018, 9, 3400 CrossRef.
- A. Sarkar, Q. Wang, A. Schiele, M. R. Chellali, S. S. Bhattacharya, D. Wang, T. Brezesinski, H. Hahn, L. Velasco and B. Breitung, Adv. Mater., 2019, 1806236 CrossRef.
- Q. Wang, A. Sarkar, Z. Li, Y. Lu, L. Velasco, S. S. Bhattacharya, T. Brezesinski, H. Hahn and B. Breitung, Electrochem. Commun., 2019, 100, 121–125 CrossRef CAS.
- Q. Wang, A. Sarkar, D. Wang, L. Velasco, R. Azmi, S. S. Bhattacharya, T. Bergfeldt, A. Düvel, P. Heitjans, T. Brezesinski, H. Hahn and B. Breitung, Energy Environ. Sci., 2019, 12, 2433–2442 RSC.
- N. Qiu, H. Chen, Z. Yang, S. Sun, Y. Wang and Y. Cui, J. Alloys Compd., 2019, 777, 767–774 CrossRef CAS.
- V. Augustyn, P. Simon and B. Dunn, Energy Environ. Sci., 2014, 7, 1597–1614 RSC.
- T. Brousse, D. Bélanger and J. W. Long, J. Electrochem. Soc., 2015, 162, A5185–A5189 CrossRef CAS.
- J. B. Cook, H.-S. Kim, T. C. Lin, C.-H. Lai, B. Dunn and S. H. Tolbert, Adv. Energy Mater., 2017, 7, 1601283 CrossRef.
- J. Wang, J. Polleux, J. Lim and B. Dunn, J. Phys. Chem. C, 2007, 111, 14925–14931 CrossRef CAS.
- G. Fang, Z. Wu, J. Zhou, C. Zhu, X. Cao, T. Lin, Y. Chen, C. Wang, A. Pan and S. Liang, Adv. Energy Mater., 2018, 8, 1703155 CrossRef.
- D. Wang, W. Zhou, R. Zhang, X. Huang, J. Zeng, Y. Mao, C. Ding, J. Zhang, J. Liu and G. Wen, J. Mater. Chem. A, 2018, 6, 2974–2983 RSC.
- W. Zhang, H. Li, C. J. Firby, M. Al-Hussein and A. Y. Elezzabi, ACS Appl. Mater. Interfaces, 2019, 11, 20378–20385 CrossRef CAS.
- C. Yuan, J. Li, L. Hou, X. Zhang, L. Shen and X. W. D. Lou, Adv. Funct. Mater., 2012, 22, 4592–4597 CrossRef CAS.
- P. Zhou, L. Chen, M. Zhang, Q. Huang, C. Cui, X. Li, Z. Su, L. Li, C. Yang and Y. Li, J. Alloys Compd., 2019, 797, 826–833 CrossRef CAS.
- K. Zhu, H. Gao, G. Hu, M. Liu and H. Wang, J. Power Sources, 2017, 340, 263–272 CrossRef CAS.
- F. Zou, X. Hu, Z. Li, L. Qie, C. Hu, R. Zeng, Y. Jiang and Y. Huang, Adv. Mater., 2014, 26, 6622–6628 CrossRef CAS.
- K. Cao, T. Jin, L. Yang and L. Jiao, Mater. Chem. Front., 2017, 1, 2213–2242 RSC.
- J. Li, X. Xu, Z. Luo, C. Zhang, X. Yu, Y. Zuo, T. Zhang, P. Tang, J. Arbiol, J. Llorca, J. Liu and A. Cabot, Electrochim. Acta, 2019, 304, 246–254 CrossRef CAS.
- J. Li, X. Xu, Z. Luo, C. Zhang, Y. Zuo, T. Zhang, P. Tang, M. F. Infante-Carrió, J. Arbiol, J. Llorca, J. Liu and A. Cabot, ChemSusChem, 2019, 12, 1451–1458 CrossRef CAS.
- L. Shen, H. Lv, S. Chen, P. Kopold, P. A. van Aken, X. Wu, J. Maier and Y. Yu, Adv. Mater., 2017, 29, 1700142 CrossRef.
- B. Hao, Y. Yan, X. Wang and G. Chen, ACS Appl. Mater. Interfaces, 2013, 5, 6285–6291 CrossRef CAS.
- C. Chen, X. Hu, B. Zhang, L. Miao and Y. Huang, J. Mater. Chem. A, 2015, 3, 22591–22598 RSC.
- Q. Wu, J. Xu, X. Yang, F. Lu, S. He, J. Yang, H. J. Fan and M. Wu, Adv. Energy Mater., 2015, 5, 1401756 CrossRef.
- B. Long, M.-S. Balogun, L. Luo, W. Qiu, Y. Luo, S. Song and Y. Tong, Adv. Energy Mater., 2018, 8, 1701681 CrossRef.
- Y. Liu, X. Yan, B. Xu, J. Lan, Y. Liu, X. Yang, Y. Lin and C. Nan, J. Mater. Chem. A, 2018, 6, 24298–24310 RSC.
- D. Bérardan, S. Franger, D. Dragoe, A. K. Meena and N. Dragoe, Phys. Status Solidi RRL, 2016, 10, 328–333 CrossRef.
Footnote |
| † Electronic supplementary information (ESI) available. See DOI: 10.1039/c9ra05508h |
| This journal is © The Royal Society of Chemistry 2019 |

