 Open Access Article
Electrochemical properties of yttrium on W and Pb electrodes in LiCl–KCl eutectic melts
Wei Han *,
Wenlong Li,
Jiazhuang Chen,
Mei Li*,
Zhuyao Li,
Yongchang Dong and
Milin Zhang
Key Laboratory of Superlight Materials and Surface Technology, Ministry of Education, College of Materials Science and Chemical Engineering, Harbin Engineering University, Harbin 150001, China. E-mail: weihan@hrbeu.edu.cn; Fax: +86 451 8253 3026; Tel: +86 451 8256 9890
First published on 27th August 2019
Abstract
Cyclic voltammetry, square wave voltammetry, linear polarization, chronopotentiometry and chronoamperometry were performed to investigate the electrochemical properties of Y(III) on W and Pb electrodes in LiCl–KCl eutectic melts. The diffusion coefficient of Y(III) measured by various techniques was in the order of 10−5. The nucleation of Y on W electrode was found to comply with the instantaneous nucleation mechanism. With increasing temperature, the exchange current densities increased and the charge-transfer resistances decreased, and exchange current densities are distinctly larger on liquid Pb electrode compared with W electrode. In addition, the co-deposition mechanism of Y(III) and Pb(II) on W electrode was also studied and four Pb–Y intermetallics could be detected. The feasibility of extraction metallic Y from the melts was explored by co-deposition on W electrode and under-potential deposition on liquid Pb electrode and the extracted products consisted of Pb3Y and Pb phases.
Introduction
With the depletion and exhaustion of fossil energy and the deterioration of the environment, new types of energy, like nuclear energy, solar energy, wind energy, etc., have attracted more and more attention. Therein, solar energy and wind energy are greatly affected by weather and geographical location, which results in the instability in the power generation process. However, nuclear energy, owning high stability, low pollution, high energy density and low cost, is considered as a significant energy system. To insure the sustainable development of nuclear energy productions, it is essential to manage spent nuclear fuels in a safe and economical way. The pyrometallurgical process, which uses molten salts (high thermal resistance, high radiation and high solubility) as electrolyte, is recognized as an effective method for the separation of actinides (Ans) from fission products dissolved anodically in molten salts.1 It is worth noting that the rare earth elements (REs), the most troublesome fission products to be extracted and separated from the Ans, can destroy the neutron economy of the reactor core in the transmutation stage due to their large capture cross sections. Furthermore, REs can accumulate in molten salts during the separation and extraction stage, resulting in the modification of the media characteristics and contamination of the final product. Thus, it is required to remove the REs from the molten salts after the selective separation of Ans to ensure a longer lifetime of the media.Many researchers investigate the extraction of REs on various electrodes in molten salts.2–5 It is reported that liquid metal as working electrode possesses many advantages compared with solid electrode. For example, the electrode area is changeless, and the diffusion of deposited metal into the liquid metal is easier.6,7 Thus, liquid Ga,7–11 Bi,12–15 Cd,13,16 Zn,17–24 Sn25 were selected as cathode to separate REs from molten salts. The melting point of Pb metal is 600 K and boiling point is 1798 K, it is easy to melt but doesn't evaporate at 723–823 K. Thus, Pb metal seems to be a good candidate as the cathode material in separation and extraction of REs by molten salt electrolysis. So far, the electrochemical mechanism and extraction of fission products on liquid Pb electrode have not been reported in molten salts.
On the other hand, it is very important to investigate the nucleation mechanism and kinetic parameters for the electro-deposition process of metal. Thus, the nucleation mechanisms of REs were explored on W electrode.26–31 Marsden et al.26 found the nucleation process of cerium on W electrode is instantaneous at various potential. Castrillejo et al.27 reported that the nucleation mechanisms of dysprosium and scandium on W electrode are instantaneous nucleation and independent of temperature and potential. Furthermore, Tang et al.29–31 analyzed the nucleation mechanisms of lanthanum, neodymium and erbium on W electrode in LiCl–KCl eutectic melts.
Exchange current density (ECD) is an important kinetic parameter, which decides whether an electrode reaction occurs easily. The higher ECD, the smaller over-potential is required for the electrode reaction. Therefore, the ECD of RE/RE(III) on different electrodes were studied in recent years. Guo et al.,32 Tang and Pesic29 and Andrews et al.33 explored the ECD of La(III)/La(0) on inert electrode in LiCl–KCl eutectic melts. Andrews et al.33 analyzed the relative error of ECD of La(III)/La(0) obtained by cyclic voltammetry (CV), linear polarization (LP) and Tafel methods. They thought the method determined by CV has the least relative error. Yoon and Phongikaroon34 and Marsden et al.26 determined the ECD of Ce(III)/Ce(0) on W electrode in LiCl–KCl eutectic melts by electrochemical impedance spectroscopy (EIS) and LP method, respectively. ECD of Gd(III)/Gd(0) on W electrode was also estimated by Tafel method, LP and EIS, and the errors caused by various methods were also analyzed.35 Lim et al.36 measured the exchange current densities of RE(III)/RE(II/0) (La, Ce, Pr, Nd, Sm, Eu, Gd, Tb, Dy, Ho, Er, Tm, Yb, Lu) on W electrode by Tafel measurement. The results revealed that the ECD of RE(III)/RE(0) are greater than that of RE(III)/RE(II). The ECD of Tb(III)/Tb(0) on W and Bi film electrodes were also investigated by LP method, which showed that the values of ECD on Bi film are bigger than that on W electrode.37 Furthermore, the exchange current densities and reaction activation energy for Dy(III)/Cu5Dy and Dy(III)/Cu9/2Dy couples were also researched by LP method. The reaction activation energy for the Dy(III)/Cu5Dy couple was found to be higher than that for the Dy(III)/Cu9/2Dy couple.38
Metallic yttrium is one of fission products. Many investigators selected it as a representative rare earth element to study the electrochemical extraction on diverse electrodes. For instance, the electrochemical behavior of Y(III) and the extraction of metallic Y were investigated on liquid Bi electrode, and the Y–Bi alloys were acquired by galvanostatic electrolysis (GE) at various current intensities.39 The electrochemical properties of Y(III) on W, Zn film and liquid Zn electrodes were also studied in LiCl–KCl eutectic melts, and the extraction efficiency of Y(III) on liquid Zn electrode was estimated.17 Sato et al.40 and Li et al.41 investigated the electrochemical property of Y(III) on Ni electrode employing various electrochemical techniques. Ni3Y and Ni5Y alloy layers were produced on Ni cathode by constant potential electrolysis in NaCl–KCl–YCl3 and LiCl–KCl–YCl3 melts system. In addition, the relative partial molar Gibbs energies of Ni–Y alloys were estimated by electromotive force measurements.41
Based on the above discussion, the electrochemical mechanism of RE(III) on Pb electrode, ECD of Y(III)/Y(0) couple on W and liquid Pb electrodes as well as nucleation mechanisms of Y on W electrode have not been studied. Thus, in this work, the electrochemical deposition mechanism of metallic Y on inert W and Pb electrodes were investigated by transient and steady electrochemical techniques. The ECD for Y(III)/Y(0) couple on W and liquid Pb electrodes and nucleation mechanism of Y on W electrode were studied. Furthermore, the electrochemical extraction of metallic Y was executed by co-deposition of Y(III) and Pb(II) on W electrode and under-potential deposition of metallic Y on liquid Pb electrode, and the products were analyzed by SEM-EDS and XRD.
Experimental
Preparation and purification of solvent salts
The analytical grade chemicals, LiCl (Xilong Chemical Co., Ltd), KCl (Xilong Chemical Co., Ltd), YCl3 (99.9%, high Purity Chemical Co., Ltd) and PbCl2 (99.9%, Aladdin Industrial Corporation) were applied in this experiment. The anhydrous LiCl–KCl eutectic melts with a 45.8![[thin space (1/6-em)]](https://www.rsc.org/images/entities/char_2009.gif) :
:![[thin space (1/6-em)]](https://www.rsc.org/images/entities/char_2009.gif) 54.2 mass ratio was located in an alumina crucible as a supporting electrolyte. Then, the melts was dehydrated by heating at 473 K more than 48 h for the sake of removing extra water. And the other impurities in chlorides solvent were eliminated by pre-electrolysis at −2.2 V (vs. Ag/Ag+) for 4 h on a W electrode before the experiments. The PbCl2 and YCl3 power were led in the melts directly as Pb(II) and Y(III) resources, respectively.
54.2 mass ratio was located in an alumina crucible as a supporting electrolyte. Then, the melts was dehydrated by heating at 473 K more than 48 h for the sake of removing extra water. And the other impurities in chlorides solvent were eliminated by pre-electrolysis at −2.2 V (vs. Ag/Ag+) for 4 h on a W electrode before the experiments. The PbCl2 and YCl3 power were led in the melts directly as Pb(II) and Y(III) resources, respectively.
Electrochemical equipment and electrodes
The electrochemical experiment was carried out using Autolab PGSTAT 302N (Metrohm, Ltd), which was commanded by the Nova 1.10 software. In the course of the experiment, the three-electrode system was used. A tungsten wire with 1.0 mm in diameter (99.99%, Beijing Qianshuo Non-ferrous Metal Co., Ltd) and liquid Pb (99.9%, Tianjin Guangfu Fine Chemical Research Institute) were used as work electrode. Therein, the liquid Pb electrode was prepared by adding some Pb particles into a J shaped pyrex tube or alundum crucible with a W wire as an electric lead, following fused in LiCl–KCl eutectic melts. The counter electrode (CE) was a spectral pure graphite rod with 6.0 mm in diameter, which surface area immersed into LiCl–KCl eutectic melts is 2.5 cm2. The reference electrode (RE) was a Ag/Ag+, which was composed of a silver wire with 1.0 mm in diameter contained in a closed pyrex tube in which contain LiCl–KCl eutectic melts with 1.0 wt% silver chloride. If not specified, the potentials in the experiments are relative to the Ag/Ag+ couple.Electrochemical experiments and characterization of deposits
The electrochemical behaviors of Y(III) were executed using CV, square wave voltammetry (SWV), chronoamperometry (CA), LP and chronopotentiometry (CP) on inert W electrode and Pb electrode. The temperature of the melts was determined using a chromel–alumel thermocouple inserted in the eutectic melts. In addition, potentiostatic electrolysis (PE) and GE were used to extract metallic Y from LiCl–KCl eutectic melts. After electrolysis, the product was took out from melts and cooled to room temperature, and then rinsed with deionized water to clear up the remnant salt which adhered to its surface. Then, the sample was dried in an electric furnace and stored in glove-box for further analysis. The phase composition of the sample was detected by X-ray diffraction (XRD, TTR-III diffractometer; Philips Co., Ltd.). The scanning electron microscopy (SEM, JSM-6480A; JEOL Co., Ltd) and energy dispersive spectrometry (EDS, Bruker XFlash Detector 6/60, Germany) were applied to analyze the microstructure and micro-zone chemical ingredients of the products. In addition, the concentration of Y(III) in the melts was measured using inductive coupled plasma atomic emission spectrometer (ICP-AES, IRIS Intrepid II XSP; Thermo Electron Co.).Results and discussion
Electrochemical reaction of Y(III) on inert W electrode
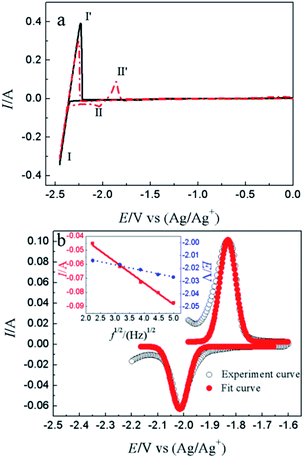
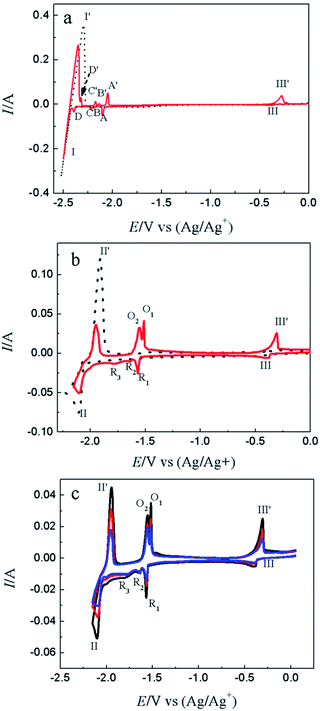
CV is a basic electrochemical method, thus, it was carried out on W electrode in LiCl–KCl and LiCl–KCl–YCl3 melts as shown in Fig. 1a. One pair of redox signals (black solid curve), I/I′ (−2.36/−2.23 V), was detected on W electrode in blank eutectic melts, corresponding to the deposition and dissolution of lithium metal.17 However, when anhydrous YCl3 was added in the melts, there is a new pair of redox peaks, II/II′ (−2.03/−1.86 V), appearing in the red dotted curve, which is related to the deposition and dissolution of metallic Y on W electrode.17Subsequently, cathodic square wave voltammetry (CSWV) and anodic square wave voltammetry (ASWV) were conducted in order to study transfer electron number and diffusion coefficient of Y(III) in the melts. Fig. 1b presents the CSWV and ASWV curves and fit curves. According to eqn (1), the number of exchanged electrons could be estimated. The transfer electron number of the formation and dissolution of metallic Y were calculated to be 2.93 and 3.18, respectively. Therefore, the reduction of Y(III) on W electrode was one step with the exchange of three-electron.
| n = 3.52RT/W1/2F | (1) |
| Y(III) + 3e− = Y(0) | (2) |
Furthermore, diffusion coefficient of Y(III) in LiCl–KCl eutectic melts can also be evaluated using CSWV at different scan frequencies. The relationship of peak current and square root of the frequency shows a good linear relationship and doesn't go through the origin, indicating the reduction of Y(III) on W electrode isn't reversible and controlled by diffusion of Y(III).42 In addition, the peak potentials of CSWV change to more negative direction slightly with the frequency increases, indicating the process of redox is quasi-reversible. Based on eqn (3),43,44 the diffusion coefficient of Y(III) was obtained to be 2.95 × 10⁻⁵ cm2 s−1 and is listed in Table 1, which is slightly larger than 1.29 × 10⁻⁵ cm s−1 obtained by Castrillejo.45
 | (3) |
| Techniques | CSWV | CV | CA | CP43 |
|---|---|---|---|---|
| D × 10−5/cm2 s−1 | 2.95 | 2.74 | 2.05 | 1.29 |
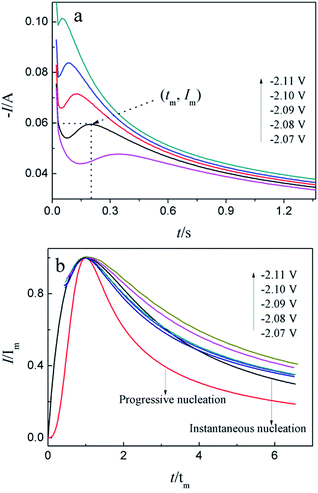
For investigation the nucleation mechanism of Y on W electrode, CA was conducted in LiCl–KCl–YCl3 melts (Fig. 2a). It can be seen that the current drops sharply at the beginning, which is attributed to the charging of the double layer. Then, the current begin increases and reaches the maximum (Im) in a very short time (tm), which is attributed to the nucleation and crystal growth process of metallic Y. After reaching the current peak, the current begins to decrease gradually and then trend to stabilize. Applied potential is different, Im and tm are also different, and Im increases, whereas, tm decreases with the potential shifting negatively. This means that the deposition of Y on W electrode is three-dimensional nucleation growth mechanism and controlled by diffusion. Scharifker and Hills46 proposed the non-dimensional model for instantaneous and progressive nucleation analysis and the relationship of I/Im vs. t/tm shown in eqn (4) and (5).
 | (4) |
 | (5) |
Fig. 2b shows the comparison of the non-dimensional plot derived from CA curves and the theoretical curves. It can be seen distinctly that the deposition of metallic Y on W electrode fit instantaneous nucleation.
Because the nucleation mechanisms of Y on W electrode is instantaneous nucleation, thus, the nucleation number density N for Y on W electrode at different applied potentials can be estimated using eqn (6) (ref. 47), and the results are listed in Table 2. It can be found from Table 2, the nucleation number density increases with the increase of over-potential. Obviously, the nucleation number density is influenced by over-potential, which has been proved by Grujicic and Pesic.48
 | (6) |
| -2.07 | −2.08 | −2.09 | −2.10 | −2.11 |
| 4.17 | 8.22 | 13.47 | 25.94 | 45.32 |
To study the electrochemical reaction of Y(III) on W electrode, LP method was used to study ECD of Y(III)/Y(0) couple on W electrode. In case of very low over-potential, Butler–Volmer equation14 (eqn (7)) can be simplified to eqn (8) if the effects of mass-transfer are ignored.
 | (7) |
 | (8) |
Fig. 3a presents LP curves at diverse temperatures in LiCl–KCl–YCl3 melts at the scan rate of 0.003 V s−1. It is obvious that the net current is linearly related to the over-potential, and the slopes of the lines increase with the increase of temperatures. According to eqn (8), the ECDs were computed and are listed in Table 3. Yoon and Phongikaroon34 determined the ECD for Ce(III)/Ce(0) on W electrode by EIS. They reported that the ECD for Ce(III)/Ce(0) couple are 0.058–0.113 A cm−2 at 698 K to 798 K, which are similar to our results. The linear relationship of ln(i0) and 1/T shown in Fig. 3b accords with Arrhenius equation eqn (9).49 Thus, the reaction activation energy for Y(III)/Y(0) couple on W electrode was estimated to be 35.59 kJ mol−1, which closed to 30.5 kJ mol−1 for Gd(III)/Gd(0) obtained by optimization fitting method.35
i0 = A![[thin space (1/6-em)]](https://www.rsc.org/images/entities/char_2009.gif) exp(−Ea/RT) exp(−Ea/RT)
| (9) |
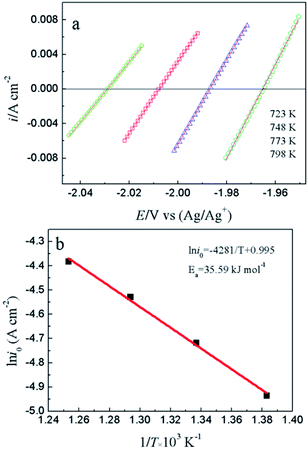 | ||
| Fig. 3 (a) The LP curves recorded at different temperature in LiCl–KCl–YCl3 (1.99 × 10⁻⁴ mol cm−3) melts on W electrode. (b) Natural logarithm of i0 against the inverse temperature. | ||
| Temperature(K) | 723 | 748 | 773 | 798 | ||||
|---|---|---|---|---|---|---|---|---|
| W | Pb | W | Pb | W | Pb | W | Pb | |
| i0 (mA cm−2) | 7.2 | 12.6 | 9.0 | 14.1 | 10.8 | 16.1 | 12.5 | 18.9 |
| Rct (Ω) | 8.7 | 5.0 | 7.2 | 4.6 | 6.2 | 4.1 | 5.5 | 3.6 |
| Ea (kJ mol−1) | 35.59 (WE: W) | Pb: 26.21 (WE: Pb) | ||||||
Since there is a linear relationship between currents and over-potentials near the equilibrium potential, the charge-transfer resistances (Rct) at different temperatures can be obtained by eqn (10).
 | (10) |
The calculated results are also presented in Table 3. It can be seen that the values of charge-transfer resistance decrease with the increase of temperature.
Electrochemical reaction of Y(III) on liquid Pb electrode
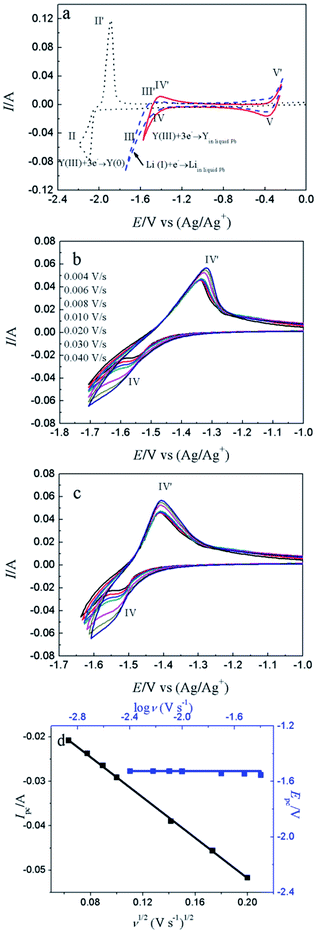
Fig. 4a shows the comparison of CV curves recorded on W electrode in LiCl–KCl eutectic melts (black dotted line) and on liquid Pb electrode in LiCl–KCl–YCl3 melts (red solid lines) and LiCl–KCl eutectic melts (blue broken line). On the basis of the result of Fig. 1a, a pair of redox peaks II/II′(−2.06 V/−1.84 V) corresponds to the reduction and oxidation of Y. In blue broken curve detected on liquid Pb electrode, two pairs of redox signals of III/III′ and V/V′ are observed. The anodic/cathodic signals of V′/V detected at about −0.38/−0.40 V pertain to the dissolution and deposition of Pb metal.50 It can be inferred from the shape of the redox signals (III/III′), that the system is soluble–soluble, and III/III′ are related with the formation/dissolution of (Li–Pb) solid solution. The deposition potential of Li on liquid Pb electrode can be seen at more positive value than that on W electrode due to the formation of (Li–Pb) solution, and process is expressed as following:| Li(I)in LiCl–KCl + e− + Pb = (Li–Pb)solution | (11) |
From the CV curve recorded on liquid Pb electrode in LiCl–KCl–YCl3 melts (red solid lines), a reduction signal IV starts at about −1.30 V, which is ascribed to the formation of metallic Y on liquid Pb electrode. It can be also found the deposition potential of Y on liquid Pb could be 0.80 V more positive than that on W electrode. The electrochemical formation of (Y–Pb) solution can be described in eqn (12).
| Y(III)in LiCl–KCl + 3e− + Pb = (Y–Pb)solution | (12) |
Fig. 4b displays the CV curves detected at various scan rates. It can be seen that the peak currents increase and cathodic and anodic peak potentials change to more negative and positive direction, respectively, with increasing scan rate. This infers that the reduction reaction of Y(III) on liquid Pb electrode is not reversible. Since the solution resistance can cause the shift of potential, the calibrations were conducted in order to eliminate solution resistance. The ohmic drop in LiCl–KCl eutectic melts is about 0.3 Ω at 773 K.51 The CV curves after calibration measurements is presented in Fig. 4c, which hints the peak potential values are slight deviation with the change of scan rates. To explore the reversibility and control step of electrode reaction, Fig. 4d shows the changes of cathode peak potentials and currents with scan rates. The cathode peak potential curve is almost parallel to the X-axis when scan rate is less than 0.01 V s−1. However, the cathode peak potentials shift negatively at scan rate of above 0.01 V s−1. Therefore, the reduction reaction of Y(III) on liquid Pb is quasi-reversible. Meanwhile, a linear relationship between cathode peak current with scan rate indicates the reaction of Y(III) on liquid Pb electrode is controlled by diffusion of Y(III). For quasi-reversible electrochemical reaction, the diffusion coefficient can be calculated based on Delahay equation:43
 | (13) |
 | (14) |
To compare the reaction characteristics of Y(III)/Y(0) couple on liquid Pb electrode with on inert W electrode, LP method (η = ±15 mV) was conducted in LiCl–KCl–YCl3 (1.99 × 10⁻⁴ mol cm−3) melts on liquid Pb electrode in the temperatures range from 723 K to 798 K (Fig. 5). Based on eqn (8), the ECD for reaction (11) were estimated and found to be 12.6 to 18.9 mA cm−2 (shown in Table 3), which are greater than those on inert W electrode. In addition, the calculated activation energy is 26.21 kJ mol−1, less than the one on W electrode, which indicates that the reaction on liquid Pb electrode need less energy and easily occurs on liquid Pb electrode. Similar to the study on W electrode, the charge-transfer resistances (Rct) is also acquired at disparate temperatures and shown in Table 3. The values of charge-transfer resistances (Rct) are smaller than those obtained on W electrode. The comparison of charge-transfer resistances on different electrodes is presented in Fig. 6. The charge-transfer resistances are smaller than those on W electrode, suggesting that the electrode reaction occurs easily on liquid Pb electrode.
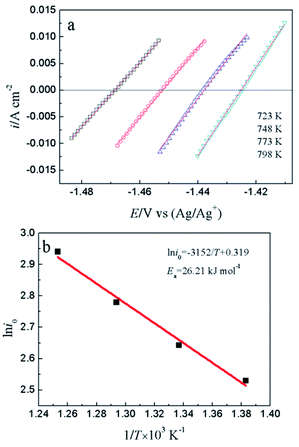 | ||
| Fig. 5 (a) The LP curves attained at different temperatures in LiCl–KCl–YCl3 (1.99 × 10⁻⁴ mol cm−3) melts on liquid Pb electrode. (b) Natural logarithm of i0 against the inverse temperature. | ||
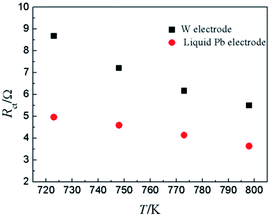 | ||
| Fig. 6 The charge-transfer resistance of Y(III)/Y(0) couple on inert W electrode and liquid Pb electrode at different temperatures. | ||
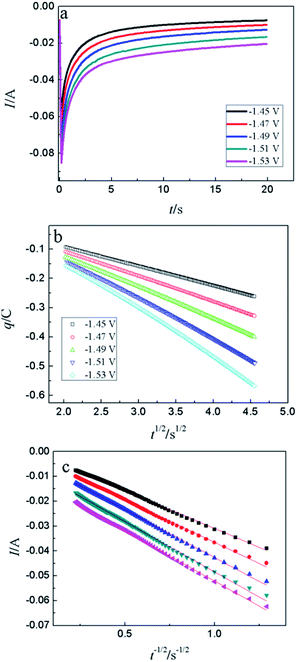
CA was conducted in LiCl–KCl–YCl3 (1.99 × 10⁻⁴ mol cm−3) melts on liquid Pb electrode in the potential range (the formation potential of Y–Pb solution) from −1.45 to −1.53 V at 773 K (see Fig. 7a). After the current sharply increases, it decreases with time due to the gradually decreases of Y(III) near the surface of Pb electrode, which means that the reduction reaction controlled by diffusion of Y(III). If the relationship of electric quantity (Q) and the square root of time (t1/2) is linear, the electrode reaction is controlled by diffusion of ions to electrode surface.52 Thus, it demonstrates from Fig. 7b that the reaction of Y(III) on liquid Pb electrode is controlled by diffusion. According to the linear relationship between currents and the reciprocal of square root of time, Cottrell equation (eqn (15)) was used to estimate the diffusion coefficient of Y(III) in LiCl–KCl eutectic melts by the slopes of the lines (shown in Fig. 7c). The diffusion coefficients at different applied potentials (−1.45 V, 1.47 V, 1.49 V, −1.51 V and −1.53 V) are 1.39 × 10⁻⁵ cm2 s−1;1.75 × 10⁻⁵ cm2 s−1; 2.22 × 10⁻⁵ cm s−1; 2.46 × 10⁻⁵ cm s−1; 2.42 × 10⁻⁵ cm2 s−1, respectively, and the average value is 2.05 × 10⁻⁵ cm s−1 (presented in Table 1), which has a similar value to that determined by CWSV and CV.
 | (15) |
Electrochemical co-reduction of Y(III) and Pb(II) in LiCl–KCl eutectic melts
The electrochemical co-reduction of Y(III) and Pb(II) was conducted by CV, SWV and CP. Fig. 8a shows the CV conducted in LiCl–KCl eutectic melts (black dotted line) and LiCl–KCl–PbCl2 (1.38 × 10⁻⁵ mol cm−3, red solid line) on W electrode. Compared with blank eutectic melts, five pairs of redox peaks were observed when PbCl2 was added in eutectic melts. The redox peaks of A/A′ (−2.104/−2.048 V), B/B′ (−2.187/−2.135 V), C/C′ (−2.224/−2.174 V) and D/D′ (−2.396/−2.322 V) is ascribed to the formation and subsequent dissolution of different Pb–Li intermetallic compound.51 In addition, the redox peak III/III′ (−0.366/−0.276 V) are attributed to the deposition and dissolution of Pb metal, which have been mentioned above. It is strange that the reduction peak associated with the formation of (Pb–Li) solid solution is not detected in Fig. 4a. The reason may be that on Pb film electrode, the amount of Pb metal is small. Thus, the (Pb–Li) solution cannot be formed at potentials around −1.6 V (Fig. 4a). However, on liquid Pb electrode, which contains a large amount of Pb metal, the (Pb–Li) solution can be formed at potentials around −1.6 V (Fig. 4a). The comparison of CV curves on W electrode recorded in LiCl–KCl–YCl3 (1.99 × 10⁻⁴ mol cm−3) melts and LiCl–KCl–PbCl2 (1.38 × 10⁻⁵ mol cm−3)–YCl3 (1.99 × 10⁻⁴ mol cm−3) melts is displayed in Fig. 8b. As discussed above, the redox peaks II/II′, recorded at about −2.10/−1.94 V on the black dotted line, are attributed to the deposition of metallic Y and subsequently dissolution on W electrode. When anhydrous PbCl2 was added into the melts, except for the redox peaks II/II′, four new reduction peaks, R1, R2, R3 and III appearing at about −1.76 V, −1.64 V, −1.57 V and −0.40 V on the red solid line, are ascribed to the formation Pb–Y alloys and Pb metal, respectively. Since the deposited metallic Y reacts with the pre-deposited Pb film and forms Pb–Y intermetallic compounds resulting in the deposition potential of Y(III) shift towards more positive direction.The formation process of Pb–Y intermetallics can be described as the two step reactions: (1) xPb(II) + 2xe− → xPb; (2) Y(III) + 3e− + xPb → PbxY. Thus, the electrochemical formation of Pb–Y intermetallics can be expressed by the following equation:
| Y(III) + xPb(II) + (3 + 2x)e− → PbxY | (16) |
Fig. 8c shows the CV curves determined at diverse scan rates. It is clear that the peak potential values hardly change with the increase of scan rates, which imply the formation and dissolution of Pb–Y alloys are reversible.
SWV was applied to explore the co-deposition process of Y(III) and Pb(II) on W electrode in LiCl–KCl–PbCl2–YCl3 melts Fig. 9. In addition to the peaks II (−2.06 V) and III (−0.39 V) ascribed to the reduction of Y(III) and Pb(II) on W electrode, four reduction peaks, R1 (−1.54 V), R2 (−1.62 V), R3 (−1.66 V) and R4 (−1.76 V), were detected in the potential range from −1.5 V to −1.8 V. Based on the phase diagram of Pb–Y binary system,53 four Pb–Y alloys, Pb3Y, Pb2Y, Pb4Y5 and Pb3Y5, can be formed at 773 K. Thus, the four reduction signals are related to the formation of Pb3Y, Pb2Y, Pb4Y5 and Pb3Y5 on pre-deposited Pb film electrode, respectively.
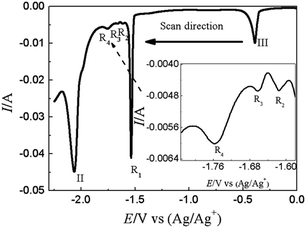 | ||
| Fig. 9 SWV curve obtained in LiCl–KCl–PbCl2 (1.38 × 10⁻⁵ mol cm−3)–YCl3 (1.99 × 10⁻⁴ mol cm−3) melts on W electrode. Potential step: 1 mV; frequencies: 10 Hz; amplitude: 25 mV; A = 0.408 cm2. | ||
Fig. 10 illustrates the CP curves recorded on W electrode at various currents in LiCl–KCl–PbCl2–YCl3 melts. When the applied current is 2 mA, a platform III appears at about −0.36 V related to the deposition of Pb metal on inert W electrode. It can be seen that with the increase of applied currents, the potential platform III becomes shorter and shorter which is brought about quickly decrease of the concentration of Pb(II) on surface of electrode. When the concentration of Pb(II) reaches zero on the surface of electrode, the Pb–Y alloy begins to form and the potential drop to more negative. While the applied current in the range from 7.5 mA to 12 mA, four potential platforms, R1 (−1.52 V), R2 (−1.60 V), R3 (−1.66 V) and R4 (−1.77 V) were detected, which are attributed to the formation of different Pb–Y intermetallic compounds. The result further demonstrates the Y(III) and Pb(II) could react to form Pb–Y alloys on W electrode at 773 K when the current is bigger than 7.5 mA. What's more, the potential platform II at about −2.04 V is detected, which is caused by the reduction of Y(III) to Y(0). When the applied current reached 30 mA, a limit potential platform I at −2.42 V was observed in Fig. 10, which is correlated with the formation of Li metal.
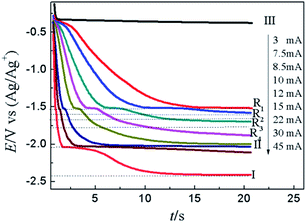 | ||
| Fig. 10 CP curves recorded in LiCl–KCl–PbCl2–YCl3 melts on inert W electrode (A = 0.408 cm2) at diverse current. | ||
Extraction and characterization of Pb–Y alloy
To ascertain the feasibility of electrochemical extraction Y on Pb electrode, the co-deposition of Y(III) and Pb(II) on W electrode, PE and GE were conducted in LiCl–KCl–PbCl2–YCl3.GE was employed in LiCl–KCl–PbCl2–YCl3 melts on inert W electrode at −1.59 A cm−2 for 2 h. The prepared sample was characterized using SEM-EDS and XRD and results presented in Fig. 11. It can be found from Fig. 11(a and b) that the product is porous and consists of Pb and Y elements. In addition, EDS analysis result (Fig. 11c) reveals that the atom percentage ratio of Pb to Y in zone A taken from Fig. 11a is about 2.45. XRD patterns of the product (see Fig. 11d) shows that the sample is mainly composed of Pb, KCl and Pb3Y phases. The reason of existence of KCl is because the salt adhered to the product surface was not washed clean during washing product. The experimental result indicates that Y could be extracted from LiCl–KCl–PbCl2–YCl3 melts by the co-deposition of Y(III) and Pb(II) on W electrode.
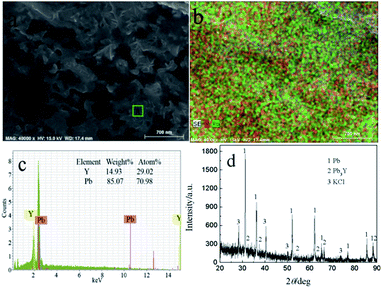 | ||
| Fig. 11 SEM-EDS and XRD patterns of sample prepared at −1.59 A cm−2 for 2 h on a W electrode in LiCl–KCl–YCl3–PbCl2 melts at 773 K. | ||
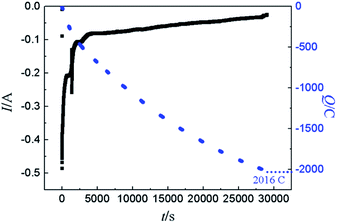
For demonstration the feasibility of using liquid Pb as a cathode to extract Y in LiCl–KCl eutectic melts, PE was conducted at −1.5 V on liquid Pb electrode. The change of current with time was recorded and is presented in Fig. 12 (black solid line). It can be found that the current decreases with the increase of electrolysis time because of the concentration of Y(III) in melts tapers off, and fewer metallic Y are deposited with prolonging electrolysis time. The charge was calculated by integrating the current (blue dotted line) and the total electric quantity is 2016 C. The concentration of Y(III) in melts before and after the run was measured by ICP-AES. Thus, the coulomb efficiency was computed using eqn (17), and found to be 98.1%.
 | (17) |
Fig. 13 shows the SEM-EDS and XRD of sample obtained by PE at −1.5 V on liquid Pb electrode. Two distinctly different morphologies, dark and light grey zones, can be seen in Fig. 13a. The Y element is not evenly distributed in the sample and mainly distributed in green areas from Fig. 13b. In order to make sure the element content of Y and Pb, the EDS analysis of A zone taken from Fig. 13a was conducted and the atom percentage ratio of Pb to Y is 2.25, which indicates that the Y mainly exist in the dark grey zone. The XRD result (Fig. 13d) shows the sample is mainly composed of two phases, Pb and Pb3Y. According to Pb–Y phase diagram,52 there are four Pb–Y intermetallic compounds (Pb3Y, Pb2Y, Pb4Y5 and Pb3Y5). When the extraction was performed on liquid Pb electrode, the amount of Pb is large, thus, the Pb-richest Pb–Y compound Pb3Y can be formed. However, metallic Li is not detected using XRD. To ascertain whether the formation of metallic Li, the product was analyzed by ICP-AES, which shows the atomic percent of Li in product is only 0.21%. The small quantity of Li in product maybe resulted from the salts, which sticks to the sample.
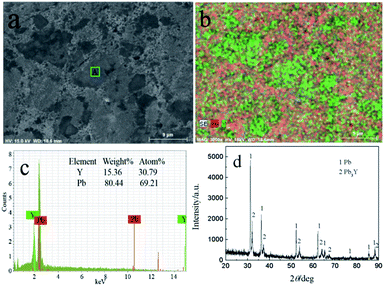 | ||
| Fig. 13 SEM-EDS and XRD patterns of sample prepared at −1.5 V on liquid Pb electrode in LiCl–KCl–YCl3 melts. | ||
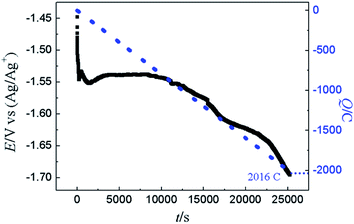
The GE was also conducted on liquid Pb electrode in LiCl–KCl–YCl3 melts at −16 mA cm−2. To compare with PE, the electric quantity was set to 2016 C. The change of cathode potential (black solid line) and electric quantity (blue dotted line) with electrolysis time are recorded in Fig. 14. Before 10![[thin space (1/6-em)]](https://www.rsc.org/images/entities/char_2009.gif) 000 s, the potential is fluctuating and little change at about −1.55 V, which infers that the only Y(III) was reduced. However, the potential starts to shift towards the negative direction sharply, indicating that metallic Li may be deposited on liquid Pb electrode based on the result obtained in Fig. 4a. Meanwhile, the coulomb efficiency was estimated using eqn (17) and found to be 82%, smaller than that in PE. This could be due to the high current density employed in this experiment, which will results in the deposition of Li on liquid Pb electrode at the later stage of GE and decrease of the coulomb efficiency.
000 s, the potential is fluctuating and little change at about −1.55 V, which infers that the only Y(III) was reduced. However, the potential starts to shift towards the negative direction sharply, indicating that metallic Li may be deposited on liquid Pb electrode based on the result obtained in Fig. 4a. Meanwhile, the coulomb efficiency was estimated using eqn (17) and found to be 82%, smaller than that in PE. This could be due to the high current density employed in this experiment, which will results in the deposition of Li on liquid Pb electrode at the later stage of GE and decrease of the coulomb efficiency.
Fig. 15 shows the SEM-EDS and XRD of sample obtained by GE at −16 mA cm−2 on liquid Pb electrode. It can be seen from Fig. 15a and b, the sample consists of Y and Pb elements and Y is not evenly distributed in the sample. According to the EDS analysis, the atom percentage ratio of Pb to Y in zone A taken from Fig. 15a is about 2.41, which possesses the similar ratio of the zone A in Fig. 13a. Fig. 15d shows the XRD patterns of sample and the results indicating that the sample is comprised of Pb and Pb3Y phases. Similar to PE, metallic Li can't be detected by XRD. Based on the results of ICP-AES, the atomic percent of Li in product is 1.14%.
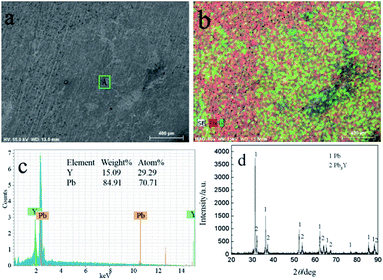 | ||
| Fig. 15 SEM-EDS and XRD pattern of electrolysis sample prepared at −16 mA cm−2 for 2016 C on a liquid Pb electrode in LiCl–KCl–YCl3 melts at 773 K. | ||
Conclusions
Different electrochemical methods were employed to investigate the electrochemical reaction of Y(III) on W and Pb electrodes. The process was found to be 3-electron transfer and diffusion controlled, and the diffusion coefficient of Y(III) in LiCl–KCl eutectic melts was determined and found to be 2.95 × 10⁻⁵ cm2 s−1, 2.74 × 10⁻⁵ cm2 s−1 and 2.05 × 10⁻⁵ cm2 s−1 by CSWV, CV and CA, respectively. Also, the nucleation mechanism of metallic Y on W electrode investigated by CA was instantaneous nucleation. The kinetic properties of Y(III)/Y(0) couple on both W and Pb electrodes were determined by LP method. The ECD increased and the charge-transfer resistances decreased with increasing temperature. ECDs on liquid Pb electrode are distinctly larger than that on W electrode, which showed that the electrode reaction occurs easily on liquid Pb electrode compared with W electrode. Furthermore, four intermetallic compounds of Pb–Y could be formed by co-deposition of Y(III) and Pb(II) on W electrode detected by CV, SWV and CP. The results of SEM-EDS and XRD proved the Pb–Y alloys, comprised of YPb3 and Pb phases, can be formed by co-deposition on W electrode and under-potential deposition on liquid Pb electrode, respectively. In addition, the coulomb efficiency in PE is larger than that in GE when passed 2016 C. It is proved that using liquid Pb as working electrode can extract metallic Y from LiCl–KCl eutectic melts.Conflicts of interest
There are no conflicts to declare.Acknowledgements
The work was financially supported by the National Natural Science foundation of China (11575047, 11675044, 21876034, 11875116 and 21790373) and the Fundamental Research funds for the Central Universities (HEUCFP201849).References
- Y. L. Liu, W. Zhou, H. B. Tang, Z. R. Liu, K. Liu, L. Y. Yuan, Y. X. Feng, Z. F. Chai and W. Q. Shi, Electrochim. Acta, 2016, 211, 313–321 CrossRef CAS.
- Q. C. Yan and X. M. Guo, J. Alloys Compd., 2018, 747, 994–1001 CrossRef CAS.
- K. Liu, Y. L. Liu, L. Y. Yuan, X. L. Zhao, Z. F. Chai and W. Q. Shi, Electrochim. Acta, 2013, 109, 732–740 CrossRef CAS.
- M. Li, B. Liu, N. Ji, Y. Sun, W. Han, T. Jiang, S. M. Peng, Y. D. Yan and M. L. Zhang, Electrochim. Acta, 2016, 193, 54–62 CrossRef CAS.
- Y. C. Wang, M. Li, W. Han, M. L. Zhang, T. Jiang, S. M. Peng and Y. D. Yan, J. Alloys Compd., 2017, 695, 3484–3494 CrossRef CAS.
- Y. L. Liu, G. A. Ye, K. Liu, L. Y. Yuan, Z. F. Chai and W. Q. Shi, Electrochim. Acta, 2015, 168, 206–215 CrossRef CAS.
- S. Delpech, G. Picard, J. Finne, E. Walle, O. Conocar, A. Laplace and J. Lacquement, Nucl. Technol., 2007, 163, 373–381 CrossRef.
- J. Finne, G. Picard, S. Sanchez, E. Walle, O. Conocar, J. Lacquement, J. M. Boursier and D. Noel, J. Nucl. Mater., 2005, 344, 165–168 CrossRef CAS.
- K. Liu, Y. L. Liu, Z. F. Chai and W. Q. Shi, J. Electrochem. Soc., 2017, 164, D169–D178 CrossRef CAS.
- J. W. Pang, K. Liu, Y. L. Liu, C. M. Nie, L. X. Luo, L. Y. Yuan, Z. F. Chai and W. Q. Shi, J. Electrochem. Soc., 2016, 163, D750–D756 CrossRef CAS.
- K. Liu, H. B. Tang, J. W. Pang, Y. L. Liu, Y. X. Feng, Z. F. Chai and W. Q. Shi, J. Electrochem. Soc., 2016, 163, D554–D561 CrossRef CAS.
- W. Han, Z. Y. Li, M. Li, W. L. Li, X. M. Zhang, X. G. Yang, M. L. Zhang and Y. Sun, J. Electrochem. Soc., 2017, 164, E62–E70 CrossRef CAS.
- Y. Castrillejo, M. R. Bermejo, P. DíazArocas, A. M. Martínez and E. Barrado, J. Electroanal. Chem., 2005, 579, 343–358 CrossRef CAS.
- M. Li, Q. Q. Gu, W. Han, X. M. Zhang, Y. Sun, M. L. Zhang and Y. D. Yan, RSC Adv., 2015, 5, 82471–82480 RSC.
- Y. Castrillejo, M. R. Bermejo, F. D. L. Rosa, E. Barrado and P. D. Acocas, Electrochemistry, 2005, 73, 636–643 CrossRef CAS.
- T. Kato, T. Inoue, T. Iwai and Y. Arai, J. Nucl. Mater., 2005, 357, 105–114 CrossRef.
- W. Han, W. L. Li, M. Li, Z. Y. Li, Y. Sun, X. G. Yang and M. L. Zhang, J. Solid State Electrochem., 2018, 22, 2435–2444 CrossRef CAS.
- Y. Xue, Z. P. Zhou, Y. D. Yan, M. L. Zhang, X. Li, D. B. Ji, H. Tang and Z. J. Zhang, RSC Adv., 2015, 5, 23114–23121 RSC.
- M. Li, J. Wang, W. Han, X. G. Yang, M. Zhang, Y. Sun, M. L. Zhang and Y. D. Yan, Electrochim. Acta, 2018, 228, 299–307 CrossRef.
- H. Moriyam, H. Yaman, S. Nishikaw, S. Shibat, N. Wakayam, Y. Miyashit, K. Moritani and T. Mitsugashira, J. Alloys Compd., 1998, 271, 587–591 CrossRef.
- L. Wang, Y. L. Liu, K. Liu, S. L. Tang, L. Y. Yuan, T. Lu, Z. F. Chai and W. Q. Shi, J. Electrochem. Soc., 2015, 162, E179–E184 CrossRef CAS.
- L. X. Luo, Y. L. Liu, N. Liu, L. Wang, L. Y. Yuan, Z. F. Chai and W. Q. Shi, Electrochim. Acta, 2016, 191, 1026–1036 CrossRef CAS.
- W. Zhou, Y. L. Liu, K. Liu, Z. R. Liu, L. Y. Yuan, L. Wang, Y. X. Feng, Z. F. Chai and W. Q. Shi, J. Electrochem. Soc., 2015, 162, D531–D539 CrossRef CAS.
- Y. L. Liu, L. Y. Yuan, K. Liu, G. A. Ye, M. L. Zhang, H. He, H. B. Tang, R. S. Lin, Z. F. Chai and W. Q. Shi, Electrochim. Acta, 2014, 120, 369–378 CrossRef CAS.
- J. X. Song, M. X. Guo, Y. C. Shu, Y. Liu, L. G. Wang and J. L. He, J. Electrochem. Soc., 2017, 164, D916–D921 CrossRef CAS.
- K. C. Marsden and B. Pesic, J. Electrochem. Soc., 2011, 158, F111–F120 CrossRef CAS.
- Y. Castrillejo, M. R. Bermejo, A. I. Barrado, R. Pardo, E. Barrado and A. M. Martınez, Electrochim. Acta, 2005, 50, 2047–2057 CrossRef CAS.
- Y. Castrillejo, P. Hernández, J. A. Rodriguez, M. Vega and E. Barrado, Electrochim. Acta, 2012, 71, 166–172 CrossRef CAS.
- H. Tang and B. Pesic, Electrochim. Acta, 2014, 119, 120–130 CrossRef CAS.
- H. Tang and B. Pesic, J. Nucl. Mater., 2015, 458, 37–44 CrossRef CAS.
- H. Tang and B. Pesic, Electrochim. Acta, 2014, 133, 224–232 CrossRef CAS.
- S. Q. Guo, E. Wu and J. S. Zhang, J. Nucl. Mater., 2018, 510, 414–420 CrossRef CAS.
- H. Andrews and S. Phongikaroon, J. Electrochem. Soc., 2018, 165, E412–E419 CrossRef CAS.
- D. Yoon and S. Phongikaroon, J. Electrochem. Soc., 2015, 162, E237–E243 CrossRef CAS.
- S. Q. Guo, E. Wu and J. S. Zhang, Electrochim. Acta, 2018, 259, 253–261 CrossRef CAS.
- K. H. Lim and J. I. Yun, Electrochim. Acta, 2019, 295, 577–583 CrossRef CAS.
- W. Han, N. Ji, J. Wang, M. Li, X. G. Yang, Y. Sun and M. L. Zhang, RSC Adv., 2017, 7, 31682–31690 RSC.
- W. Han, Z. Y. Li, M. Li, Y. Y. Gao, X. G. Yang, M. L. Zhang and Y. Sun, RSC Adv., 2018, 8, 8118–8129 RSC.
- M. Li, Y. C. Liu, Z. X. Sun, W. Han, M. L. Zhang, X. G. Yang and Y. Sun, Chem. Res. Chin. Univ., 2019, 35, 60–64 CrossRef CAS.
- Y. Sato and M. Hara, Mater. Trans., JIM, 1996, 37, 1525–1528 CrossRef CAS.
- W. Han, Q. Zhao, J. Wang, M. Li, W. K. Liu, M. L. Zhang, X. G. Yang and Y. Sun, J. Rare Earths, 2017, 35, 90–97 CrossRef CAS.
- Q. C. Yan and X. M. Guo, J. Alloys Compd., 2018, 747, 994–1001 CrossRef CAS.
- G. Pakhui, M. Chandra, S. Ghosh, B. P. Reddy and K. Nagarajan, Electrochim. Acta, 2015, 155, 372–382 CrossRef CAS.
- P. Chamelot, B. Lafage and P. Taxil, Electrochim. Acta, 1997, 43, 607–616 CrossRef.
- Y. Castrillejo, M. R. Bermejo, A. M. Martínez and P. D. Arocas, J. Min. Metall., Sect. B, 2003, 39, 109–135 CrossRef CAS.
- B. Scharifker and G. Hills, Electrochim. Acta, 1983, 28, 879–889 CrossRef CAS.
- M. Matsumiya, M. Ishii, R. Kazama and S. Kawakami, Electrochim. Acta, 2014, 146, 371–377 CrossRef CAS.
- D. Grujicic and B. Pesic, Electrochim. Acta, 2005, 50, 4426–4443 CrossRef CAS.
- K. H. Lim, S. Park and J. I. Yun, J. Electrochem. Soc., 2015, 162, E334–E337 CrossRef CAS.
- W. Han, W. J. Wang, Y. C. Dong, M. Li, X. G. Yang and M. L. Zhang, RSC Adv., 2018, 8, 30530–30538 RSC.
- C. Zhang, J. Wallace and M. E. Simpson, Electrochim. Acta, 2018, 290, 429–439 CrossRef CAS.
- Z. Chen, B. Wang, S. J. Li, W. Li, C. C. Wei, X. Y. Jia and W. F. Zhang, ChemElectroChem, 2016, 3, 165–171 CrossRef CAS.
- T. B. Massalski, H. Okamoto, P. R. Subramanian and L. Kacprzak, Binary Alloy Phase Diagrams, ASM International, Ohio, 2nd edn, 1990 Search PubMed.
| This journal is © The Royal Society of Chemistry 2019 |

