
 Open Access Article
 This Open Access Article is licensed under a Creative Commons Attribution-Non Commercial 3.0 Unported Licence
In situ mass change and gas analysis of 3D manganese oxide/graphene aerogel for supercapacitors†
Phansiri Sukthaab,
Poramane Chiochanab,
Atiweena Krittayavathananonab,
Sangchai Sarawutanukulab,
Sathyamoorthi Sethuraman ab and
Montree Sawangphruk*ab
ab and
Montree Sawangphruk*ab
aDepartment of Chemical and Biomolecular Engineering, School of Energy Science and Engineering, Vidyasirimedhi Institute of Science and Technology, Rayong 21210, Thailand. E-mail: Montree.s@vistec.ac.th
bCentre of Excellence for Energy Storage Technology (CEST), Vidyasirimedhi Institute of Science and Technology, Rayong 21210, Thailand
First published on 10th September 2019
Abstract
Manganese oxide nanoparticles decorated on 3D reduced graphene oxide aerogels (3D MnOx/rGOae) for neutral electrochemical capacitors were successfully produced by a rapid microwave reduction process within 20 s. The symmetric electrochemical capacitor of 3D MnOx/rGOae (Mn 3.0 at%) storing charges via both electric double layer capacitance (EDLC) and pseudocapacitance mechanisms exhibits a specific capacitance of 240 F g−1 as compared with 190 F g−1 of that using the bare 3D rGOae at 0.5 A g−1 in 1 M Na2SO4 (aq.) electrolyte. It retains 90% of the initial capacitance after 10![[thin space (1/6-em)]](https://www.rsc.org/images/entities/char_2009.gif) 000 cycles, demonstrating high cycling stability. In addition, the charge storage mechanism of 3D MnOx/rGOae was investigated using an electrochemical quartz crystal microbalance. In situ gas analysis using differential electrochemical mass spectrometry (DEMS) shows the CO2 evolution at a cell potential over 1 V indicating that the positive electrode is possibly the voltage limiting electrode in the full cell. This finding may be useful for further development of practical high power and energy supercapacitors.
000 cycles, demonstrating high cycling stability. In addition, the charge storage mechanism of 3D MnOx/rGOae was investigated using an electrochemical quartz crystal microbalance. In situ gas analysis using differential electrochemical mass spectrometry (DEMS) shows the CO2 evolution at a cell potential over 1 V indicating that the positive electrode is possibly the voltage limiting electrode in the full cell. This finding may be useful for further development of practical high power and energy supercapacitors.
Introduction
Electrochemical capacitors or supercapacitors (SCs) have attracted interest because of their high specific power, high charging–discharging rate, and long cycling stability.1–3 SCs can be classified by their charge storage mechanisms such as electrical double layer capacitor (EDLC) and pseudocapacitors. Generally, carbon-based materials are widely used as active materials in EDLCs storing charges by the electrosorption of ions on their surfaces. In contrast, pseudocapacitors store charge via redox reaction at the solid–liquid interface or the intercalation of ions at the surface.4 The conducting polymers and metal oxides are widely used as pseudocapacitive materials. Among them, manganese oxide is one of the best electrode materials for supercapacitors due to its good stability, low cost, natural abundance, and environmentally friendly nature.5,6 However, it has poor electrical conductivity (10−5 to 10−6 S cm−1).7 Therefore, it is usually combined with highly conductive carbon-based material such as carbon nanotube (CNT), carbon fibre, and graphene or reduced graphene oxide (rGO) to improve its electrochemical performance.2,8–10Graphene is widely used as supercapacitor electrode material due to its high electrical conductivity and high specific surface area.11,12 There are many reports relating to reduced graphene oxide/manganese oxide (rGO/MnOx) composites as supercapacitor electrodes. For example, the rGO/Mn3O4 composite produced by a hydrothermal process exhibits a specific capacitance of 121 F g−1 at 0.5 A g−1 in 1 M Na2SO4.13 Nitrogen doped graphene/Mn3O4 produced by the hydrothermal process shows a specific capacitance of 205 F g−1 at 1.0 A g−1.14 The rGO/Mn3O4 prepared by the N2 dielectric barrier discharge plasma exhibits a specific capacitance of 193 F g−1, while the specific capacitance of pure Mn3O4 is only 95 F g−1.15 Recently, 3D graphene has attracted interest because the 3D interconnected structure of graphene sheets can increase ion mobility and electron transport.16 For example, the graphene hydrogel shows a specific capacitance of 190 F g−1 at 0.5 A g−1 in 6 M KOH.17 3D rGO produced by the chemical reduction method shows a specific capacitance of 204 F g−1 at 0.5 A g−1 in 6 M KOH.18 3D graphene network shows a specific capacitance of 190 F g−1 at 0.5 A g−1 in 6 M KOH.19 The specific capacitance of 3D graphene aerogel is 245 F g−1 at 1.0 A g−1 in PVA/H3PO4 solid electrolyte.20
In this work, we further developed the supercapacitor electrode using the 3D manganese oxide/reduced graphene oxide aerogel (MnOx/rGOae) composite synthesized by a microwave reduction method. This technique is facile, effective, rapid, and environmentally friendly.21–25 The 3D MnOx/rGOae can store charges via the EDLC of 3D rGOae and the surface redox of MnOx leading to high power and energy. The charge storage mechanism of ion sorption was investigated by the electrochemical quartz crystal microbalance (EQCM) and in situ gas analysis using the differential electrochemical mass spectroscopy (DEMS). The DEMS can also provide the working potential limit without the gas evolution, which is a root of the poor stability of supercapacitors. The electrochemical performance of the symmetrical neutral supercapacitors using four composites with different MnOx loading contents. The symmetric electrochemical capacitor of 3D MnOx/rGOae (Mn 3.0 at%) exhibits a specific capacitance of 240 F g−1 as compared with 190 F g−1 of that using the bare 3D rGOae at 0.5 A g−1 in 1 M Na2SO4 (aq.) electrolyte.
Experimental
Chemicals and materials
Graphite powder (<20 μm, Aldrich), sodium nitrate (NaNO3, 99% Ajax Finechem), potassium permanganate (KMnO4, 99%, UNIVAR), sulphuric acid (H2SO4, 98%, QRec), nitric acid (HNO3 65%, QRec), hydrogen peroxide (H2O2, 30%, Chem Supply), hydrochloric acid (HCl, 37%, QRec), ethanol (99.9%, QRec), polyvinylidene fluoride (PVDF, Mw ∼ 534000, Sigma-Aldrich), carbon black (99+%, Super P), (N-methyl-2-pyrrolidone) (NMP, 99.5% QRec), and sodium sulfate (Na2SO4 99%, CARLO ERBA) were analytical reagent grade and used without further purification. Carbon fibre paper (CFP) was from SGL CARBON SE, Germany. Deionized water from Millipore system (DI water, 15 MΩ cm) was used in all experiments.
Synthesis of graphene oxide aerogel
Graphene oxide (GO) was synthesised using a modified Hummer's method. Briefly, 5.0 g graphite powder and 7.5 g NaNO3 were mixed in 500 mL conc. H2SO4 in an ice-bath keeping the temperature below 20 °C. 40 g KMnO4 was slowly added into the mixture and stirred for 24 h at an ambient temperature. Then, 500 mL DI water and 150 mL H2O2 were subsequently added into the mixture and kept stirring for 24 h. The mixture was washed with 5% HCl and then centrifuged with DI water for several times until neutral.26 Finally, the obtained product was then washed with DI water for several times and freeze-dried for 72 h.Synthesis of MnOx/rGOae composite
0.42 g GO aerogel was dispersed in 30 mL KMnO4 (0.088 M) solution with varying weight of GO:KMnO4 (1:1, 2:1, 4:1, and 8:1 by weight) becoming the suspension. Then, 0.25 mL ethanol was added into the suspension under constant magnetic stirring and then further stirred for 4 h at room temperature.27 Then, the GO/MnOx was filtered, washed with deionized water and ethanol, and dried at 60 °C for 24 h. The MnOx/GO was heated by a microwave reduction method at a power of 200 W for 20 s to obtain MnOx/rGOae. Finally, the obtained product was then dried at 80 °C for 24 h. The rGOae was synthesised by the microwave method at 200 W using GO aerogel precursor.
Fabrication of MnOx/rGOae composite electrodes
Active material powder (8 mg), carbon black (CB) using as a conductive additive (1 mg), and PVDF using as a binder (1 mg) were dispersed and sonicated in N-methyl-2-pyrrolidone (NMP, 1 mL) solvent. The as-prepared carbon slurry was then drop-coated on the functionalized-carbon fibre paper (f-CFP) with a diameter of 1.58 cm. The mass loading was about 1 mg cm−2. The electrode was dried at 80 °C for 24 h. The hydrolysed polyethylene (PE) film and 1 M Na2SO4 (aq.) were used as a separator and an electrolyte, respectively. Prior to the fabrication of supercapacitor, the separator was soaked in the electrolyte for 10 min. The symmetric supercapacitors were assembled in 2016-type coin cells using a hydraulic compression machine at 800 psi for the evaluation of electrochemical performance. Whilst, 2032-type coin cells with the hole were used for in situ gas analysis using DEMS. The CV was carried out at 10 mV s−1 up to the gas evolution with the predefined voltage intervals. For EQCM measurement, the carbon slurry was drop-coated on Au support (0.67 cm in diameter) about 0.22 mg cm−2. Ag/AgCl (3 M KCl) with gel electrolyte and Au wire were used as reference electrode and counter electrode, respectively.Characterization
The morphologies of as-synthesised materials were characterized by FE-SEM/EDS (FE-SEM, JEOL JSM-7610F), and TEM (TEM, Hitachi HT7700). The crystalline structure was characterized by XRD (Bruker D8 ADVANCE using Cu-Kα radiation (λ = 1.5418 Å)). The chemical structure was characterized by FTIR (PerkinElmer) and Raman spectroscopy (Bruker, an excitation wavelength of 532 nm). The specific surface area was measured by nitrogen adsorption/desorption with the BET method (BELSORP-mini, MicrotracBEL). The surface composition was analysed by X-ray photoelectron spectroscopy (XPS, JEOL, JSP-9010MC). In situ gas detection was carried out by DEMS (Hiden analytical, HPR-40). Cyclic voltammetry (CV) and galvanostatic charge–discharge measurement (GCD) were performed using a Metrohm AUTOLAB potentionstat (PGSTAT 302N) and battery tester (Neware, Gelon, HongKong), respectively.Results and discussion
The morphologies of rGOae and MnOx/rGOae composites were characterized by FE-SEM as shown in Fig. 1. The rGOae shows a 3D sponge like structure with the interconnected graphene sheets and macroporous voids (inset image in Fig. 1a). Spherical MnOx nanoparticles decorated on the graphene nano-sheet are observed for MnOx/rGOae composite (8:1 GO:KMnO4 ratio) (Fig. 1a). The number of nanoparticles decorated on the graphene nanosheet increase with increasing the concentration of Mn source for the synthesis of MnOx/rGOae composite. For example, the dense nanoparticle coverage on the graphene sheet is observed for 1:1 GO:KMnO4 ratio. It may decrease the total surface area and pore volume of the composite. Also, the MnOx particle size increases with increasing Mn source. The size of the nanoparticles is in the range of ∼10 to 50 nm.
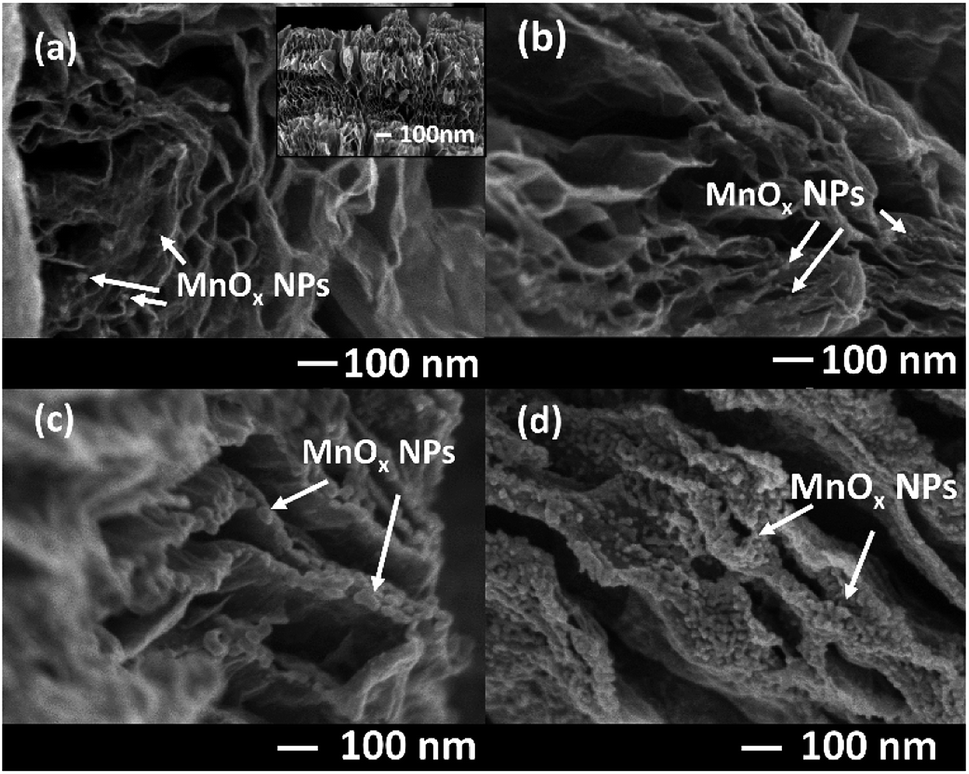 | ||
| Fig. 1 FE-SEM images of MnOx/rGOae with different GO:KMnO4 precursor weight ratios including (a) 8:1, (b) 4:1, (c) 2:1, and (d) 1:1. | ||
The elemental composition of MnOx/rGOae can be confirmed using the EDS technique. The EDS spectra (see Fig. S1†) show the C, O, Mn elements. The at.% of Mn increases with the increasing amount of Mn precursor. For instance, 2.5% and 6.1% of Mn were quantified for 8:1 and 1:1 GO:KMnO4, respectively. Also, the residual K element can be observed in the composite. In fact, it will not affect the electrochemical performance of the supercapacitor as it can be considered as a kind of K-intercalated MnOx.
To further investigate the morphology of samples, TEM images are presented in Fig. 2. The number of MnOx nanoparticles decorated on the rGO sheet increases with increasing Mn precursor. The MnOx nanoparticles are in the range of 10–30 nm for low content of KMnO4 precursor. At higher KMnO4 precursor content, the particle sizes of MnOx NPs are 10–50 nm. It corresponds with FE-SEM measurement.
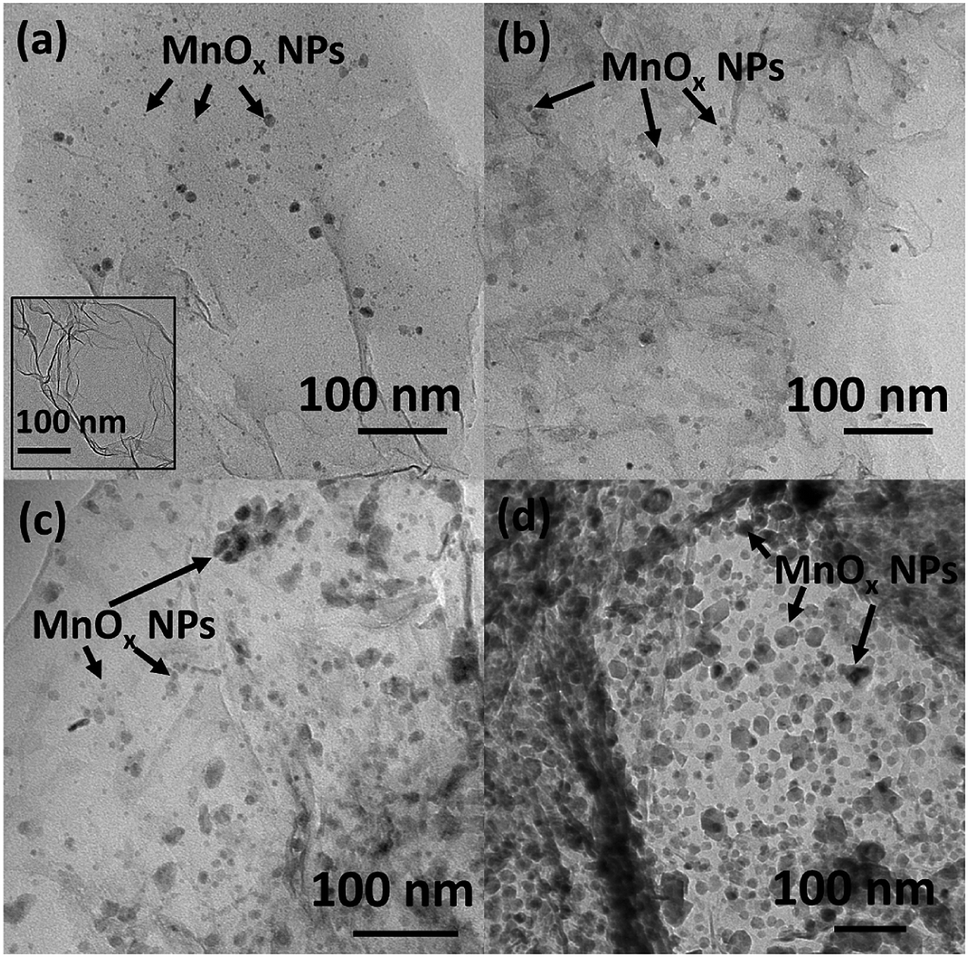 | ||
| Fig. 2 TEM images of MnOx/rGOae with different GO:KMnO4 precursor ratios including (a) 8:1, (b) 4:1, (c) 2:1, and (d) 1:1 wt%. | ||
The XRD patterns of the GOae, rGOae, and MnOx/rGOae composites are shown in Fig. 3a. The XRD pattern for GOae shows a characteristic peak at around 10°, corresponding to the (001) plane of graphene oxide. After the reduction of GOae by the microwave method, rGOae shows the broad peak at around 25.8° which is attributed to an (002) plane of graphitic carbon materials. It indicates the effective reduction of the oxygen-functional group on the GOae structure by microwave method. For MnOx/rGOae composites, the mixed phase of MnO and Mn3O4 and residual GO are observed.5
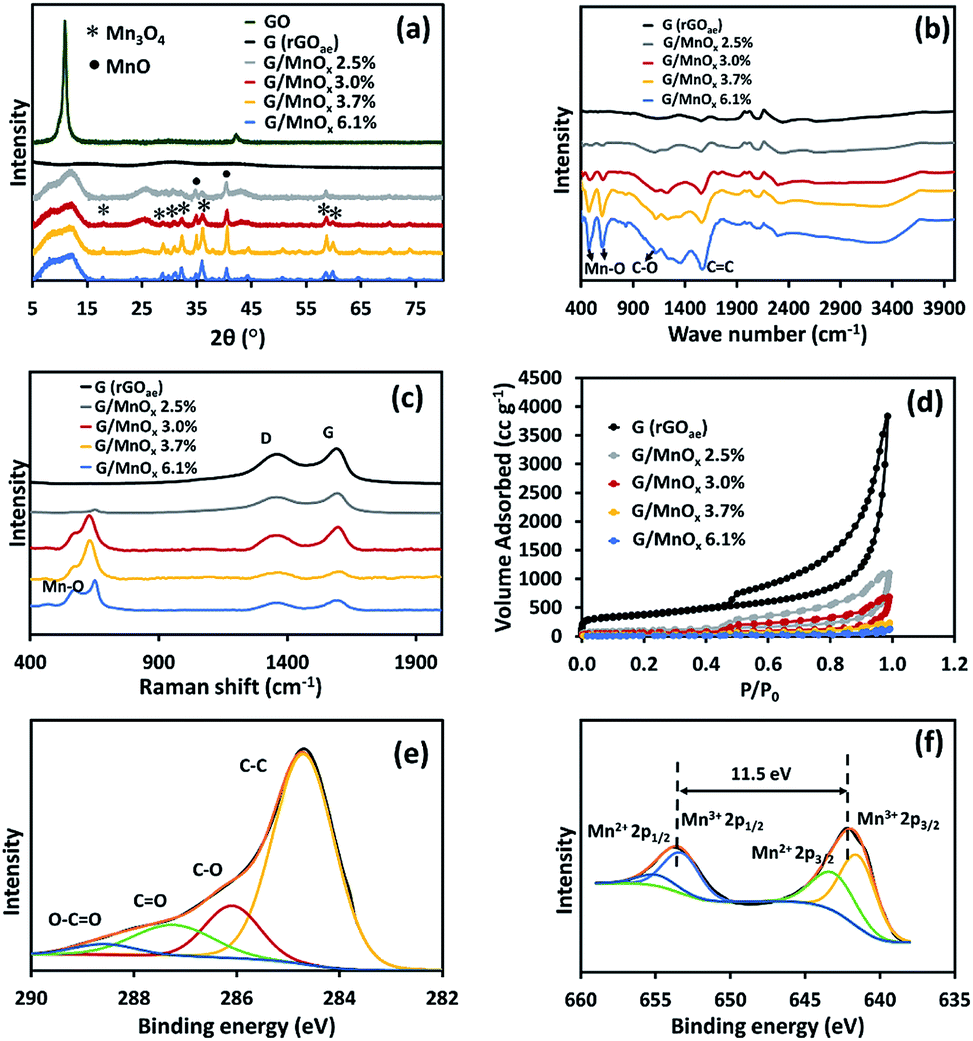 | ||
| Fig. 3 (a) XRD patterns, (b) FTIR spectra, (c) Raman spectra, (d) nitrogen adsorption/desorption isotherm, (e) XPS C 1s spectrum, and (f) XPS Mn 2p spectrum of MnOx/rGOae composite at the Mn content of 3.7 at%. | ||
The FTIR spectroscopy was used to identify functional groups of the rGOae and MnOx/rGOae composite. The FTIR spectra (Fig. 3b) show three peaks at 1610, 1216, and 1132 cm−1 which can be referred to the remaining C![[double bond, length as m-dash]](https://www.rsc.org/images/entities/char_e001.gif) C, C–O, and C–OH, respectively.28 Additionally, MnOx/rGOae composites exhibit two characteristic peaks at 492 and 614 cm−1 which can be attributed to Mn–O stretching.10
C, C–O, and C–OH, respectively.28 Additionally, MnOx/rGOae composites exhibit two characteristic peaks at 492 and 614 cm−1 which can be attributed to Mn–O stretching.10
Fig. 3c shows the Raman spectra of the as-synthesized materials showing D and G bands at 1360 and 1598 cm−1, respectively. D band corresponds to the disordered structure or defect (sp3 carbon), while the G band relates to the ordered structure (sp2) of carbon material. The intensity ratio of D to G band (ID/IG) can be used to evaluate the sp2 domain size and degree of the disorder of the graphene-based materials. The ID/IG ratio of rGOae is 0.84, while the MnOx/rGOae composites exhibit lower ratios in the range of 0.6–0.8 due to MnOx formation reaction decreases the surface defects.29 In addition, MnOx/rGOae composites peaks at 577 and 649 cm−1 are attributed to MnO.6
The nitrogen adsorption/desorption isotherms of rGOae and MnOx/rGOae composites are shown in Fig. 3d. Type-IV isotherms were obtained for all samples.30 The specific surface areas of rGOae and MnOx/rGOae with different Mn contents of 2.5, 3.0, 3.7, and 6.1 at% are 1279, 352, 200, 70, and 34 m2 g−1, respectively. The total pore volume of MnOx/rGOae decreases with increasing Mn content, which is 1.69, 1.02, 0.34, and 0.17 cm3 g−1, respectively. Whilst, the total pore volume of rGOae is 5.80 cm3 g−1. The average pore diameters of rGOae and MnOx/rGOae with Mn content of 2.5, 3.0, 3.7, and 6.1 at% are 21.2, 19.1, 20.5, 19.2, 20.6 nm, respectively.
XPS was carried to confirm the incorporation of MnOx on the graphene sheet. The XPS results of MnOx/rGOae composite with 3.7 at% Mn is shown in Fig. 3e and f. The C 1s spectrum can be deconvoluted into four peaks at 284.7, 286.1, 287.3, and 288.6 eV corresponding to the typical signals of C–C/CC, C–O (hydroxyl and epoxy groups), CO (carbonyl groups), and O–CO (carboxyl groups),29 respectively. Fig. 3f shows that the Mn 2p3/2 and Mn 2p1/2 of the MnOx in the composite exhibit the binding energies at 642.1 eV and 653.6 eV, respectively. The energy separation is 11.5 eV which is in good agreement for Mn3O4.31
CV and GCD were used to measure the electrochemical performance of symmetrical supercapacitors with different MnOx/rGOae composites. The CV (Fig. 4a) and GCD (Fig. 4b and c) of supercapacitors were measured at a cell potential of 1.2 V in 1 M Na2SO4 electrolyte. Fig. 4a shows the CV curves of symmetrical rGOae and MnOx/rGOae supercapacitors at a scan rate of 10 mV s−1 which show nearly rectangular shape. The specific capacitance (Fig. 4d) was calculated from the GCD as the following eqn (1):32
 | (1) |
000 cycles at a specific current of 2.0 A g−1 (Fig. 4e). Note, all electrochemical evaluation was operated at ca. 100% coulombic and energy efficiencies (see Fig. 4e).
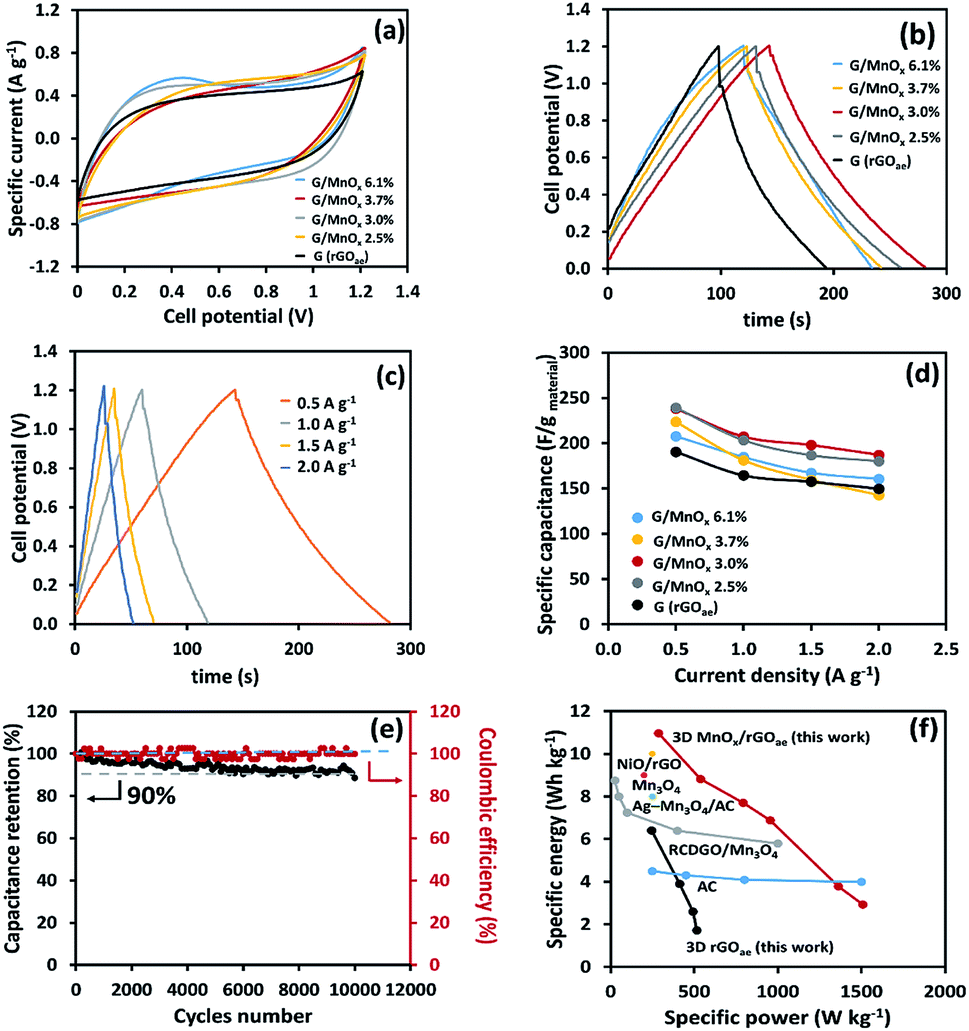 | ||
| Fig. 4 (a) CV curves at a scan rate of 10 mV s−1, (b) GCD curves at a specific current of 0.5 A g−1 of symmetric supercapacitors based on rGOae and MnOx/rGOae, (c) GCD curves at specific currents from 0.5 to 2.0 A g−1, (d) the specific capacitances of rGOae and MnOx/rGOae, (e) cycling performance of symmetric supercapacitor based on MnOx/rGOae at a Mn content of 3.0 at% at a specific current of 2.0 A g−1, and (f) Ragone plot as compared to other previous work. | ||
| Material | Specific capacitance | Electrolyte | Ref. |
|---|---|---|---|
| Graphene/Mn3O4 | 121 F g−1 at 0.5 A g−1 | 1 M Na2SO4 | 13 |
| Graphene/Mn3O4 | 225 F g−1 at 5 mV s−1 | 1 M Na2SO4 | 10 |
| Graphene sheet/Mn3O4 | 181F g−1 at 0.2 A g−1 | 1 M Na2SO4 | 39 |
| Graphene/Mn3O4 | 193 F g−1 at 0.05 A g−1 | Na2SO4 (sat.) | 15 |
| Graphene/Mn3O4 | 192 F g−1 at 0.5 A g−1 | K2SO4 (sat.) | 40 |
| rGO/Mn3O4 nanorods | 176 F g−1 at 1.0 A g−1 | 1 M Na2SO4 | 41 |
| rGO/Mn3O4 nanocomposite | 160 F g−1 at 0.5 A g−1 | 1 M Na2SO4 | 6 |
| Graphene oxide double-shell hollow spheres/Mn3O4 | 225 F g−1 at 5 mV s−1 | 0.5 M Na2SO4 | 29 |
| rGO/Mn3O4 | 186 F g−1 at 0.25 A g−1 | 1 M Na2SO4 | 42 |
| rGO/Mn3O4 | 194 F g−1 at 0.5 A g−1 | 1 M Na2SO4 | 43 |
| Graphene/Mn3O4 nanocrystalline | 260 F g−1 at 0.25 A g−1 | 1 M Na2SO4 | 44 |
| rGO/Mn3O4 | 195 F g−1 at 1.0 A g−1 | 1 M Na2SO4 | 45 |
| Graphene–Mn3O4 | 247 F g−1 at 5 mV s−1 | K2SO4 (sat.) | 46 |
| Porous graphene/Mn3O4 | 208 F g−1 at 0.5 A g−1 | 1 M Na2SO4 | 47 |
| 3D MnOx/rGO aerogel | 238 F g−1 at 0.5 A g−1 | 1 M Na2SO4 (2-electrode system) | This work |
| 266 F g−1 at 0.5 A g−1 | 1 M Na2SO4 |
The specific energy and specific power can be calculated from the following equation:
 | (2) |
 | (3) |
The CV and EQCM results of the MnOx/rGOae at a Mn content of 3.0 at% in 1.0 M Na2SO4 (aq.) at a scan rate of 10 mV s−1 are shown in Fig. 5. The quartz resonance frequency (Δf) related to mass change of electrode (Δm) by Sauerbrey's equation:37
| Δm = −CfΔf | (4) |
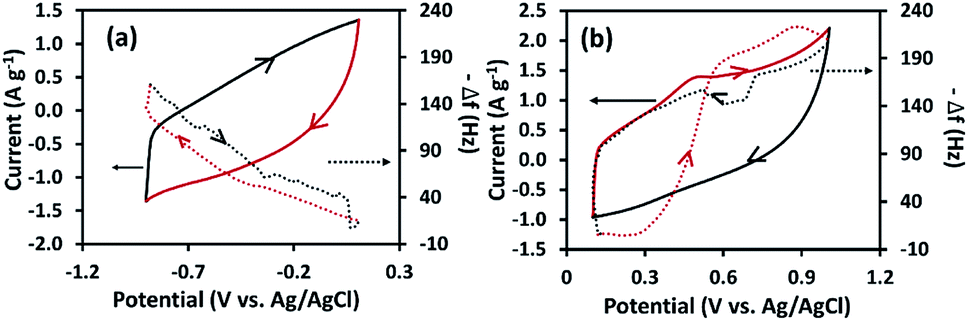 | ||
| Fig. 5 CVs and EQCM frequency response of MnOx/rGOae (3.0 at% Mn) at 10 mV s−1 in 1.0 M Na2SO4 (aq.) electrolyte in three electrode systems at (a) negative and (b) positive potential scans. Note that dashed lines present the frequency responses and solid lines present the CV response. Red and black curves represent charge and discharge of ions, respectively. | ||
To study the anion and cation contribution, the data were collected at two different potential ranges; positive and negative potential ranges. In Fig. 5a, the CV is started at the potential from 0.10 V to −1.00 V vs. Ag/AgCl. The opposite frequency response (−Δf) simultaneously increases implying that the electrode mass (Δm) increases owing to the adsorption of solvated Na+ ions. During the reverse scan from −1.00 to 0.07 V vs. Ag/AgCl, the mass change of the electrode decreases due to the desorption of solvated Na+. Between 0.05 and 0.25 V vs. Ag/AgCl in the positive sweep, the mass change of the electrode is almost the same because of the desorption of the solvated cations and adsorption of the solvated anion in the electrode surface. It is due to the double layer consisting solvated cations and anions at a zero charge potential.48 Further increment of potential up to 0.6 V results the steep increase of Δm due to the adsorption of solvated SO42− ions.49 Thereafter, a steady increment of Δm is noted up to the 0.9 V and the reduction of Δm is observed from 0.9 to 1.0 V. These changes cannot be explained based on the pure ion sorption process as it only increases the mass of the electrode. In this potential region, possibly the redox reaction of MnOx occurs49 along with the ion adsorption process. The former decreases the mass, while the latter increases the mass of the electrode. The mass change as a result of anion adsorption is the dominant process over the redox reaction of MnOx in the potential range of 0.6 to 0.9 V, which results in a steady increment of the electrode mass. While the dissolution process becomes a major role, thereafter, leading to the reduction of mass up to 1.0 V. On the reverse scan, the mass decreases steadily up to 0.05 V due to the desorption of the anion. A small increment of mass is noted at 0.65 V is possibly due to the redox reaction of MnOx.49 The mass changes in positive and negative potential ranges are 18 and 11 ng cm−2. The anion is adsorbed on the MnOx/rGOae surface with ca. 1.7 times higher than the cation adsorption.
DEMS was used for the in situ gas evolution analysis of symmetrical supercapacitors using the MnOx/rGOae composite during the CV measurement. Fig. 6 shows the gas evolution profile. The CO2 evolution starts at a cell potential of 1.0 V and above, possibly due to the carbon corrosion and the subsequent oxidation of corrosion product as a result of the oxygen evolution at the positive electrode (eqn(5)–(8)).50 It agrees well with the maximum cell potential identified by the long-term stability measurement. Initially, the oxygen/hydroxyl radicals generated at the carbon electrodes react with carbon leading to CO and CO2. The detection of CO2 alone indicates the further oxidation of CO into CO2.50
| H2O − ne− → OH˙ + H+ (n = 1), O˙ + 2H+ (n = 2) | (5) |
|
C + O˙/OH˙ → CO + C–OHads → CO(+H+)↑
| (6) |
| C + 2H2O − 4e− → CO/CO2↑ + 4H+ | (7) |
| CO + O/O2 − CO2↑ | (8) |
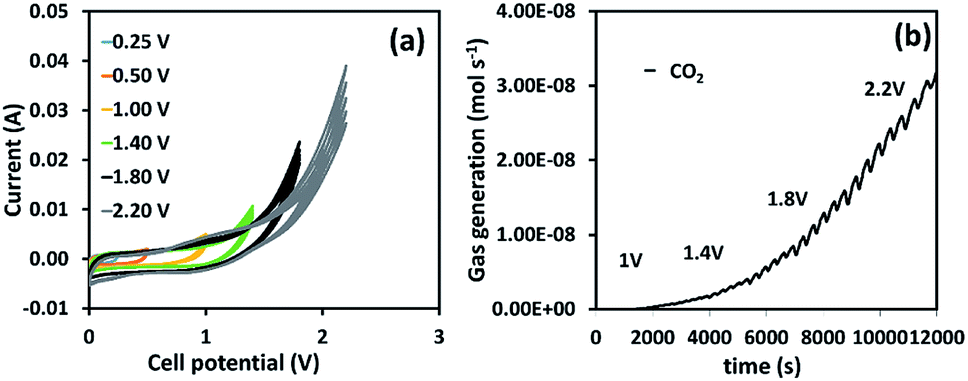 | ||
| Fig. 6 (a) CVs of the symmetrical supercapacitor of MnOx/rGOae (3.0 at% Mn) at 10 mV s−1 with different cell potential intervals and (b) CO2 evolution profile during CV measurement. | ||
Conclusion
The symmetric neutral electrochemical capacitor of MnOx/rGOae composites synthesised by a chemical and microwave synthesis exhibits a specific capacitance of 240 F g−1 at a specific current of 0.5 A g−1, a maximum specific energy of 10.9 W h kg−1 and a specific power of 286 W kg−1 in 1.0 M Na2SO4 (aq.). The cycling stability of 90% was measured after 10000 cycles at a cell potential of 0.9 V. In addition, the charge storage mechanism was investigated by electrochemical quartz crystal microbalance (EQCM), demonstrating the ion adsorption/desorption process and the dissolution of MnOx from MnOx/rGOae. DEMS measurement shows CO2 evolution at 1.0 V, which validates the identified maximum cell potential by the long-term stability test. Also, the detection of CO2 hints that the positive electrode possibly limits the cell potential. This finding will be useful for further development of practical high power and energy storage devices.
Conflicts of interest
There are no conflicts to declare.Acknowledgements
This work was financially supported by the Vidyasirimedhi Institute of Science and Technology and Thailand Research Fund (RSA6180031 and RTA6080005) as well as Energy Policy and Planning Office (EPPO), Ministry of Energy, Thailand. Support from the Frontier Research Centre at VISTEC is also acknowledged.References
- P. Yang and W. Mai, Nano Energy, 2014, 8, 274–290 CrossRef CAS.
- D. Zhou, H. Lin, F. Zhang, H. Niu, L. Cui, Q. Wang and F. Qu, Electrochim. Acta, 2015, 161, 427–435 CrossRef CAS.
- J. Yang, X. Yang, Y. L. Zhong and J. Y. Ying, Nano Energy, 2015, 13, 702–708 CrossRef CAS.
- D. Zhang, Y. Zhang, Y. Luo and P. K. Chu, Nano Energy, 2015, 13, 47–57 CrossRef CAS.
- X. Zhao, Y. Du, Y. Li and Q. Zhang, Ceram. Int., 2015, 41, 7402–7410 CrossRef CAS.
- X. She, X. Zhang, J. Liu, L. Li, X. Yu, Z. Huang and S. Shang, Mater. Res. Bull., 2015, 70, 945–950 CrossRef CAS.
- R. Peng, N. Wu, Y. Zheng, Y. Huang, Y. Luo, P. Yu and L. Zhuang, ACS Appl. Mater. Interfaces, 2016, 8, 8474–8480 CrossRef CAS PubMed.
- B. G. S. Raj, R. N. R. Ramprasad, A. M. Asiri, J. J. Wu and S. Anandan, Electrochim. Acta, 2015, 156, 127–137 CrossRef CAS.
- V. Hiremath, M. Cho and J. G. Seo, New J. Chem., 2018, 42, 19608–19614 RSC.
- Y. Wu, S. Liu, H. Wang, X. Wang, X. Zhang and G. Jin, Electrochim. Acta, 2013, 90, 210–218 CrossRef CAS.
- H. Fei, C. Yang, H. Bao and G. Wang, J. Power Sources, 2014, 266, 488–495 CrossRef CAS.
- H. Tang, Y. J. Zhang, Q. Q. Xiong, J. D. Cheng, Q. Zhang, X. L. Wang, C. D. Gu and J. P. Tu, Electrochim. Acta, 2015, 156, 86–93 CrossRef CAS.
- J. W. Lee, A. S. Hall, J.-D. Kim and T. E. Mallouk, Chem. Mater., 2012, 24, 1158–1164 CrossRef CAS.
- S. Yang, X. Song, P. Zhang and L. Gao, J. Mater. Chem. A, 2013, 1, 14162–14169 RSC.
- Q. Jiangying, G. Feng, Z. Quan, W. Zhiyu, H. Han, L. Beibei, W. Wubo, W. Xuzhen and Q. Jieshan, Nanoscale, 2013, 5, 2999–3005 RSC.
- W. Zhang, Z. Chen, X. Guo, K. Jin, Y. Wang, L. Li, Y. Zhang, Z. Wang, L. Sun and T. Zhang, Electrochim. Acta, 2018, 278, 51–60 CrossRef CAS.
- H. Banda, D. Aradilla, A. Benayad, Y. Chenavier, B. Daffos, L. Dubois and F. Duclairoir, J. Power Sources, 2017, 360, 538–547 CrossRef CAS.
- Y. Tan, D. Wu, T. Wang, P. Liu, J. Guo and D. Jia, Appl. Surf. Sci., 2018, 455, 683–695 CrossRef CAS.
- L. Wang, X. Ye, P. Zhao, H. Jiang, Y. Zhu, Z. Wan, G. Rao, S. You, G. Zeng and J. Fu, Appl. Surf. Sci., 2019, 467, 949–953 CrossRef.
- Q. Zhang, Y. Wang, B. Zhang, K. Zhao, P. He and B. Huang, Carbon, 2018, 127, 449–458 CrossRef CAS.
- M. Yang, K. G. Lee, S. J. Lee, S. B. Lee, Y.-K. Han and B. G. Choi, ACS Appl. Mater. Interfaces, 2015, 7, 22364–22371 CrossRef CAS PubMed.
- R. Kumar, R. K. Singh, A. R. Vaz, R. Savu and S. A. Moshkalev, ACS Appl. Mater. Interfaces, 2017, 9, 8880–8890 CrossRef CAS PubMed.
- T. Liu, H. Chai, D. Jia, Y. Su, T. Wang and W. Zhou, Electrochim. Acta, 2015, 180, 998–1006 CrossRef CAS.
- X. Xu, J. Shen, N. Li and M. Ye, J. Alloys Compd., 2014, 616, 58–65 CrossRef CAS.
- W. He, H. Qiu, J. Meng, B. Liu, J. Cui and Y. Zhang, J. Alloys Compd., 2019, 788, 183–190 CrossRef CAS.
- M. Sawangphruk, P. Srimuk, P. Chiochan, A. Krittayavathananon, S. Luanwuthi and J. Limtrakul, Carbon, 2013, 60, 109–116 CrossRef CAS.
- B. Patil, S. Ahn, S. Yu, H. Song, Y. Jeong, J. H. Kim and H. Ahn, Carbon, 2018, 134, 366–375 CrossRef CAS.
- G. S. Gund, D. P. Dubal, B. H. Patil, S. S. Shinde and C. D. Lokhande, Electrochim. Acta, 2013, 92, 205–215 CrossRef CAS.
- C. Zhang, L. Wang, Y. Zhao, Y. Tian and J. Liang, Carbon, 2016, 107, 100–108 CrossRef CAS.
- Z. Lin, G. H. Waller, Y. Liu, M. Liu and C.-p. Wong, Carbon, 2013, 53, 130–136 CrossRef CAS.
- L. Zhang, L. Zhao and J. Lian, RSC Adv., 2014, 4, 41838–41847 RSC.
- H. Cao, X. Peng, M. Zhao, P. Liu, B. Xu and J. Guo, RSC Adv., 2018, 8, 2858–2865 RSC.
- S. Nagamuthu, S. Vijayakumar and G. Muralidharan, Dalton Trans., 2014, 43, 17528–17538 RSC.
- F. Gao, J. Qu, Z. Zhao, Q. Zhou, B. Li and J. Qiu, Carbon, 2014, 80, 640–650 CrossRef CAS.
- X.-J. Ma, W.-B. Zhang, L.-B. Kong, Y.-C. Luo and L. Kang, RSC Adv., 2015, 5, 97239–97247 RSC.
- A. A. Yadav, S. Jadhav, D. Chougule, P. Patil, U. Chavan and Y. Kolekar, Electrochim. Acta, 2016, 206, 134–142 CrossRef CAS.
- W.-Y. Tsai, P.-L. Taberna and P. Simon, J. Am. Chem. Soc., 2014, 136, 8722–8728 CrossRef CAS PubMed.
- A. Krittayavathananon, T. Pettong, P. Kidkhunthod and M. Sawangphruk, Electrochim. Acta, 2017, 258, 1008–1015 CrossRef CAS.
- L. Li, K. H. Seng, H. Liu, I. P. Nevirkovets and Z. Guo, Electrochim. Acta, 2013, 87, 801–808 CrossRef CAS.
- F. Gao, J. Qu, Z. Zhao, Q. Zhou, B. Li and J. Qiu, Carbon, 2014, 80, 640–650 CrossRef CAS.
- Y. Liu, W. Wang, Y. Wang, Y. Ying, L. Sun and X. Peng, RSC Adv., 2014, 4, 16374–16379 RSC.
- J. Xu, X. Fan, Q. Xia, Z. Shao, B. Pei, Z. Yang, Z. Chen and W. Zhang, J. Alloys Compd., 2016, 685, 949–956 CrossRef CAS.
- Y. Wang, Z. Ji, X. Shen, K. Xu and A. Yuan, J. Alloys Compd., 2016, 684, 366–371 CrossRef CAS.
- X. Yang, Y. He, Y. Bai, J. Zhang, L. Kang, H. Xu, F. Shi, Z. Lei and Z.-H. Liu, Electrochim. Acta, 2016, 188, 398–405 CrossRef CAS.
- P. Rosaiah, J. Zhu, D. P. Shaik, O. Hussain, Y. Qiu and L. Zhao, J. Electroanal. Chem., 2017, 794, 78–85 CrossRef CAS.
- Y. Long, J. Xie, H. Li, Z. Liu and Y. Xie, J. Solid State Chem., 2017, 256, 256–265 CrossRef CAS.
- T. Wang, Q. Le, X. Guo, M. Huang, X. Liu, F. Dong, J. Zhang and Y. X. Zhang, ACS Sustainable Chem. Eng., 2018, 7, 831–837 CrossRef.
- J. M. Griffin, A. C. Forse, H. Wang, N. M. Trease, P.-L. Taberna, P. Simon and C. P. Grey, Faraday Discuss., 2015, 176, 49–68 RSC.
- Q. Li, J. M. Anderson, Y. Chen and L. Zhai, Electrochim. Acta, 2012, 59, 548–557 CrossRef CAS.
- M. He, K. Fic, E. Fra, P. Novák and E. J. Berg, Energy Environ. Sci., 2016, 9, 623–633 RSC.
Footnote |
| † Electronic supplementary information (ESI) available: EDS spectra, electrochemical performance and comparison table of rGO/MnOx composites. See DOI: 10.1039/c9ra05444h |
| This journal is © The Royal Society of Chemistry 2019 |