 Open Access Article
Effects of Sm on Fe–Mn catalysts for Fischer–Tropsch synthesis†
Zhonghao
Han
a,
Weixin
Qian
a,
Hongfang
Ma
a,
Haitao
Zhang
a,
Qiwen
Sun
b and
Weiyong
Ying
 *a
*a
aEngineering Research Center of Large Scale Reactor Engineering and Technology, Ministry of Education, State Key Laboratory of Chemical Engineering, East China University of Science and Technology, Shanghai 200237, China. E-mail: wying@ecust.edu.cn; Fax: +86 21 64252192; Tel: +86 21 64252151
bState Key Laboratory of Coal Liquefaction and Coal Chemical Technology, Shanghai 201203, China
First published on 10th October 2019
Abstract
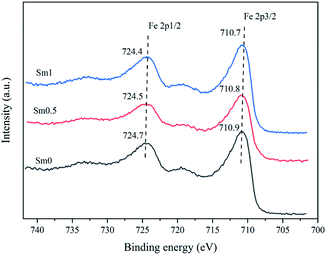
Sm-promoted FeMn catalysts were prepared by the co-precipitation method and characterized by N2 adsorption, XRD, CO-TPD, H2-TPD, CO2-TPD, H2-TPR, XPS and MES. It was found that compared with the un-promoted catalyst, when Sm was added at a proper content, the catalyst showed a larger BET surface area and promoted the formation of iron particles with a smaller size. The presence of Sm could increase the surface charge density of iron, which enhanced the Fe–C bond and promoted the stability and amount of CO dissociated adsorption, as confirmed by XPS and CO-TPD. Furthermore, according to MES, Sm could promote the formation of Fe5C2, which was the active phase of FTS. In addition, Sm could also enhance the basicity of the catalysts and suppress the H2 adsorption capacity, which inhibited the hydrogenation reaction and the conversion of olefins to paraffins, as verified by the results of CO2-TPD and H2-TPD. According to the FTS performance results, compared with the observations for the un-promoted catalysts, when the molar ratio of Sm to Fe was 1%, the CO conversion increased from 63.4% to 70.4%, the sum of light olefins in the product distribution increased from 26.6% to 32.6, and the ratio of olefins to paraffins increased to 4.18 from 4.09.
1. Introduction
Due to the shortage of fossil energy and the increasingly severe environmental problems, Fischer–Tropsch synthesis (FTS) has aroused much attention1 as it can convert syngas into raw oil and chemicals without sulfur, nitrogen and aromatic hydrocarbons.2 Many studies have shown that only iron and cobalt catalysts have the value of being industrialized.3 Cobalt-based catalysts have higher FTS activity as well as higher selectivity of high-carbon hydrocarbons and paraffins.4 Compared to cobalt-based catalysts, iron-based catalysts are attractive for their high water gas shift (WGS) and high CO2 selectivity due to the Boudouard mechanism.5,6In the Fischer–Tropsch synthesis, many metals have been introduced as promoters. The impact of the Group I alkali metals upon the activity of the iron catalysts was studied and it was found that potassium promotion provided an outstanding catalyst at the activity viewpoint for both the FTS and WGS reactions.7 Other research studies suggested that all Group II metal promoters yielded similar carbon utilization but with higher alpha values than that of an unpromoted catalyst in FTS.8,9 It is generally believed that manganese promoters in iron-based catalysts are beneficial for the formation of low-carbon olefins for FTS.10 The reason for this finding may be that manganese can enhance the adsorption capacity of CO and promote the formation of iron carbide.11 The study showed that the Mn promoter was beneficial for the formation of light carbon olefins.12,13 Some studies have shown that the introduction of Mn as a structure promoter into iron-based catalysts for the Fischer–Tropsch synthesis can enhance the stability of catalysts and promote the WGS reaction.14,15 In contrast, other reported Mn promoters enhanced the selectivity of olefins and C5+ but restrained the selectivity of methane.16,17 In addition, some studies have shown that structural promoters such as SiO2,18,19 Al2O3![[thin space (1/6-em)]](https://www.rsc.org/images/entities/char_2009.gif) 20 and TiO2 can improve the selectivity, activity and stability of iron-based catalysts.21
20 and TiO2 can improve the selectivity, activity and stability of iron-based catalysts.21
In recent years, rare earth metals have been reported as promoters. The catalytic performance of the precipitated Fe–Cu catalyst promoted with La, Ce, Nd, Eu and Th oxides was investigated and the results showed that rare earth metal oxides and Th promoters could increase the dispersion and stabilization of the iron-based catalysts, inhibiting their growth and further reduction.22 Some studies suggest that the introduction of a small amount of rare earth metal will greatly increase the performance of iron-based catalysts, but excessive rare earth metal promoters will significantly inhibit FTS.23,24 The effect of La2O3 on a precipitated iron catalyst showed that the addition of La2O3 increased the formation of methane while suppressing the selectivity for C5+ hydrocarbons.25
Although many rare earth metal promoters have been studied, few studies have been performed with samarium as promoters. The aim of this work was to investigate the influence of samarium upon the properties of iron-based catalysts in the FTS reaction. Iron-based catalysts modified by samarium were prepared by the co-precipitation method and tested under FTS conditions in a fixed tube reactor to analyse the promotion effect of samarium on the activity and product distribution. The influences of Sm2O3 on the structure, adsorption properties, reduction properties and FTS catalytic performance of the iron-based catalysts were researched via N2 adsorption, XRD, CO-TPD, H2-TPD, CO2-TPD, H2-TPR, XPS and Mössbauer spectroscopy.
2. Experimental
2.1. Catalyst preparation
The Sm-promoted catalysts were prepared by the co-precipitation method. A solution containing iron(III) nitrate nonahydrate (>99.99 wt% Shanghai Macklin Biochemical Co., Ltd), manganese nitrate (50 wt% Shanghai Macklin Biochemical Co., Ltd) and samarium(III) nitrate hexahydrate (>99.99 wt% Shanghai 3A Chemical Co., Ltd) with the desired ratio was precipitated by anhydrous sodium carbonate (>99.99 wt% Shanghai Macklin Biochemical Co., Ltd) at 65 °C. The pH value of the solution was kept at 8.0 ± 0.3. Then, the solution was stirred for 0.5 h and aged for 1 h. After washing, filtration and drying, the precipitate was treated at 550 °C for 3 h. The FeMnSm catalysts were prepared by the above methods. The molar compositions of the catalysts were 100Fe/10Mn/xSm (x = 0, 0.5, 1, 1.5 and 2), which were labeled as Sm0, Sm0.5, Sm1, Sm1.5 and Sm2, respectively.2.2. Catalyst characterization
N2 physical adsorption was performed at 77 K with a Micromeritics ASAP 2020 instrument. The samples were evacuated at 120 °C for 4 h before the adsorption measurement. Specific surface areas were measured using the Brunauer Emmett Teller (BET) method. Pore volumes and pore sizes were measured by the Barrett–Joyner–Halenda (BJH) procedure.The XRD patterns of the samples were obtained on a diffractometer operating with Cu Kα radiation at 40 kV with a scanning rate of 6° min−1 and 2θ angles ranging from 10 to 80°.
CO-TPD, H2-TPD and CO2-TPD were carried out using a Micromeritics Autochem 2920 apparatus with a thermal conductivity detector (TCD). About 100 mg samples were reduced under an H2 flow at 350 °C for 2 h and were cooled to 60 °C under an He gas flow. Afterwards, CO/H2/CO2 were introduced into the catalyst bed for 30 min. Then, the catalyst bed was purged by the flow for 60 min. Subsequently, the samples were heated to 800 °C at a rate of 10 °C min−1. The desorbed products were detected with the TCD detector.
H2-TPR of the fresh catalysts was carried out in a conventional atmospheric quartz flow reactor by a Micromeritics ASAP 2920 instrument. About 50 mg catalysts were purged in a flow of argon at 350 °C for 2 h and then cooled to 50 °C. Each sample was treated in 10% H2/90% Ar (v/v) at a flow rate of 50 ml min−1, and the reduction temperature was increased from room temperature to 800 °C at a rate of 10 °C min−1.
X-ray photoelectron spectroscopy (XPS) was performed on a VG ESCALAB 250Xi electron spectrometer equipped with a hemispherical analyzer operating in a constant pass energy mode and an Al Kα X-ray source operating at 10 mA and 12 kV. The samples were reduced by H2 at 350 °C and 0.1 Mpa for 10 h before the measurement. The reduced catalysts were placed in nitrogen to avoid oxidation.
Mössbauer spectroscopy (MES) of the catalyst samples was performed on an MR-351 constant-acceleration Mössbauer spectrometer (FAST, Germany) at room temperature with 57Co in a Pd matrix. The spectra were collected over 512 channels in the mirror image format. The Mössbauer parameters including an isomer shift (IS), quadruple splitting (QS), and hyperfine field (Hhf) were used to identify the components of the iron phase. The reacted catalysts were placed in nitrogen to avoid oxidation.
2.3. FTS performance
The FTS performance of the catalysts was conducted in a fixed bed reactor (ID = 10 mm). The detailed description of the reactor and the product analysis system has been provided elsewhere.26 The particle size of the catalysts was 60–80 mesh, and 0.3 g of the catalyst sample was mixed with 0.6 g of the same particle sized quartz grains. The catalysts were reduced with H2 at 350 °C, 0.10 MPa and GHSV 4000 ml g−1 h−1 for 10 h. The FTS catalyst activity tests were maintained at 300 °C, 1.0 MPa, H2/CO = 2 and 12![[thin space (1/6-em)]](https://www.rsc.org/images/entities/char_2009.gif) 000 ml g−1 h−1. After the FTS reaction, the outlet gases CO, H2, CH4, etc. were analyzed by online GC Agilent 7890A with a thermal conductivity detector (TCD). The waxes were dissolved in CS2 and detected off-line by GC Agilent 7890A with a flame ionization detector (FID).
000 ml g−1 h−1. After the FTS reaction, the outlet gases CO, H2, CH4, etc. were analyzed by online GC Agilent 7890A with a thermal conductivity detector (TCD). The waxes were dissolved in CS2 and detected off-line by GC Agilent 7890A with a flame ionization detector (FID).
3. Result and discussion
3.1. Catalyst characterization
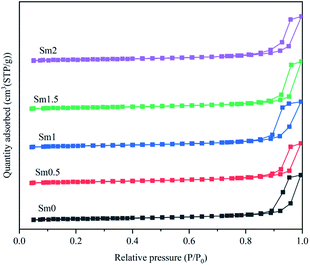
The BET surface areas, pore volumes and pore sizes of the fresh catalysts with various samarium contents are listed in Table 1. It can be seen that the BET surface areas of the catalysts first increase with the increase in samarium from 0 to 1%. This result can be due to the fact that the introduction of a small amount of rare earth metal promoters can increase the dispersion of iron atoms. With the continuous increase in the Sm promoter content from 1% to 2%, the specific surface area of the catalyst decreased, which indicated that rare earth oxides partly blocked the pore path of the catalysts. This may reduce the activity of the catalysts.
| Catalyst | S BET (m2 g−1) | D p a (nm) | V P b (cm3 g−1) | D Fe c (nm) |
|---|---|---|---|---|
| a BJH desorption average pore size. b BJH desorption pore volume. c Calculated by the Scherrer equation according to the results of XRD. | ||||
| Sm0 | 22.8 | 23.5 | 0.18 | 18.0 |
| Sm0.5 | 25.2 | 22.0 | 0.19 | 17.9 |
| Sm1 | 26.7 | 20.9 | 0.18 | 16.1 |
| Sm1.5 | 23.5 | 21.5 | 0.16 | 16.4 |
| Sm2 | 23.0 | 22.8 | 0.18 | 16.9 |
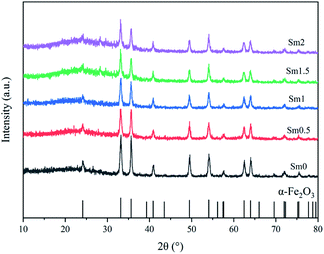
The X-ray powder diffraction patterns of fresh catalysts with different Sm loadings are shown in Fig. 2. All the fresh catalysts with different Sm contents showed the characteristic peaks of α-Fe2O3, which had a characteristic structure with 2θ values of 24.2, 33.2, 35.7, 40.9, 49.5, 54.1, 57.7, 62.5, and 64.1°; the XRD pattern of hematite Fe2O3 according to JCPDS #99-0060 is shown at the bottom of Fig. 2. On increasing the Sm content from 0 to 1%, the intensity of these peaks showed a decreasing trend, which indicated that the crystallinity of the iron phases became poor with the addition of samarium. The crystallite sizes of Fe2O3 were calculated by the Scherrer's equation according to the full spectrum data and are listed in Table 1. Therefore, Sm could maintain high dispersion of iron particles.
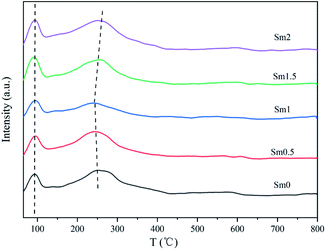
The results of H2-TPD are shown in Fig. 4. The peak temperature and desorption amount are shown in Table S2.† It can be seen that the H2-TPD patterns of all the catalysts contain two desorption peaks. The first one lower than 100 °C corresponds to the weakly adsorbed H species on the iron-based catalyst surface.33 The second peak in the range of 240–290 °C was ascribed to the strongly chemically adsorbed hydrogen on the deep sites of the iron surface.34 When the Sm content increased from 0 to 2%, the desorption peak in the low temperature zone hardly changed, indicating that Sm had no obvious effect on the low temperature adsorption of H2 on the catalysts. On the other hand, the desorption amount of sample Sm1 in high temperature zone is the smallest. This was because the addition of an appropriate amount of Sm increased the charge density of Fe, which inhibited the formation of the Fe–H bond and weakened the adsorption of H2.35
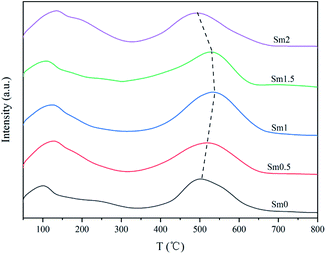
CO2-TPD was performed to get information about the surface basicity of the FeMnSm catalysts, as shown in Fig. 5. The peak temperature and desorption amount are shown in Table S3.† The CO2-TPD profiles of the FeMnSm catalysts could be divided into one desorption peak at a lower temperature (100 °C) and one peak at a higher temperature (450–550 °C). The first peak at about 100 °C could be contributed by weakly absorbed CO2 on the surface of the catalysts. The second one corresponded to the desorption of the strongly chemisorbed CO2. When the Sm content increased from 0 to 1%, the chemical adsorption peak area and desorption temperature increased significantly, showing that the basicity of the catalyst increased. However, when the Sm content continued to increase to 2%, the low temperature adsorption of CO2 increased and the strong adsorption decreased, proving that when Sm exceeded the appropriate value, the basicity of the catalyst decreased and the adsorption of CO2 changed from chemical adsorption to physical adsorption. A possible reason could be that the catalyst surfaces were covered and the active sites binding to CO2 were reduced.
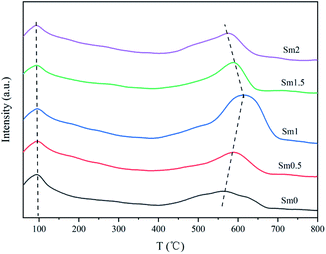
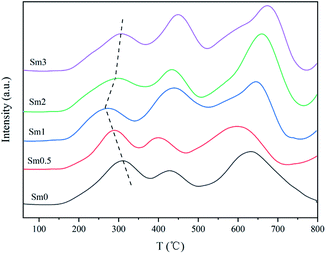
The H2-TPR profiles of the catalysts are shown in Fig. 6. Three obvious reduction peaks can be observed. The first peak between 250 and 300 °C represents α-Fe2O3 → Fe3O4. The second peak between 400 and 500 °C corresponds to the Fe3O4 → FeO process. The last peak over 600 °C represents FeO → α-Fe. The FeO phase was unstable below 590 °C. Therefore, Fe3O4 was partially reduced to α-Fe, and the remaining species were reduced to FeO.36 It is generally believed that the Fe species in the catalyst during reduction and reaction undergo the following transformation: Fe2O3 → Fe3O4 → Fe5C2.37 By comparing the first reduction peak of the sample, it can be found that the peak temperature decreased when Sm increased from 0 to 1%, indicating that the introduction of samarium into the iron-based catalyst enhanced the reduction process of α-Fe2O3 to Fe3O4.38 Nevertheless, when the Sm content continued to increase to 2%, the reduction peak temperature increased, indicating that the addition of excessive Sm was disadvantageous to catalyst reduction.
| Catalyst | Assignment | Hhf (kOe) | IS (mm s−1) | QS (mm s−1) | Γ/2 (mm s−1) | Area (%) |
|---|---|---|---|---|---|---|
a Reaction condition: 300 °C, H2/CO = 2, 1.0 MPa and 12![[thin space (1/6-em)]](https://www.rsc.org/images/entities/char_2009.gif) 000 ml g−1 h−1. 000 ml g−1 h−1.
|
||||||
| Sm0 | Fe3+(spm) | 0.30 | 1.09 | 0.29 | 9.3 | |
| Fe3O4(A) | 489.17 | 0.32 | −0.02 | 0.18 | 9.1 | |
| Fe3O4(B) | 454.49 | 0.63 | 0.00 | 0.32 | 17.2 | |
| χ-Fe5C2 | 215.84 | 0.30 | −0.11 | 0.20 | 13.6 | |
| 171.34 | 0.23 | −0.09 | 0.22 | 44.0 | ||
| 100.00 | 0.61 | 0.45 | 0.17 | 6.8 | ||
| Sm1 | Fe3+(spm) | 0.21 | 0.98 | 0.13 | 3.8 | |
| Fe3O4(A) | 488.10 | 0.30 | −0.24 | 0.10 | 4.8 | |
| Fe3O4(B) | 454.56 | 0.73 | 0.16 | 0.22 | 13.2 | |
| χ-Fe5C2 | 217.10 | 0.25 | −0.14 | 0.15 | 23.8 | |
| 175.96 | 0.26 | 0.10 | 0.27 | 36.7 | ||
| 107.5 | 0.13 | 0.10 | 0.17 | 16.4 | ||
| Sm2 | Fe3+(spm) | 0.35 | 0.98 | 0.23 | 9.7 | |
| Fe3O4(A) | 487.65 | 0.32 | −0.01 | 0.23 | 11.8 | |
| Fe3O4(B) | 453.21 | 0.65 | 0.02 | 0.35 | 18.2 | |
| χ-Fe5C2 | 214.18 | 0.27 | −0.13 | 0.22 | 10.6 | |
| 170.85 | 0.23 | −0.08 | 0.23 | 43.4 | ||
| 92.45 | 0.34 | 0.11 | 0.21 | 6.4 | ||
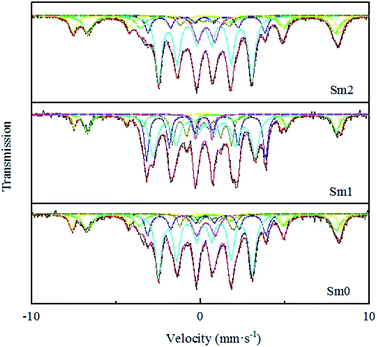
As shown in Table 2, the sextets with a hyperfine field (Hhf) of 487–490 and 453–455 kOe can be attributed to Fe3O4. The former represents the tetrahedron site (A site) in the Fe3O4 phase, and the latter represents the eight position sites (B site) in the Fe3O4 phase. The sextets with a hyperfine field (Hhf) of 214–218, 170–180 and 92–108 kOe could be attributed to χ-Fe5C2.42 It is generally believed that Fe5C2 is the reactive phase of the FTS reaction.43,44 Compared with the observation for the Sm-free catalyst, the content of Fe5C2 increased from 64.4% to 76.9% in the Sm1 catalyst based on the BET, CO-TPD and XPS studies. A possible explanation for this might be that a small amount of Sm could increase the dispersion of the iron-based catalyst, resulting in the increase in the Fe and CO binding sites.45 Moreover, the strong electron interaction between Sm and Fe promoted CO adsorption and enhanced the Fe–C bond, leading to more Fe5C2 formation. However, in the Sm2 sample, the content of χ-Fe5C2 decreased to 60.4%, which may be related to the blockage of the catalyst pores, resulting in a decrease in the number of active sites of the catalysts. Meanwhile, similar conclusions were reached from BET and CO-TPD. Furthermore, the remaining iron phases could be considered as un-reduced Fe3+ with a small grain superparamagnetic (spm) state. The content of Fe3+ (spm) in the Sm1 sample was the lowest, which meant that the reduction degree of Sm1 was the highest and was consistent with the conclusion from H2-TPR.
3.2. FTS performance
The activities and product distribution of the catalysts with different Sm loadings for FTS measured under the conditions of 300 °C, 1.0 MPa, 12![[thin space (1/6-em)]](https://www.rsc.org/images/entities/char_2009.gif) 000 ml g−1 h−1 and H2/CO = 2 in a fixed bed are shown in Table 3. According to the results, the CO conversion for the catalysts increased from 63.4% to 70.4% with the increase in the Sm loading from 0 to 1%. It is possible that these results were due to a combination of various factors. First, the BET surface area increased with the introduction of a small amount of Sm, and the large BET surface area provided more active sites, leading to higher CO conversion. Second, according to H2-TPR, the lowest first peak temperature for the sample Sm1 meant that it was the easiest to reduce to Fe3O4 and then convert to Fe5C2, which was also reflected in MES. Lastly, the results of XPS and CO-TPD showed that the addition of an appropriate amount of Sm can increase the electron density of the Fe surface, promoting CO adsorption as well as enhancing the formation of the Fe–C bonds. This benefited the generation of Fe5C2, as confirmed by MES, resulting in higher activity.46,47 When the Sm content increased from 1% to 2%, CO conversion decreased, which may be due to the decrease in the BET surface area. In this way, the number of active sites decreased. Meanwhile, the introduction of excessive Sm was not conducive to the reduction of the catalysts. Both factors hindered CO adsorption and inhibited iron carbide formation, finally leading to low FTS activity.48
000 ml g−1 h−1 and H2/CO = 2 in a fixed bed are shown in Table 3. According to the results, the CO conversion for the catalysts increased from 63.4% to 70.4% with the increase in the Sm loading from 0 to 1%. It is possible that these results were due to a combination of various factors. First, the BET surface area increased with the introduction of a small amount of Sm, and the large BET surface area provided more active sites, leading to higher CO conversion. Second, according to H2-TPR, the lowest first peak temperature for the sample Sm1 meant that it was the easiest to reduce to Fe3O4 and then convert to Fe5C2, which was also reflected in MES. Lastly, the results of XPS and CO-TPD showed that the addition of an appropriate amount of Sm can increase the electron density of the Fe surface, promoting CO adsorption as well as enhancing the formation of the Fe–C bonds. This benefited the generation of Fe5C2, as confirmed by MES, resulting in higher activity.46,47 When the Sm content increased from 1% to 2%, CO conversion decreased, which may be due to the decrease in the BET surface area. In this way, the number of active sites decreased. Meanwhile, the introduction of excessive Sm was not conducive to the reduction of the catalysts. Both factors hindered CO adsorption and inhibited iron carbide formation, finally leading to low FTS activity.48
| Catalyst | CO conversion (%) | CO2 selectivity (%) | HC distribution (%) | ||||
|---|---|---|---|---|---|---|---|
| C1 | C2–4![[double bond, length as m-dash]](https://www.rsc.org/images/entities/char_e001.gif) |
C2–40 | C5+ | O/P | |||
a Reduction conditions: T = 350 °C, P = 0.1 MPa, 4000 ml g−1 h−1, H2, TOS = 10 h. Reaction conditions: T = 300 °C, P = 1.0 MPa, 12![[thin space (1/6-em)]](https://www.rsc.org/images/entities/char_2009.gif) 000 ml g−1 h−1, H2/CO = 2. 000 ml g−1 h−1, H2/CO = 2.
|
|||||||
| Sm0 | 63.4 | 43.5 | 13.9 | 26.6 | 6.5 | 52.9 | 4.09 |
| Sm0.5 | 68.4 | 45.6 | 15.1 | 28.9 | 7.0 | 48.8 | 4.13 |
| Sm1 | 70.4 | 49.3 | 15.4 | 32.6 | 7.8 | 44.0 | 4.18 |
| Sm1.5 | 64.2 | 45.4 | 16.7 | 28.7 | 9.0 | 45.4 | 3.19 |
| Sm2 | 48.8 | 45.0 | 16.0 | 27.2 | 8.9 | 47.7 | 3.06 |
The FTS product selectivity of the catalysts with different Sm loadings and their detailed data are also listed in Table 3. The catalysts presented selectivity of C2–4![[double bond, length as m-dash]](https://www.rsc.org/images/entities/char_e001.gif) in the HC distribution, which increased from 26.6% to 32.6% after the addition of samarium from 0 to 1%, but it decreased to 27.7% as the Sm amount continued to increase to 2%. Research studies have shown that the formation of low-carbon olefins is related to the basicity of the catalyst surface.49,50 In short, increasing the surface basicity in the FTS catalyst can suppress H2 adsorption. The H2-TPD and CO2-TPD results indicated that the catalyst surface basicity increased, while the H2 concentration on the catalyst surface decreased from sample Sm0 to Sm1; however, this trend changed in the opposite direction from sample Sm1 to Sm2. Strong alkalinity and lower hydrogen adsorption properties inhibited the hydrogenation reaction, which suppressed the conversion of olefins to paraffins. Therefore, sample Sm1 with the strongest basicity and the weakest hydrogen adsorption showed the highest selectivity of C2–4
in the HC distribution, which increased from 26.6% to 32.6% after the addition of samarium from 0 to 1%, but it decreased to 27.7% as the Sm amount continued to increase to 2%. Research studies have shown that the formation of low-carbon olefins is related to the basicity of the catalyst surface.49,50 In short, increasing the surface basicity in the FTS catalyst can suppress H2 adsorption. The H2-TPD and CO2-TPD results indicated that the catalyst surface basicity increased, while the H2 concentration on the catalyst surface decreased from sample Sm0 to Sm1; however, this trend changed in the opposite direction from sample Sm1 to Sm2. Strong alkalinity and lower hydrogen adsorption properties inhibited the hydrogenation reaction, which suppressed the conversion of olefins to paraffins. Therefore, sample Sm1 with the strongest basicity and the weakest hydrogen adsorption showed the highest selectivity of C2–4![[double bond, length as m-dash]](https://www.rsc.org/images/entities/char_e001.gif) and the ratio of olefins to paraffins (O/P). In addition, the selectivity of C5+ was negatively correlated with conversion, which was consistent with the results reported in the literature.51,52
and the ratio of olefins to paraffins (O/P). In addition, the selectivity of C5+ was negatively correlated with conversion, which was consistent with the results reported in the literature.51,52
4. Conclusions
The Sm-promoted FeMn catalysts were prepared by the co-precipitation method and their performance was investigated in a fixed bed reactor. It was found that the highly selective production of light olefins can be achieved at higher activities over the FeMn catalysts promoted by a proper amount of Sm. In regard to the catalyst texture, Sm introduced into the samples could increase the BET surface areas, pore volumes and the formation of Fe particles with a smaller size. The presence of Sm could enhance the dissociated adsorption of CO and inhibit the adsorption of H2. Furthermore, the electron transfer between samarium and iron helped increase the surface charge density of the iron atoms, as confirmed by XPS. Sm could also promote the formation of Fe5C2, leading to high FTS activity. In addition, the introduction of an appropriate amount of Sm enhanced the basicity of the catalysts and inhibited the hydrogenation reaction, leading to the formation of more light olefins. As a result, the Sm1 sample exhibited 70.3% CO conversion, 32.6% C2–4![[double bond, length as m-dash]](https://www.rsc.org/images/entities/char_e001.gif) yield and O/P ratio of 4.18 at 300 °C, 1.0 MPa and WHSV of 12
yield and O/P ratio of 4.18 at 300 °C, 1.0 MPa and WHSV of 12![[thin space (1/6-em)]](https://www.rsc.org/images/entities/char_2009.gif) 000 ml g−1 h−1.
000 ml g−1 h−1.
Conflicts of interest
There are no conflicts to declare.Acknowledgements
We gratefully acknowledge the financial support from the National High Technology Research and Development Plan of China (863 plan, 2011AA05A204) and the Fundamental Research Funds for the Central Universities (No: 222201917013).Notes and references
- V. Garcilaso, J. Barrientos, L. F. Bobadilla, O. H. Laguna, M. Boutonnet, M. A. Centeno and J. A. Odriozola, Renewable Energy, 2019, 132, 1141–1150 CrossRef CAS.
- M. Janardanarao, Ind. Eng. Chem. Res., 1990, 29, 1735–1753 CrossRef CAS.
- H. Schulz, Appl. Catal., A, 1999, 186, 3–12 CrossRef CAS.
- T. T. Lari, RSC Adv., 2017, 7, 34497–34507 RSC.
- F. Tihay, A. C. Roger, A. Kiennemann and G. Pourroy, Catal. Today, 2000, 58, 263–269 CrossRef CAS.
- B. Liu, W. Li, J. Zheng, Q. Lin and X. Liu, Catal. Sci. Technol., 2018, 8, 5288–5301 RSC.
- W. Ngantsouehoc, Y. Q. Zhang, R. J. O'Brien, M. S. Luo and B. H. Davis, Appl. Catal., A, 2002, 236, 77–89 CrossRef CAS.
- M. Luo, B. H. Davis and H. Burtron, Appl. Catal., A, 2003, 246, 171–181 CrossRef CAS.
- Y. Xu, X. Jia and X. Liu, Catal. Sci. Technol., 2018, 8, 1953–1970 RSC.
- F. Morales, E. de Smit, F. M. de Groot, T. Visser and B. M. Weckhuysen, J. Catal., 2007, 246, 91–99 CrossRef CAS.
- J. B. Li, H. F. Ma, H. T. Zhang, Q. W. Sun, W. Y. Ying and D. Y. Fang, Fuel Process. Technol., 2014, 125, 119–124 CrossRef CAS.
- M. Feyzi, M. Irandoust and A. A. Mirzaei, J. Fuel Chem. Technol., 2012, 40, 550–557 CrossRef CAS.
- M. Feyzi, M. Irandoust and A. A. Mirzaei, Fuel Process. Technol., 2011, 92, 1136–1143 CrossRef CAS.
- N. Lohitharn, J. G. Goodwin and E. Lotero, J. Catal., 2008, 255, 104–113 CrossRef CAS.
- N. Lohitharn and J. G. Goodwin Jr, J. Catal., 2008, 257, 142–151 CrossRef CAS.
- H. Wang, Y. Yong, X. U. Jian, W. Hong, M. Ding and Y. Lia, J. Mol. Catal. A: Chem., 2010, 326, 29–40 CrossRef CAS.
- Ö. F. Gül, Ö. Ataç, İ. Boz and Ş. Özkara-Aydınoğlu, React. Kinet., Mech. Catal., 2016, 117, 147–159 CrossRef.
- Y. Yang, H. W. Xiang, L. Tian, H. Wang, C. H. Zhang, Z. C. Tao, Y. Y. Xu, B. Zhong and Y. W. Li, Appl. Catal., A, 2005, 284, 105–122 CrossRef CAS.
- H. N. Pham and A. K. Datye, Catal. Today, 2000, 58, 233–240 CrossRef CAS.
- H. Wan, B. Wu, C. Zhang, B. Teng and Z. TAO, Fuel, 2006, 85, 1371–1377 CrossRef CAS.
- V. P. Santos, L. Borges, S. Sartipi, B. V. D. Linden, A. I. Dugulan, A. Chojecki, T. Davidian, M. Ruitenbeek, G. R. Meima and F. Kapteijn, Appl. Catal., A, 2017, 533, 38–48 CrossRef CAS.
- D. Z. Wang, X. P. Cheng, Z. E. Huang, X. Z. Wang and S. Y. Peng, Appl. Catal., 1991, 77, 109–122 CrossRef CAS.
- W. Han, L. Wang, Z. Li, H. Tang, Y. Li, C. Huo, G. Lan, X. Yang and H. Liu, Appl. Catal., A, 2019, 572, 158–167 CrossRef CAS.
- X.-L. Zhou, G. P. Felcher and S.-H. Chen, Phys. B, 1991, 173, 167–179 CrossRef.
- L. Zhao, G. Liu and L. I. Jinlin, Chin. J. Catal., 2009, 30, 637–642 CrossRef CAS.
- W. Qian, H. Zhang, W. Ying and D. Fang, J. Nat. Gas Chem., 2011, 20, 389–396 CrossRef CAS.
- M. Thommes, K. Kaneko, A. V. Neimark, J. P. Olivier, F. Rodriguez-Reinoso, J. Rouquerol and K. S. Sing, Pure Appl. Chem., 2015, 87, 1051–1069 CAS.
- C.-I. Ahn and J. W. Bae, Catal. Today, 2016, 265, 27–35 CrossRef CAS.
- F. J. Pérez-Alonso, T. Herranz, S. Rojas, M. Ojeda, M. López Granados, P. Terreros, J. L. G. Fierro, M. Gracia and J. R. Gancedo, Green Chem., 2007, 9, 663–670 RSC.
- J. B. Li, H. F. Ma, H. T. Zhang, Q. W. Sun, W. Y. Ying and D. Y. Fang, Acta Phys.-Chim. Sin., 2014, 30, 1932–1940 CAS.
- S. K. Das, P. Mohanty, S. Majhi and K. K. Pant, Appl. Energy, 2013, 111, 267–276 CrossRef CAS.
- M. E. Dry, T. Shingles and C. S. V. H. Botha, J. Catal., 1970, 17, 341–346 CrossRef CAS.
- C. Nie, H. Zhang, H. Ma, W. Qian, Q. Sun and W. Ying, Catal. Lett., 2019, 1–8 Search PubMed.
- C. Zhang, G. Zhao, K. Liu, Y. Yang, H. Xiang and Y. Li, J. Mol. Catal. A: Chem., 2010, 328, 35–43 CrossRef CAS.
- F. Bozso, G. Ertl, M. Grunze and M. Weiss, Appl. Surf. Sci., 1977, 1, 103–119 CrossRef CAS.
- X. Gao, J. Zhang, N. Chen, Q. Ma, S. Fan, T. Zhao and N. Tsubaki, Chin. J. Catal., 2016, 37, 510–516 CrossRef CAS.
- R. A. Dictor and A. T. Bell, J. Catal., 1986, 97, 121–136 CrossRef CAS.
- I. R. Leith and M. G. Howden, Appl. Catal., 1988, 37, 75–92 CrossRef CAS.
- T. Yamashita and P. Hayes, Appl. Surf. Sci., 2008, 254, 2441–2449 CrossRef CAS.
- S. Qin, C. Zhang, J. Xu, Y. Yang, H. Xiang and Y. Li, Appl. Catal., A, 2011, 392, 118–126 CrossRef CAS.
- J. Huang, W. Qian, H. Zhang and W. Ying, Catal. Sci. Technol., 2017, 7, 5530–5539 RSC.
- M. H. Mahmoud, H. H. Hamdeh, J. C. Ho, M. J. O'Shea and J. C. Walker, J. Magn. Magn. Mater., 2000, 220, 139–146 CrossRef CAS.
- G. V. D. Laan and A. A. C. M. Beenackers, Catal. Rev., 1999, 41, 255–318 CrossRef.
- M. E. Dry, Catal. Today, 2002, 71, 227–241 CrossRef CAS.
- C. Yang, H. Zhao, Y. Hou and D. Ma, J. Am. Chem. Soc., 2012, 134, 15814–15821 CrossRef CAS.
- T. H. Pham, X. Duan, Q. Gang, X. Zhou and D. Chen, J. Phys. Chem. C, 2014, 118, 37–49 Search PubMed.
- J. Feng, Z. Min, L. Bing, Y. Xu and X. Liu, Catal. Sci. Technol., 2017, 7, 1245–1265 RSC.
- B. Liu, S. Geng, J. Zheng, X. Jia, F. Jiang and X. Liu, ChemCatChem, 2018, 10, 4718–4732 CrossRef CAS.
- Q. Chen, W. Qian, H. Zhang, H. Ma, Q. Sun and W. Ying, Catal. Commun., 2019, 4718–4732 Search PubMed.
- A. N. Pour, S. M. K. Shahri, H. R. Bozorgzadeh, Y. Zamani, A. Tavasoli and M. A. Marvast, Appl. Catal., A, 2008, 348, 201–208 CrossRef.
- J. L. Rankin and C. H. Bartholomew, J. Catal., 1986, 100, 526–532 CrossRef CAS.
- J. L. Rankin and C. H. Bartholomew, Cheminform, 1986, 100, 533–540 CAS.
Footnote |
| † Electronic supplementary information (ESI) available. See DOI: 10.1039/c9ra05337a |
| This journal is © The Royal Society of Chemistry 2019 |

